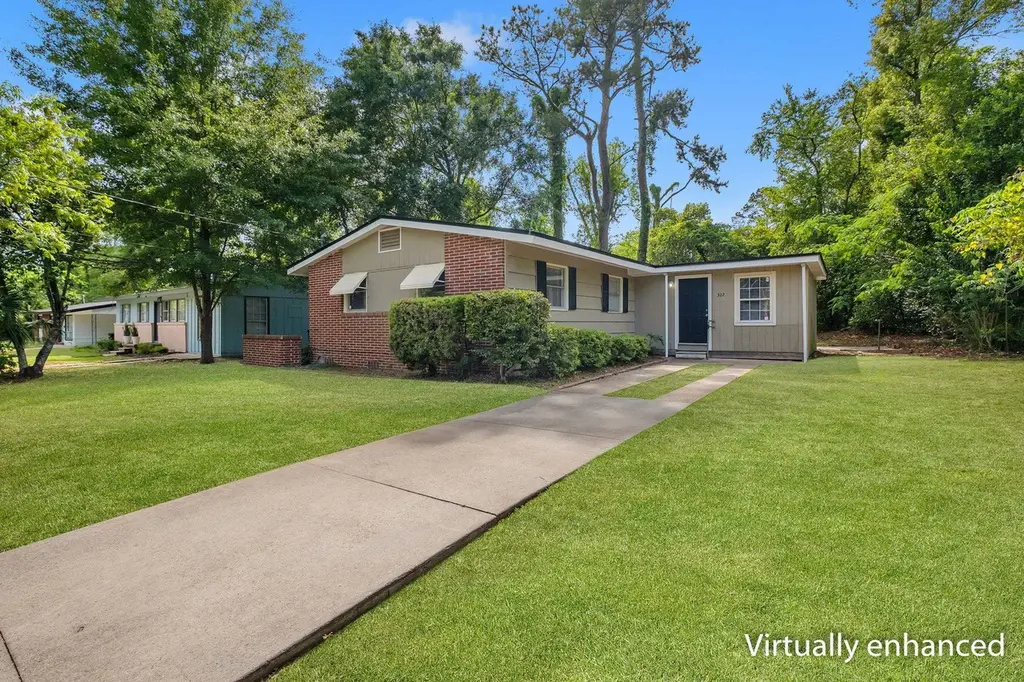
322 Meadowbrook Ln · Tallahassee, FL
Flood risk 1/10 · Minimal
- FEMA flood zone
- X (unshaded)
- Chance of flooding over 30 yrs
- 0.0%
- Est. flood insurance / yr
- $507 – $1,088
Fire risk 1/10 · Minimal
- Est. fire insurance / yr
- $947 – $1,759
Heat risk 8/10 · Major
- Hot days now (above 108°F)
- 7 days/yr
- Hot days in 30 yrs
- 20 days/yr
Wind risk 9/10 · Severe
- Chance of severe wind over 30 yrs
- 99.0%
Air-quality risk 4/10 · Minor
- Unhealthy air days now
- 5 days/yr
- Unhealthy air days in 30 yrs
- 6 days/yr
Risk factors via First Street. Map © Google.
Why this score? — see what drove the F grade
The composite is a weighted blend of 9 inputs, each scored 0–100. Each bar is that input's sub-score; the figure is the points it added to the 100-point composite (weight × sub-score).
- Cash flow +7.9/30.0
- ARV discount +5.7/15.0
- Schools +4.3/10.0
- Livability +4.3/5.0
- Rent growth +3.7/5.0
- Condition / age +2.5/5.0
- 1% rule +2.2/10.0
- DSCR +2.0/10.0
- Appreciation +0.0/10.0
$209,900
🖨 Deal sheet 📄 Offer letter ✓ Due diligence
Listing remarks MLS
* * * Highest and Best offers due by Sunday 4/2 at 5:00 with response time of Monday at 8:00 pm * * * Cute Bungalow style home has been partially updated and is within walking distance to Doak Campbell. Square Footage does not seem to include the 4th bedroom. There is also a large 20x7 screened porch on the back of the house and an almost fully fenced yard. Kitchen features beautiful wood cabinets and newer appliances. Vinyl plank floors throughout. Seller has never occupied property, no disclosures. Buyer to verify all measurements.
Key facts
- Brand new roof
- Ideal location
- Hot water heater
Tags
Property features AI
Exterior
- Parking: Driveway
- Utilities: Public sewer
- Home design: Single-story home
- Construction: Brick and wood siding exterior
- Exterior features: Covered patio and porch; Screened porch; Partial fencing; Paved, publicly maintained road access
Interior
- Kitchen: Dishwasher; Microwave; Oven; Range; Refrigerator
- Flooring: Plank flooring; Vinyl flooring
- Bathrooms: 2 full bathrooms
- Heating & cooling: Central heating; Central air; Ceiling fans; Electric cooling; Wall/window AC units
- Interior features: Split bedroom layout; Screened porch
- Laundry & utility: Washer; Dryer
Neighborhood map
What this means for you Summary
Snapshot
- This is a 3-bed/1.0-bath single-family listed at $210k.
Deal economics
- At list price, monthly cash flow is $-220 ($-3k/yr) — negative.
- To cash-flow at today's rent, offer at most $171k (18.5% below list).
- To meet the 1% rule (rent ≥ 1% of price), the offer needs to be $151k (27.9% below list).
- Recommended offer: $151k (27.9% below list) — sets the bar for 1% rule.
- Cap rate 5.0% vs local median 4.2% in Tallahassee — meaningfully above typical; check what's discounted (condition, days-on-market, listing class) to confirm the premium yield is real.
Location & tenants
- Location reads 86/100 on livability (#19 in FL, #429 nationally) — a professional / high-income tenant draw. Strengths: amenities A+, commute A+, health & safety A+; Watch: employment D.
- Leon (urban): math 48% / reading 53% proficiency, ranked #33 of 73 in FL (top 45%) — acceptable for families but not a draw, mixed tenant base, ~2y average lease.
- Market conditions: Rents rising fast (+4.7%/yr); 142 active listings in the ZIP; 34 comparable units currently listed for rent nearby; rentals at typical pace (median 22d on market — plan ~3-4 weeks tenant-placement turnaround); lower-income renter base — watch delinquency; 1,765 units permitted in Leon County in 2024 (975 in 5+ unit buildings).
- At $1,514/mo this rent would consume 56% of the median local household income ($32k/yr) (locally 6995% of renters already pay >50% of income on rent) — very limited rent-growth headroom before tenants either downsize or default.
Forward outlook
- Local home prices are declining (-3.0%/yr); year-one equity from $1k of loan paydown is wiped out by about $6k of value loss. Plan a longer hold.
- Leon County population projected at +23% by 2050 — long-run rental-demand tailwind backs the buy-and-hold thesis.
Negotiation context
- It's been on market 30 days — a 2% lower offer ($207k) is reasonable based on typical stale-listing flexibility.
- 3 sale attempts since 3y ago with the ask held roughly flat each time — persistent listings suggest the price (not the market) is what's stuck; bring a comps-based counter.
- Current owner paid $157k; 34% above their basis — modest negotiation headroom, anchor on the comps not their cost.
Risks & watch-outs
- Watch-outs: built in 1959 — expect roof / HVAC / electrical / plumbing capex.
- Climate carrying-cost: severe wind risk, 99% chance of damaging wind over 30y; extreme-heat days projected 7→20/yr by 2055 (HVAC capex compounding) — expect insurance premiums to compound above CPI over the hold.
Questions for the listing agent
- What do current leases actually rent for vs. the listed asking? Can we see a recent rent roll and the last 12 months of T-12 income?
- Built in 1959 — when were the roof, HVAC, electrical panel, plumbing, and water heater last replaced?
- Is there a deadline driving the sale (1031 exchange, divorce, estate, relocation)? That informs how much negotiation room exists.
- Schools are B-rated — typically a magnet for longer-tenancy family renters. What's the average tenant stay here, and is there a school-zone premium baked into asking?
- The area grade is low — what's the realistic commute time and amenity access for the typical tenant pool here? Any planned neighborhood developments (good or bad) we should know about?
- What's the average days-on-market for RENTAL listings here right now (not sales)? A rising rental-DOM trend means longer vacancies and softer asking-rent achievability than the comps imply.
- What's the recent tenant-quality profile in this submarket — average credit score on applications, eviction rate, late-payment / NSF rate, and stable-employment percentage? A property-management company in the area should have these aggregated.
- How much new for-sale + rental construction is in the pipeline within 1–3 miles? Heavy new supply typically softens prices + rents 12–24 months out; constrained supply supports both.
Investment metrics
- 1% rule
- 0.72% ✗
- Cap rate
- 5.04%
- Cash-on-cash
- -4.49%
- DSCR
- 0.80
- GRM
- 11.6
CMA / ARV
- ARV (on-the-fly)
- $201,891
- Comps found
- 12
Show comp detail 12 sales within ~0.75 mi
| Address | Dist | Beds/Ba | Sqft | Sold | Price | $/sf | Match |
|---|---|---|---|---|---|---|---|
| 2112 Cambridge Dr | 0.06mi | 3/1.5 | 1,196 (+2%) | 8mo | $213,000 | $178 | 84 |
| 2127 Oxford Rd | 0.08mi | 3/3.0 | 1,250 (+7%) | 6mo | $212,000 | $170 | 72 |
| 901 Brave Trl | 0.40mi | 3/2.0 | 1,092 (-6%) | 3mo | $199,900 | $183 | 64 |
| 202 Valencia Dr | 0.50mi | 2/2.0 (-1) | 1,164 (-0%) | 6mo | $130,000 | $112 | 62 |
| 2124 Cambridge Dr | 0.05mi | 4/2.0 (+1) | 1,296 (+11%) | 11mo | $241,000 | $186 | 61 |
| 1751 Pepper Dr | 0.68mi | 4/2.0 (+1) | 1,186 (+2%) | 4mo | $205,000 | $173 | 53 |
| 1811 Jackson Bluff Rd | 0.58mi | 3/1.0 | 1,042 (-11%) | 3mo | $115,000 | $110 | 53 |
| 817 S Lipona Rd | 0.47mi | 3/1.0 | 1,340 (+15%) | 2mo | $138,000 | $103 | 52 |
| 1815 Mayhew St | 0.53mi | 3/3.0 | 1,292 (+11%) | 5mo | $245,000 | $190 | 45 |
| 1737 Atkamire Dr | 0.63mi | 3/1.0 | 1,026 (-12%) | 7mo | $180,000 | $175 | 45 |
| 1733 Atkamire Dr | 0.64mi | 4/2.0 (+1) | 1,268 (+9%) | 9mo | $160,000 | $126 | 39 |
| 1821 Jackson Bluff Rd | 0.51mi | 4/2.0 (+1) | 1,306 (+12%) | 11mo | $175,000 | $134 | 38 |
Match score weights: distance 35% · size 25% · config 20% · recency 20%. Top-matched comps best support the ARV.
Projected returns pro-forma
-3.0% appreciation · 4.69% rent growth · sell at horizon
- IRR
- -22.1%
- Equity multiple
- 0.23×
- Total profit
- $-45,404
- Equity at exit
- $31,297
- IRR
- -12.5%
- Equity multiple
- 0.21×
- Total profit
- $-46,453
- Equity at exit
- $18,148
Cash invested: $58,772 (down + closing). Projections, not guarantees.
Landlord ↔ Tenant lean methodology
- Overall (STATE)
- 87 Strongly Landlord-Friendly
- State Florida
- 87 Strongly Landlord-Friendly · R+3
- County
- — inherits STATE
- City
- — inherits STATE
ZIP-level market 32304
- Home prices YoY
- -21.2%
- Rents YoY
- 4.7%
- Active inventory
- 142
- Price-to-rent
- 11.6×
Monthly cashflow live
- Estimated rent
- $1,514 high interval (Pro) →
- Mortgage (P&I)
- −$1,101
- Tax from tax record
- −$228 /mo · $2,733/yr
- Insurance
- −$87
- HOA
- −$0
- Vacancy / Maint / Mgmt
- −$318
- Net cashflow
- $-220
Break-even live
UW: 25.0% down · 7.5% · 30yr · 1.5% tax · 5.0% vac · 8.0% maint · 8.0% mgmt
Financing live
Cash to close
- Down payment
- $52,475
- Closing costs
- $6,297
- Reserves months
- —
- Total cash needed
- —
Loan-product check · same deal, 3 products live
Conventional
25% down · 7.5% · 30yr
- Down + closing
- —
- Monthly P&I
- —
- Monthly cashflow
- —
- DSCR
- —
- Eligible?
- —
Personal DTI + credit; lowest rate.
DSCR
20% down · 8.5% · 30yr
- Down + closing
- —
- Monthly P&I
- —
- Monthly cashflow
- —
- DSCR
- —
- Eligible?
- —
No personal income docs; deal must DSCR.
Hard money
10% down · 12.0% · 12mo
- Down + closing
- —
- Monthly P&I
- —
- Monthly cashflow
- —
- DSCR
- —
- Eligible?
- —
Short-term bridge; refi at stabilization.
Rent comps 34 comps
| Address | Beds | Baths | Sqft | Rent | $/sqft | DOM | Units | Dist |
|---|---|---|---|---|---|---|---|---|
| 316 Ausley Rd Tallahassee, FL | 1.0–4.0 | 1.0–2.0 | 750 | $1,197 | $1.60 | 14d | 8 | 0.11mi |
| 2125 Jackson Bluff Rd Tallahassee, FL | 1.0–3.0 | 1.0–2.0 | 975 | $1,399 | $1.43 | 21d | 4 | 0.17mi |
| 2131 Jackson Bluff Rd Tallahassee, FL | 2.0 | 2.0 | 1043 | $1,257 | $1.21 | 14d | 3 | 0.20mi |
| 317 Mabry St Tallahassee, FL | 2.0 | 1.0 | 808 | $898 | $1.11 | 21d | 1 | 0.39mi |
| 2202 W Pensacola St Tallahassee, FL | 1.0–3.0 | 1.0 | 950 | $1,499 | $1.58 | 21d | 3 | 0.40mi |
| 301 S Lipona Rd #24 Tallahassee, FL | 2.0 | 1.5 | 896 | $1,350 | $1.51 | 21d | 1 | 0.42mi |
| 930 S Lipona Rd Unit D Tallahassee, FL | 2.0 | 2.0 | 896 | $1,295 | $1.45 | 21d | 1 | 0.46mi |
| 1854 Belle Vue Way Tallahassee, FL | 2.0–4.0 | 1.0–2.0 | 1100 | $1,768 | $1.61 | 21d | 1 | 0.49mi |
| 1801 Lenora Dr Tallahassee, FL | 3.0 | 1.0 | 1150 | $1,800 | $1.57 | 21d | 1 | 0.58mi |
| 205 White Dr Tallahassee, FL | 1.0–4.0 | 1.0–4.0 | 1155 | $796 | $0.69 | 21d | 1 | 0.59mi |
| 1717 Airport Dr Unit 1717-2 Tallahassee, FL | 4.0 | 2.5 | 1250 | $1,900 | $1.52 | 21d | 1 | 0.61mi |
| 220 Atkinson Dr Unit D Tallahassee, FL | 2.0 | 1.0 | 928 | $1,100 | $1.19 | 21d | 1 | 0.62mi |
| 1612 Overstreet St Tallahassee, FL | 3.0 | 3.0 | 1500 | $3,300 | $2.20 | 21d | 1 | 0.78mi |
| 1643 Sharkey St Tallahassee, FL | 3.0 | 1.0 | 912 | $1,350 | $1.48 | 21d | 1 | 0.79mi |
| 103 Cactus St Tallahassee, FL | 2.0–4.0 | 1.0–2.0 | 1000 | $1,395 | $1.40 | 14d | 3 | 0.84mi |
| 1606 Airport Dr Tallahassee, FL | 3.0 | 2.0 | 1008 | $1,395 | $1.38 | 21d | 1 | 0.84mi |
| 2182 Timberwood Cir S Unit 1 Tallahassee, FL | 3.0 | 2.5 | 1280 | $1,599 | $1.25 | 21d | 1 | 0.86mi |
| 1615 Sharkey St Tallahassee, FL | 4.0 | 2.0 | 1278 | $1,600 | $1.25 | 21d | 1 | 0.88mi |
| 1327 Jackson Bluff Rd Tallahassee, FL | 2.0–4.0 | 2.0 | 1450 | $685 | $0.47 | 21d | 1 | 0.92mi |
| 1303 Airport Dr Unit A08 Tallahassee, FL | 2.0 | 2.5 | 1083 | $1,475 | $1.36 | 21d | 1 | 0.97mi |
| 1426 Pepper Dr Tallahassee, FL | 2.0 | 1.0 | 858 | $1,250 | $1.46 | 21d | 1 | 0.98mi |
| 2350 Horne Ave Unit 2 Tallahassee, FL | 2.0 | 2.0 | 800 | $995 | $1.24 | 21d | 1 | 0.98mi |
| 1616 McCaskill Ave Tallahassee, FL | 1.0–2.0 | 1.0 | 750 | $969 | $1.29 | 21d | 43 | 1.01mi |
| 322 Conradi St Tallahassee, FL | 3.0 | 2.0 | 1100 | $1,950 | $1.77 | 21d | 4 | 1.02mi |
| 1001 Ocala Rd Tallahassee, FL | 4.0 | 1.0–2.0 | 899 | $642 | $0.71 | 21d | 6 | 1.10mi |
| 1525 W Tennessee St #307 Tallahassee, FL | 2.0 | 1.0 | 1200 | $1,600 | $1.33 | 21d | 1 | 1.19mi |
| 2353 W Mission Rd Tallahassee, FL | 2.0–3.0 | 2.0–2.5 | 1012 | $1,450 | $1.43 | 14d | 11 | 1.24mi |
| 1240 Levy Ave Tallahassee, FL | 3.0 | 1.0 | 1290 | $1,350 | $1.05 | 21d | 1 | 1.31mi |
| 832 Arkansas St Tallahassee, FL | 3.0 | 1.0 | 1296 | $1,400 | $1.08 | 21d | 1 | 1.39mi |
| 833 W Gaines St Tallahassee, FL | 2.0 | 2.0 | 1080 | $2,350 | $2.18 | 14d | 2 | 1.39mi |
| 2060 Continental Ave Tallahassee, FL | 1.0–3.0 | 1.0–2.5 | 1121 | $1,185 | $1.06 | 14d | 26 | 1.42mi |
| 2020 Continental Ave Tallahassee, FL | 1.0–2.0 | 1.0–1.5 | 850 | $1,300 | $1.53 | 21d | 3 | 1.42mi |
| 1329 Nylic St #1 Tallahassee, FL | 3.0 | 3.0 | 1275 | $1,800 | $1.41 | 21d | 1 | 1.45mi |
| 808 Saint Augustine St Tallahassee, FL | 2.0 | 2.5 | 1500 | $2,095 | $1.40 | 21d | 1 | 1.46mi |
Listing history 27 events
-
2026-06-18days on market $209,900 Active 30 DOM
-
2026-06-17days on market $209,900 Active 29 DOM
-
2026-06-16days on market $209,900 Active 28 DOM
-
2026-06-15days on market $209,900 Active 27 DOM
-
2026-06-14days on market $209,900 Active 25 DOM
-
2026-06-10days on market $209,900 Active 22 DOM
-
2026-06-09days on market $209,900 Active 21 DOM
-
2026-06-08days on market $209,900 Active 20 DOM
-
2026-06-07days on market $209,900 Active 19 DOM
-
2026-06-05days on market $209,900 Active 16 DOM
-
2026-06-03days on market $209,900 Active 15 DOM
-
2026-06-02days on market $209,900 Active 14 DOM
-
2026-06-01days on market $209,900 Active 13 DOM
-
2026-05-31days on market $209,900 Active 12 DOM
-
2026-05-30days on market $209,900 Active 11 DOM
-
2026-05-19$209,900 Active
-
2026-05-19historical
-
2026-04-21$219,900 Active
-
2023-05-08soldstatus $157,000
-
2023-05-03soldstatus $157,000 Closed 546-char remark
Show marketing remark (546 chars)
* * * Highest and Best offers due by Sunday 4/2 at 5:00 with response time of Monday at 8:00 pm * * * Cute Bungalow style home has been partially updated and is within walking distance to Doak Campbell. Square Footage does not seem to include the 4th bedroom. There is also a large 20x7 screened porch on the back of the house and an almost fully fenced yard. Kitchen features beautiful wood cabinets and newer appliances. Vinyl plank floors throughout. Seller has never occupied property, no disclosures. Buyer to verify all measurements.
-
2023-04-07historical Active Under Contract 546-char remark
Show marketing remark (546 chars)
* * * Highest and Best offers due by Sunday 4/2 at 5:00 with response time of Monday at 8:00 pm * * * Cute Bungalow style home has been partially updated and is within walking distance to Doak Campbell. Square Footage does not seem to include the 4th bedroom. There is also a large 20x7 screened porch on the back of the house and an almost fully fenced yard. Kitchen features beautiful wood cabinets and newer appliances. Vinyl plank floors throughout. Seller has never occupied property, no disclosures. Buyer to verify all measurements.
-
2023-03-16price $149,000 546-char remark
Show marketing remark (546 chars)
* * * Highest and Best offers due by Sunday 4/2 at 5:00 with response time of Monday at 8:00 pm * * * Cute Bungalow style home has been partially updated and is within walking distance to Doak Campbell. Square Footage does not seem to include the 4th bedroom. There is also a large 20x7 screened porch on the back of the house and an almost fully fenced yard. Kitchen features beautiful wood cabinets and newer appliances. Vinyl plank floors throughout. Seller has never occupied property, no disclosures. Buyer to verify all measurements.
-
2023-02-06$160,000 Active 546-char remark
Show marketing remark (546 chars)
* * * Highest and Best offers due by Sunday 4/2 at 5:00 with response time of Monday at 8:00 pm * * * Cute Bungalow style home has been partially updated and is within walking distance to Doak Campbell. Square Footage does not seem to include the 4th bedroom. There is also a large 20x7 screened porch on the back of the house and an almost fully fenced yard. Kitchen features beautiful wood cabinets and newer appliances. Vinyl plank floors throughout. Seller has never occupied property, no disclosures. Buyer to verify all measurements.
-
2021-12-30soldstatus $4,213,479
-
2018-06-19soldstatus $3,371,988
-
2013-05-23soldstatus $112,100
-
1997-06-19soldstatus $58,000
ⓘ Source: listings_history table (triggers on properties + properties_extension) + one-shot
backfill from property_details.listing_events for pre-trigger history.
Tax reassessment forecast FL · Resets to sale price
- Current annual tax
- $2,733 · $228/mo
- Projected year-2 tax
- $2,733 · $228/mo
- Expected delta
- $0/yr ($0/mo · 0.0%)
ⓘ Screening estimate from a state-policy table — verify with the county assessor before closing.
Climate risk First Street
- Flood 1/10 Low FEMA zone X (unshaded) · 0% chance over 30 yrs
- Wildfire 1/10 Low
- Heat 8/10 Severe 7 d/yr ≥108°F today · 20 d/yr by 30 yrs out
- Wind 9/10 Extreme 99% chance of damaging wind over 30 yrs
- Air quality 4/10 Moderate 5 unhealthy d/yr today · 6 by 30 yrs out
Nearby sold comps map
Loading sold comps map…
Walkable amenities ~0.75 mi
Loading nearby amenities…
Taxation est. · year 1
- Rental income
- $18,167
- − Mortgage interest
- −$11,758
- − Property taxes
- −$2,733
- − Insurance
- −$1,050
- − Repairs & maintenance
- −$1,453
- − Management
- −$1,453
- − Depreciation
- −$6,106
- Taxable loss
- −$6,386
- Est. tax savings @ 24.0%
- +$1,533
- After-tax cash flow
- $-1,107/yr
For passive investors: Depreciation is non-cash, so a rental often shows a tax loss while cash-flowing — sheltering income. Rental losses are passive: they offset passive income freely, and up to $25,000/yr can offset ordinary (W-2) income if you actively participate and your MAGI is under $100k (phasing out to $0 by $150k); unused losses carry forward. On sale, claimed depreciation is recaptured at up to 25%, and gains may owe capital-gains tax (a 1031 exchange can defer both). Figures are a year-1 estimate at your 24.0% rate — not tax advice; consult a CPA.
Schools (NCES district)
- District
- Leon
- NCES district ID
- 1201110
- Math proficiency
- 48% ▼ -13.00%
- Reading proficiency
- 53% ▼ -5.00%
- Median HH income
- $46,339
- Composite
- 42.84/100
- National rank
- #3131
- State rank
- #33 of 73 in FL
Livability — Tallahassee
- Score
- 86/100
- State rank
- #19
- US rank
- #429
Category grades
Schools grade is shown separately in the Schools card above.
Census & demographics
- Census place
- Tallahassee, FL
- County
- Leon County · 294,472 people
- City population
- 294,472
- Metro
- Tallahassee, FL
- Population (ZIP)
- 51,673
- Household income
- $32,348
- Rent vs Own
- Severe rent burden
- 6995.0
Population outlook (Leon County) Hauer SSP2
- Today (2025)
- 315,507 people
- By 2030
- 330,677 · +4.8%
- By 2040
- 358,465 · +13.6%
- By 2050
- 386,804 · +22.6%
- By 2075
- 465,480 · +47.5%
- By 2100
- 519,959 · +64.8%
Race, ethnicity, and origin ACS 2023
- Neighborhood character
- Diverse neighborhood (Simpson 0.65)
- Race & ethnicity
- White 45% Black 36% Hispanic / Latino 10% Two or more races 7% Asian 4%
- Hispanic origin (detail)
- Mexican 2% Puerto Rican 2% Cuban 2%
- Common ancestry
- Romanian 2% Lithuanian 1% Italian 1%
- Foreign-born
- 8% · Canada, China
- Languages at home
- 86% English-only · Spanish 7% Other Indo-European 2% French/Haitian/Cajun 1%
Political lean MEDSL · Leon
- 2024 margin
- Strong D (+21.8) · D 60.3% · R 38.5% · Other 1.2%
- 2008→2024 swing
- -2.5pp toward R · 2008: 24.3pp · 2024: 21.8pp
- All cycles
- 2024: D+21.8 2020: D+28.3 2016: D+25.1 2012: D+23.6 2008: D+24.3
Not yet ingested
- Civics
- —
Market trends
- HPI YoY
- ▼ -72.04%
- Current HPI
- 267.8426
- Rent YoY
- ▲ 4.69%
- Metro
- Tallahassee, FL
- State GDP YoY
- ▲ 3.28%
- F500 in state
- 36
Industry mix (Fortune 500 HQ in FL)
| Industry | F500 HQs | Revenue |
|---|---|---|
| Industrial Technology | 2 | $29B |
|
||
| Insurance | 2 | $17B |
|
||
| Retail | 1 | $60B |
|
||
| Technology Distribution | 1 | $58B |
|
||
| Homebuilding | 1 | $35B |
|
||
| Technology Manufacturing | 1 | $35B |
|
||
Price history
+261.9% since first listed12 events — show timeline
- 2026-05-19 Listing Removed — CATRS
- 2026-05-19 Listed $209,900 CATRS
- 2026-04-21 Listed $219,900 CATRS
- 2023-05-08 Sold (Public Records) $157,000 Public Records
- 2023-05-03 Sold (MLS) $157,000 CATRS
- 2023-04-07 Contingent — CATRS
- 2023-03-16 Price Changed $149,000 CATRS
- 2023-02-06 Listed $160,000 CATRS
- 2021-12-30 Sold (Public Records) $4,213,479 Public Records
- 2018-06-19 Sold (Public Records) $3,371,988 Public Records
- 2013-05-23 Sold (Public Records) $112,100 Public Records
- 1997-06-19 Sold (Public Records) $58,000 Public Records
Property tax history
+6.4%/yrLatest (2025): $2,733 · +7.8% YoY. Source: county tax records.
Cash-flow waterfall
monthlySold comps — $/sqft
last 12 mo · ≤1 miLoading sold comps…