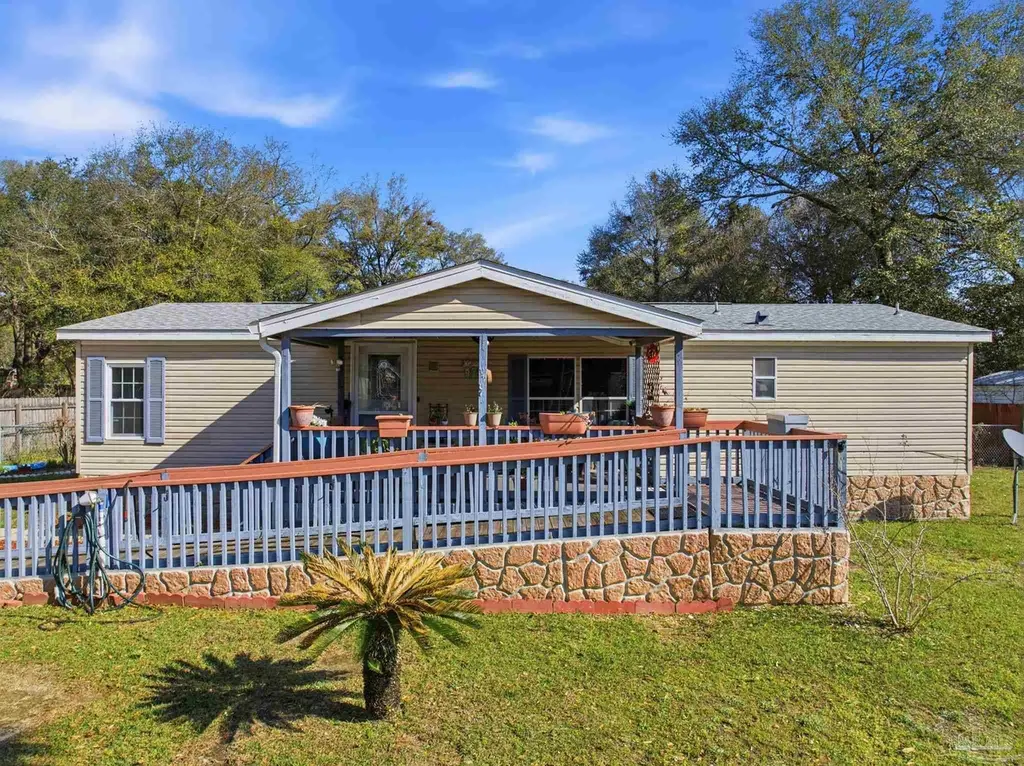
8962 Bluebell St · East Milton, FL
Flood risk 8/10 · Major
- FEMA flood zone
- X (unshaded)
- Chance of flooding over 30 yrs
- 0.99%
- Est. flood insurance / yr
- $507 – $1,088
Fire risk 3/10 · Minor
- Est. fire insurance / yr
- $947 – $1,759
Heat risk 9/10 · Severe
- Hot days now (above 105°F)
- 7 days/yr
- Hot days in 30 yrs
- 21 days/yr
Wind risk 9/10 · Severe
- Chance of severe wind over 30 yrs
- 99.0%
Air-quality risk 2/10 · Minimal
- Unhealthy air days now
- 1 days/yr
- Unhealthy air days in 30 yrs
- 1 days/yr
Risk factors via First Street. Map © Google.
Why this score? — see what drove the B grade
The composite is a weighted blend of 9 inputs, each scored 0–100. Each bar is that input's sub-score; the figure is the points it added to the 100-point composite (weight × sub-score).
- Cash flow +28.2/30.0
- ARV discount +12.1/15.0
- DSCR +10.0/10.0
- 1% rule +7.8/10.0
- Schools +5.3/10.0
- Livability +3.9/5.0
- Rent growth +3.6/5.0
- Condition / age +2.5/5.0
- Appreciation +0.0/10.0
$175,000
🖨 Deal sheet (PDF) 📄 Offer letter ✓ Due diligence
Listing remarks MLS
HUD property sold as-is. Information from sources deemed reliable but not guaranteed. Buyer to verify all information. Liens/Code violations may/may not exist. Buyer to resolve. Evidence of mold may/may not be present. No remediation has or will be done. HUD CASE - 091-352991
Key facts
- Open-concept design
- Modern appliances
- En-suite bathroom
Tags
Property features AI
Finance
- Other: Lot size approximately 0.351 acres
- HOA & community: No association
Exterior
- Parking: Driveway with open parking
- Utilities: Electric with circuit breakers and copper wiring; Septic tank sewer; Paved county-maintained road access
- Home design: Mobile/Manufactured or modular home; One-story; Resale property; Homestead-eligible
- Construction: Off-grade foundation
- Exterior features: Shingle roof; Central access to the lot; Public water
Interior
- Kitchen: Electric water heater
- Bedrooms: Master bedroom on the first floor, approximately 12 x 11; Second bedroom on the first floor, approximately 13 x 10; Third bedroom on the first floor, approximately 10 x 8
- Flooring: Vinyl; Carpet
- Bathrooms: Two full bathrooms
- Heating & cooling: Central heating; Central air conditioning
- Interior features: Vinyl and carpet flooring; Eat-in kitchen
Neighborhood map
What this means for you Summary
Snapshot
- This is a 3-bed/2.0-bath manufactured listed at $175k.
Deal economics
- At list price, monthly cash flow is $488 ($6k/yr) — positive.
- The deal already cash-flows at list — no discount required.
- Meets the 1% rule at list price ($2k rent vs $175k).
- Recommended offer: $164k (6.0% below list) — sets the bar for market timing.
- Cap rate 10.1% vs local median 4.6% in East Milton — top-decile yield for the area; either an underpriced asset or a hidden risk that comps aren't pricing in. Stress-test before assuming the spread holds.
Location & tenants
- Location reads 77/100 on livability (#199 in FL, #3,139 nationally) — a middle-class / working-renter tenant base. Strengths: cost of living A+, housing A+, health & safety A+; Watch: crime C-, amenities C-, commute F.
- Santa Rosa (suburban): math 63% / reading 60% proficiency, ranked #8 of 73 in FL (top 11%) — acceptable for families but not a draw, mixed tenant base, ~2y average lease.
- Market conditions: Rents rising fast (+4.5%/yr); 806 active listings in the ZIP; 2 comparable units currently listed for rent nearby; solid renter incomes; 1,983 units permitted in Santa Rosa County in 2024 (128 in 5+ unit buildings).
- This rent runs 31% of the median local income ($85k/yr) — at the standard rent-burdened threshold; future hikes will face affordability resistance.
Forward outlook
- Local home prices are declining (-3.0%/yr); year-one equity from $1k of loan paydown is wiped out by about $5k of value loss. Plan a longer hold.
- Santa Rosa County population projected at +31% by 2050 — long-run rental-demand tailwind backs the buy-and-hold thesis.
- At projected returns (-3.0% appreciation + 4.5% rent growth), your $49k cash investment doubles in ~9 years — after that, you're playing with house money.
Negotiation context
- It's been on market 90 days — a 6% lower offer ($164k) is reasonable based on typical stale-listing flexibility.
- 3 sale attempts since 25y ago; this cycle's ask has dropped $10k (5%) from the opening price — seller is motivated, your offer sets the floor, not the list.
- Current owner paid $32k; list at $175k implies a 438% gain — meaningful room to come down on a strong offer.
Risks & watch-outs
- Watch-outs: flood insurance adds $66/mo.
- Climate carrying-cost: severe flood risk; severe wind risk, 99% chance of damaging wind over 30y; extreme-heat days projected 7→21/yr by 2055 (HVAC capex compounding) — expect insurance premiums to compound above CPI over the hold.
Questions for the listing agent
- It's been on market 90 days. Have you received any prior offers? Is the seller open to a 6% concession, seller financing, or rate buy-down credit?
- What's the actual annual flood-insurance premium (NFIP or private), and is the property in a SFHA with mandatory coverage?
- Why hasn't it sold? Are there any deal-killer items the seller is aware of (foundation, flood, title, zoning, code violations)?
- Is there a deadline driving the sale (1031 exchange, divorce, estate, relocation)? That informs how much negotiation room exists.
- Schools are B-rated — typically a magnet for longer-tenancy family renters. What's the average tenant stay here, and is there a school-zone premium baked into asking?
- What's the average days-on-market for RENTAL listings here right now (not sales)? A rising rental-DOM trend means longer vacancies and softer asking-rent achievability than the comps imply.
- What's the recent tenant-quality profile in this submarket — average credit score on applications, eviction rate, late-payment / NSF rate, and stable-employment percentage? A property-management company in the area should have these aggregated.
- How much new for-sale + rental construction is in the pipeline within 1–3 miles? Heavy new supply typically softens prices + rents 12–24 months out; constrained supply supports both.
Investment metrics
- 1% rule
- 1.28% ✓
- Cap rate
- 10.10%
- Cash-on-cash
- 13.59%
- DSCR
- 1.60
- GRM
- 6.5
CMA / ARV
- ARV (on-the-fly)
- $195,096
- Comps found
- 1
Show comp detail 1 sale within ~0.75 mi
| Address | Dist | Beds/Ba | Sqft | Sold | Price | $/sf | Match |
|---|---|---|---|---|---|---|---|
| 8919 Tara Cir | 0.09mi | 3/2.0 | 1,512 (+2%) | 2mo | $200,000 | $132 | 90 |
Match score weights: distance 35% · size 25% · config 20% · recency 20%. Top-matched comps best support the ARV.
Projected returns pro-forma
-3.0% appreciation · 4.53% rent growth · sell at horizon
- IRR
- 3.3%
- Equity multiple
- 1.13×
- Total profit
- $6,319
- Equity at exit
- $26,093
- IRR
- 14.3%
- Equity multiple
- 2.24×
- Total profit
- $60,643
- Equity at exit
- $15,131
Cash invested: $49,000 (down + closing). Projections, not guarantees.
Landlord ↔ Tenant lean methodology
- Overall (STATE)
- 87 Strongly Landlord-Friendly
- State Florida
- 87 Strongly Landlord-Friendly · R+3
- County
- — inherits STATE
- City
- — inherits STATE
ZIP-level market 32583
- Home prices YoY
- -11.3%
- Rents YoY
- 4.5%
- Active inventory
- 806
- Price-to-rent
- 6.5×
Monthly cashflow live
- Estimated rent
- $2,233 medium interval (Pro) →
- Mortgage (P&I)
- −$918
- Tax est. 1.5%
- −$219 /mo · $2,625/yr
- Insurance
- −$73
- Flood insurance flood zone
- −$66 /mo · $798/yr
- HOA
- −$0
- Vacancy / Maint / Mgmt
- −$469
- Net cashflow
- $488
Break-even live
Sensitivity live
| Price | -10% $609 | -5% $549 | +0% $488 | +5% $428 | +10% $368 |
|---|---|---|---|---|---|
| Rent | -10% $312 | -5% $400 | +0% $488 | +5% $577 | +10% $665 |
| Rate | -1.0pp $577 | -0.5pp $533 | base $488 | +0.5pp $443 | +1.0pp $397 |
UW: 25.0% down · 7.5% · 30yr · 1.5% tax · 5.0% vac · 8.0% maint · 8.0% mgmt
Financing live
Cash to close
- Down payment
- $43,750
- Closing costs
- $5,250
- Reserves months
- —
- Total cash needed
- —
Loan-product check · same deal, 3 products live
Conventional
25% down · 7.5% · 30yr
- Down + closing
- —
- Monthly P&I
- —
- Monthly cashflow
- —
- DSCR
- —
- Eligible?
- —
Personal DTI + credit; lowest rate.
DSCR
20% down · 8.5% · 30yr
- Down + closing
- —
- Monthly P&I
- —
- Monthly cashflow
- —
- DSCR
- —
- Eligible?
- —
No personal income docs; deal must DSCR.
Hard money
10% down · 12.0% · 12mo
- Down + closing
- —
- Monthly P&I
- —
- Monthly cashflow
- —
- DSCR
- —
- Eligible?
- —
Short-term bridge; refi at stabilization.
Rent comps 2 comps
| Address | Beds | Baths | Sqft | Rent | $/sqft | DOM | Units | Dist |
|---|---|---|---|---|---|---|---|---|
| 9330 Tara Cir Milton, FL | 4.0 | 2.0 | 1786 | $2,000 | $1.12 | 14d | 1 | 0.63mi |
| 8617 Tarsus Dr Milton, FL | 4.0 | 2.0 | 1830 | $2,200 | $1.20 | 24d | 1 | 0.91mi |
Listing history 22 events
-
2026-06-18days on market $175,000 Active 90 DOM
-
2026-06-17days on market $175,000 Active 89 DOM
-
2026-06-16days on market $175,000 Active 88 DOM
-
2026-06-15days on market $175,000 Active 87 DOM
-
2026-06-14pricedays on market $175,000 Active 85 DOM
-
2026-06-10days on market $177,400 Active 82 DOM
-
2026-06-09days on market $177,400 Active 81 DOM
-
2026-06-08days on market $177,400 Active 80 DOM
-
2026-06-07days on market $177,400 Active 79 DOM
-
2026-06-05days on market $177,400 Active 76 DOM
-
2026-06-03days on market $177,400 Active 75 DOM
-
2026-06-02days on market $177,400 Active 74 DOM
-
2026-06-01days on market $177,400 Active 73 DOM
-
2026-05-31days on market $177,400 Active 72 DOM
-
2026-05-31days on market $177,400 Active 71 DOM
-
2026-05-24price $177,400
-
2026-04-20price $179,999
-
2026-03-20$184,900 Active
-
2009-03-01soldstatus $32,500 278-char remark
Show marketing remark (278 chars)
HUD property sold as-is. Information from sources deemed reliable but not guaranteed. Buyer to verify all information. Liens/Code violations may/may not exist. Buyer to resolve. Evidence of mold may/may not be present. No remediation has or will be done. HUD CASE - 091-352991
-
2009-01-23$35,150 278-char remark
Show marketing remark (278 chars)
HUD property sold as-is. Information from sources deemed reliable but not guaranteed. Buyer to verify all information. Liens/Code violations may/may not exist. Buyer to resolve. Evidence of mold may/may not be present. No remediation has or will be done. HUD CASE - 091-352991
-
2001-06-06historical
-
2001-05-10$62,400
ⓘ Source: listings_history table (triggers on properties + properties_extension) + one-shot
backfill from property_details.listing_events for pre-trigger history.
Climate risk First Street
- Flood 8/10 Severe FEMA zone X (unshaded) · 99% chance over 30 yrs
- Wildfire 3/10 Moderate
- Heat 9/10 Extreme 7 d/yr ≥105°F today · 21 d/yr by 30 yrs out
- Wind 9/10 Extreme 99% chance of damaging wind over 30 yrs
- Air quality 2/10 Low 1 unhealthy d/yr today · 1 by 30 yrs out
Nearby sold comps map
Loading sold comps map…
Walkable amenities ~0.75 mi
Loading nearby amenities…
Taxation est. · year 1
- Rental income
- $26,800
- − Mortgage interest
- −$9,803
- − Property taxes
- −$2,625
- − Insurance
- −$1,672
- − Repairs & maintenance
- −$2,144
- − Management
- −$2,144
- − Depreciation
- −$5,091
- Taxable income
- $3,321
- Est. tax owed @ 24.0%
- −$797
- After-tax cash flow
- $5,065/yr
For passive investors: Depreciation is non-cash, so a rental often shows a tax loss while cash-flowing — sheltering income. Rental losses are passive: they offset passive income freely, and up to $25,000/yr can offset ordinary (W-2) income if you actively participate and your MAGI is under $100k (phasing out to $0 by $150k); unused losses carry forward. On sale, claimed depreciation is recaptured at up to 25%, and gains may owe capital-gains tax (a 1031 exchange can defer both). Figures are a year-1 estimate at your 24.0% rate — not tax advice; consult a CPA.
Schools (NCES district)
- District
- Santa Rosa
- NCES district ID
- 1201650
- Math proficiency
- 63% ▼ -6.00%
- Reading proficiency
- 60% ▼ -5.00%
- Median HH income
- $58,161
- Composite
- 53.12/100
- National rank
- #1511
- State rank
- #8 of 73 in FL
Livability — East Milton
- Score
- 77/100
- State rank
- #199
- US rank
- #3139
Category grades
Schools grade is shown separately in the Schools card above.
Census & demographics
- Census place
- East Milton, FL
- County
- Santa Rosa County · 194,764 people
- City population
- 31,415
- Metro
- Pensacola-Ferry Pass-Brent, FL
- Population (ZIP)
- 31,828
- Household income
- $85,440
- Rent vs Own
- Severe rent burden
- 122.0
Population outlook (Santa Rosa County) Hauer SSP2
- Today (2025)
- 195,978 people
- By 2030
- 209,782 · +7.0%
- By 2040
- 235,293 · +20.1%
- By 2050
- 256,408 · +30.8%
- By 2075
- 298,074 · +52.1%
- By 2100
- 303,216 · +54.7%
Race, ethnicity, and origin ACS 2023
- Neighborhood character
- Predominantly White (74%)
- Race & ethnicity
- White 74% Black 11% Two or more races 10% Hispanic / Latino 6% Asian 1%
- Hispanic origin (detail)
- Mexican 3% Puerto Rican 2% Cuban 1%
- Common ancestry
- Italian 3% Slovak 2% Serbian 2%
- Foreign-born
- 3% · Canada
- Languages at home
- 94% English-only · Spanish 3%
Political lean MEDSL · Santa Rosa
- 2024 margin
- Solid R (+51.0) · D 24.1% · R 75.0%
- 2008→2024 swing
- -3.0pp toward R · 2008: -47.9pp · 2024: -51.0pp
- All cycles
- 2024: R+51.0 2020: R+46.5 2016: R+53.5 2012: R+52.6 2008: R+47.9
Not yet ingested
- Civics
- —
Market trends
- HPI YoY
- ▼ -38.35%
- Current HPI
- 301.8819
- Rent YoY
- ▲ 4.53%
- Metro
- Pensacola-Ferry Pass-Brent, FL
- State GDP YoY
- ▲ 3.28%
- F500 in state
- 36
Industry mix (Fortune 500 HQ in FL)
| Industry | F500 HQs | Revenue |
|---|---|---|
| Industrial Technology | 2 | $29B |
|
||
| Insurance | 2 | $17B |
|
||
| Retail | 1 | $60B |
|
||
| Technology Distribution | 1 | $58B |
|
||
| Homebuilding | 1 | $35B |
|
||
| Technology Manufacturing | 1 | $35B |
|
||
Price history
+184.3% since first listed7 events — show timeline
- 2026-05-24 Price Changed $177,400 PARMLS
- 2026-04-20 Price Changed $179,999 PARMLS
- 2026-03-20 Listed $184,900 PARMLS
- 2009-03-01 Sold (MLS) $32,500 PARMLS
- 2009-01-23 Listed $35,150 PARMLS
- 2001-06-06 Listing Removed — PARMLS
- 2001-05-10 Listed $62,400 PARMLS
Property tax history
-1.1%/yrLatest (2025): $345 · +21.7% YoY. Source: county tax records.
Cash-flow waterfall
monthlySold comps — $/sqft
last 12 mo · ≤1 miLoading sold comps…