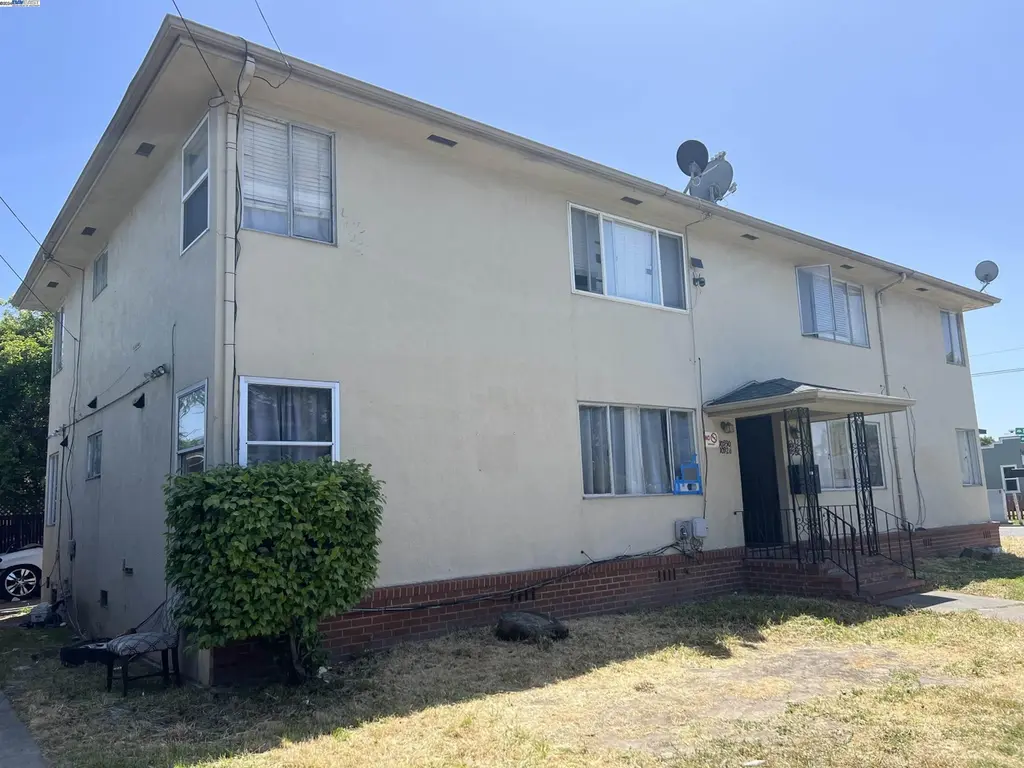
 Fourplex
10926 Bancroft Ave · Oakland, CA
Flood risk 1/10 · Minimal
- FEMA flood zone
- X (unshaded)
- Chance of flooding over 30 yrs
- 0.0%
- Est. flood insurance / yr
- $507 – $1,088
Fire risk 4/10 · Minor
- Est. fire insurance / yr
- $659 – $1,223
Heat risk 4/10 · Minor
- Hot days now (above 84°F)
- 7 days/yr
- Hot days in 30 yrs
- 15 days/yr
Wind risk 1/10 · Minimal
- Chance of severe wind over 30 yrs
- —
Air-quality risk 8/10 · Major
- Unhealthy air days now
- 14 days/yr
- Unhealthy air days in 30 yrs
- 14 days/yr
Risk factors via First Street. Map © Google.
Why this score? — see what drove the C grade
The composite is a weighted blend of 9 inputs, each scored 0–100. Each bar is that input's sub-score; the figure is the points it added to the 100-point composite (weight × sub-score).
- Cash flow +25.1/30.0
- DSCR +8.2/10.0
- ARV discount +7.5/15.0
- 1% rule +6.9/10.0
- Livability +3.6/5.0
- Schools +3.0/10.0
- Rent growth +2.9/5.0
- Condition / age +2.5/5.0
- Appreciation +0.0/10.0
$830,000
🖨 Deal sheet 📄 Offer letter ✓ Due diligence
Multi-family units
County records classify this as Multi-Family (2-4 Unit). Listing-text estimate: 4 units. confirmed
Listing remarks MLS
Location, Location, Location! Rare a four units investment property located at border of Oakland and San Leandro, Great corner location at Durant and Bancroft. 5 blocks from Dutton and Bancroft shopping. Bus station at the door. Close to freeway and BART Station, 2 bedrooms and 1 bath for all 4 units, Great opportunity!
Key facts
- Corner location
- Close to freeway
- 5,555 sq ft lot
Tags
Neighborhood map
What this means for you Summary
Snapshot
- This is a 4 × 2-bed/1.0-bath units multifamily listed at $830k.
Deal economics
- At list price, monthly cash flow is $2k ($22k/yr) — positive. Per door: $460/mo.
- The deal already cash-flows at list — no discount required.
- Meets the 1% rule at list price ($10k rent vs $830k).
- Recommended offer: $730k (12.0% below list) — sets the bar for market timing.
- Cap rate 9.0% vs local median 2.4% in Oakland — top-decile yield for the area; either an underpriced asset or a hidden risk that comps aren't pricing in. Stress-test before assuming the spread holds.
Location & tenants
- Location reads 71/100 on livability (#224 in CA) — a middle-class / working-renter tenant base. Strengths: amenities A+, commute A+, employment A+; Watch: schools C-, crime F, cost of living F.
- Oakland Unified (urban): math 27% / reading 33% proficiency, ranked #1,007 of 1,400 in CA (top 72%) — families likely to look elsewhere, expect single-tenant / working-renter base with shorter leases; 68% free/reduced lunch — lower-income household profile, screen leases tightly.
- Market conditions: Rents rising (+1.6%/yr); 98 active listings in the ZIP; solid renter incomes; 1,742 units permitted in Alameda County in 2024 (856 in 5+ unit buildings).
- At $9,891/mo this rent would consume 155% of the median local household income ($77k/yr) (locally 2061% of renters already pay >50% of income on rent) — very limited rent-growth headroom before tenants either downsize or default.
Forward outlook
- Local home prices are declining (-3.0%/yr); year-one equity from $6k of loan paydown is wiped out by about $25k of value loss. Plan a longer hold.
- Alameda County population projected at +34% by 2050 — long-run rental-demand tailwind backs the buy-and-hold thesis.
Negotiation context
- It's been on market 674 days — a 12% lower offer ($730k) is reasonable based on typical stale-listing flexibility.
- 6 sale attempts since 9y ago with the ask held roughly flat each time — persistent listings suggest the price (not the market) is what's stuck; bring a comps-based counter.
Risks & watch-outs
- Watch-outs: built in 1955 — expect roof / HVAC / electrical / plumbing capex.
Questions for the listing agent
- It's been on market 674 days. Have you received any prior offers? Is the seller open to a 12% concession, seller financing, or rate buy-down credit?
- Can we see the unit-by-unit rent roll, current vacancy, and any below-market leases? What's the average tenancy length?
- What capital expenditures (roof, boiler, parking lot, exteriors) have been made in the last 5 years, and what's planned in the next 2?
- Built in 1955 — when were the roof, HVAC, electrical panel, plumbing, and water heater last replaced?
- Why hasn't it sold? Are there any deal-killer items the seller is aware of (foundation, flood, title, zoning, code violations)?
- Is there a deadline driving the sale (1031 exchange, divorce, estate, relocation)? That informs how much negotiation room exists.
- Crime grade is F in this area — have there been break-ins, vandalism, or insurance claims at this property in the last 3 years? What carrier currently insures it and at what premium?
- What's the average days-on-market for RENTAL listings here right now (not sales)? A rising rental-DOM trend means longer vacancies and softer asking-rent achievability than the comps imply.
- What's the recent tenant-quality profile in this submarket — average credit score on applications, eviction rate, late-payment / NSF rate, and stable-employment percentage? A property-management company in the area should have these aggregated.
- How much new apartment / multifamily construction is in the pipeline within 1–3 miles? Heavy new supply (>2% of stock underway) typically softens rents 12–24 months out; light construction supports rent growth.
Investment metrics
- 1% rule
- 1.19% ✓
- Cap rate
- 8.95%
- Cash-on-cash
- 9.50%
- DSCR
- 1.42
- GRM
- 7.0
CMA / ARV
- ARV (median comp)
- $1,762,233
- List price
- $830,000
- Delta
- -52.90%
- Verdict
- UNDERPRICED
- Comps
- 6 within 1.0 mi
Show comp detail 1 sale within ~0.75 mi
| Address | Dist | Beds/Ba | Sqft | Sold | Price | $/sf | Match |
|---|---|---|---|---|---|---|---|
| 2509 109th Ave | 0.24mi | 8/4.0 | 3,432 (-1%) | 23mo | $910,000 | $265 | 68 |
Match score weights: distance 35% · size 25% · config 20% · recency 20%. Top-matched comps best support the ARV.
Projected returns pro-forma
-3.0% appreciation · 1.58% rent growth · sell at horizon
- IRR
- -3.6%
- Equity multiple
- 0.87×
- Total profit
- $-30,934
- Equity at exit
- $123,756
- IRR
- 4.4%
- Equity multiple
- 1.30×
- Total profit
- $69,607
- Equity at exit
- $71,763
Cash invested: $232,400 (down + closing). Projections, not guarantees.
Landlord ↔ Tenant lean methodology
- Overall (CITY)
- 0 Strongly Tenant-Friendly
- State California
- 18 Strongly Tenant-Friendly · D+13
- County
- — inherits STATE
- City Oakland
- 0 Strongly Tenant-Friendly · D+62
ZIP-level market 94603
- Rents YoY
- 1.6%
- Active inventory
- 98
- Price-to-rent
- 28.0×
Monthly cashflow live
- Estimated rent
- $9,891 high interval (Pro) →
- Mortgage (P&I)
- −$4,353
- Tax from tax record
- −$1,275 /mo · $15,303/yr
- Insurance
- −$346
- HOA
- −$0
- Vacancy / Maint / Mgmt
- −$2,077
- Net cashflow
- $1,840
Break-even live
4-unit breakdown (identical units grouped — click to expand)
| Units | Beds | Baths | Est. rent |
|---|---|---|---|
| 4× units | 2 | 1 | $9,892 |
| #1 | 2 | 1 | $2,473 |
| #2 | 2 | 1 | $2,473 |
| #3 | 2 | 1 | $2,473 |
| #4 | 2 | 1 | $2,473 |
| Total (4 units) | $9,891 | ||
UW: 25.0% down · 7.5% · 30yr · 1.5% tax · 5.0% vac · 8.0% maint · 8.0% mgmt
Financing live
Cash to close
- Down payment
- $207,500
- Closing costs
- $24,900
- Reserves months
- —
- Total cash needed
- —
Loan-product check · same deal, 3 products live
Conventional
25% down · 7.5% · 30yr
- Down + closing
- —
- Monthly P&I
- —
- Monthly cashflow
- —
- DSCR
- —
- Eligible?
- —
Personal DTI + credit; lowest rate.
DSCR
20% down · 8.5% · 30yr
- Down + closing
- —
- Monthly P&I
- —
- Monthly cashflow
- —
- DSCR
- —
- Eligible?
- —
No personal income docs; deal must DSCR.
Hard money
10% down · 12.0% · 12mo
- Down + closing
- —
- Monthly P&I
- —
- Monthly cashflow
- —
- DSCR
- —
- Eligible?
- —
Short-term bridge; refi at stabilization.
Listing history 29 events
-
2026-06-18days on market $830,000 Active 674 DOM
-
2026-06-17days on market $830,000 Active 673 DOM
-
2026-06-16days on market $830,000 Active 672 DOM
-
2026-06-15days on market $830,000 Active 671 DOM
-
2026-06-13days on market $830,000 Active 669 DOM
-
2026-06-13days on market $830,000 Active 668 DOM
-
2026-06-09days on market $830,000 Active 665 DOM
-
2026-06-08days on market $830,000 Active 664 DOM
-
2026-06-07days on market $830,000 Active 663 DOM
-
2026-06-04days on market $830,000 Active 660 DOM
-
2026-06-03days on market $830,000 Active 659 DOM
-
2026-06-02days on market $830,000 Active 658 DOM
-
2026-06-01days on market $830,000 Active 657 DOM
-
2026-05-31days on market $830,000 Active 656 DOM
-
2025-02-25status Active 321-char remark
Show marketing remark (321 chars)
Location, Location, Location! Rare a four units investment property located at border of Oakland and San Leandro, Great corner location at Durant and Bancroft. 5 blocks from Dutton and Bancroft shopping. Bus station at the door. Close to freeway and BART Station, 2 bedrooms and 1 bath for all 4 units, Great opportunity!
-
2025-01-23status Pending 321-char remark
Show marketing remark (321 chars)
Location, Location, Location! Rare a four units investment property located at border of Oakland and San Leandro, Great corner location at Durant and Bancroft. 5 blocks from Dutton and Bancroft shopping. Bus station at the door. Close to freeway and BART Station, 2 bedrooms and 1 bath for all 4 units, Great opportunity!
-
2024-07-11historical
Show marketing remark (321 chars)
Location, Location, Location! Rare a four units investment property located at border of Oakland and San Leandro, Great corner location at Durant and Bancroft. 5 blocks from Dutton and Bancroft shopping. Bus station at the door. Close to freeway and BART Station, 2 bedrooms and 1 bath for all 4 units, Great opportunity!
-
2024-07-11$830,000 Active 321-char remark
Show marketing remark (321 chars)
Location, Location, Location! Rare a four units investment property located at border of Oakland and San Leandro, Great corner location at Durant and Bancroft. 5 blocks from Dutton and Bancroft shopping. Bus station at the door. Close to freeway and BART Station, 2 bedrooms and 1 bath for all 4 units, Great opportunity!
-
2024-05-08Active
-
2022-11-01price $890,000
-
2022-11-01$950,000 Active
-
2022-06-17price $950,000
-
2022-04-14price $999,000
-
2022-04-08price $1,099,000
-
2022-03-20$1,100,000 Active
-
2017-06-28soldstatus $750,000 Sold
-
2017-06-28soldstatus $750,000
-
2017-05-15status Pending
-
2017-05-08$750,000 New
ⓘ Source: listings_history table (triggers on properties + properties_extension) + one-shot
backfill from property_details.listing_events for pre-trigger history.
Tax reassessment forecast CA · Resets to sale price
- Current annual tax
- $15,303 · $1,275/mo
- Projected year-2 tax
- $15,303 · $1,275/mo
- Expected delta
- $0/yr ($0/mo · 0.0%)
ⓘ Screening estimate from a state-policy table — verify with the county assessor before closing.
Climate risk First Street
- Flood 1/10 Low FEMA zone X (unshaded) · 0% chance over 30 yrs
- Wildfire 4/10 Moderate
- Heat 4/10 Moderate 7 d/yr ≥84°F today · 15 d/yr by 30 yrs out
- Wind 1/10 Low
- Air quality 8/10 Severe 14 unhealthy d/yr today · 14 by 30 yrs out
Nearby sold comps map
Loading sold comps map…
Walkable amenities ~0.75 mi
Loading nearby amenities…
Taxation est. · year 1
- Rental income
- $118,692
- − Mortgage interest
- −$46,493
- − Property taxes
- −$15,303
- − Insurance
- −$4,150
- − Repairs & maintenance
- −$9,495
- − Management
- −$9,495
- − Depreciation
- −$24,145
- Taxable income
- $9,610
- Est. tax owed @ 24.0%
- −$2,306
- After-tax cash flow
- $19,776/yr
For passive investors: Depreciation is non-cash, so a rental often shows a tax loss while cash-flowing — sheltering income. Rental losses are passive: they offset passive income freely, and up to $25,000/yr can offset ordinary (W-2) income if you actively participate and your MAGI is under $100k (phasing out to $0 by $150k); unused losses carry forward. On sale, claimed depreciation is recaptured at up to 25%, and gains may owe capital-gains tax (a 1031 exchange can defer both). Figures are a year-1 estimate at your 24.0% rate — not tax advice; consult a CPA.
Schools (NCES district)
- District
- Oakland Unified
- NCES district ID
- 0628050
- Math proficiency
- 27% ▬ 0.00%
- Reading proficiency
- 33% ▬ 0.00%
- Median HH income
- $55,194
- Composite
- 29.52/100
- National rank
- #11769
- State rank
- #1007 of 1400 in CA
Livability — Oakland
- Score
- 71/100
- State rank
- #224
- US rank
- #7245
Category grades
Schools grade is shown separately in the Schools card above.
Census & demographics
- Census place
- Oakland, CA
- County
- Alameda County · 1,614,355 people
- City population
- 385,993
- Metro
- San Francisco-Oakland-Berkeley, CA
- Population (ZIP)
- 35,742
- Household income
- $76,723
- Rent vs Own
- Severe rent burden
- 2061.0
Population outlook (Alameda County) Hauer SSP2
- Today (2025)
- 1,928,884 people
- By 2030
- 2,069,146 · +7.3%
- By 2040
- 2,338,405 · +21.2%
- By 2050
- 2,586,608 · +34.1%
- By 2075
- 3,061,911 · +58.7%
- By 2100
- 3,234,133 · +67.7%
Race, ethnicity, and origin ACS 2023
- Neighborhood character
- Majority Hispanic (63%)
- Race & ethnicity
- Hispanic / Latino 63% Black 25% Two or more races 11% Asian 5% White 4% Native American 1% Pacific Islander 1%
- Hispanic origin (detail)
- Mexican 51%
- Foreign-born
- 37% · Canada, China, Vietnam
- Languages at home
- 37% English-only · Spanish 56% Other Asian/Pacific 2% Chinese 1%
Political lean MEDSL · Alameda
- 2024 margin
- Solid D (+53.6) · D 74.6% · R 21.0% · Other 4.4%
- 2008→2024 swing
- -5.9pp toward R · 2008: 59.5pp · 2024: 53.6pp
- All cycles
- 2024: D+53.6 2020: D+62.5 2016: D+64.4 2012: D+59.8 2008: D+59.5
Not yet ingested
- Civics
- —
Market trends
- HPI YoY
- ▼ -665.46%
- Current HPI
- 396.0247
- Rent YoY
- ▲ 1.58%
- Metro
- San Francisco-Oakland-Berkeley, CA
- State GDP YoY
- ▲ 3.21%
- F500 in state
- 116
Industry mix (Fortune 500 HQ in CA)
| Industry | F500 HQs | Revenue |
|---|---|---|
| Technology | 27 | $1,492B |
|
||
| Financial Services | 3 | $174B |
|
||
| Retail | 3 | $44B |
|
||
| Insurance | 3 | $26B |
|
||
| Media / Entertainment | 2 | $115B |
|
||
| Pharmaceuticals / Biotech | 2 | $62B |
|
||
Price history
+10.7% since first listed15 events — show timeline
- 2025-02-25 Relisted — bridgeMLS, Bay East AOR, or Contra Costa AOR
- 2025-01-23 Pending — bridgeMLS, Bay East AOR, or Contra Costa AOR
- 2024-07-11 Listing Removed — bridgeMLS, Bay East AOR, or Contra Costa AOR
- 2024-07-11 Listed $830,000 bridgeMLS, Bay East AOR, or Contra Costa AOR
- 2024-05-08 Listed — bridgeMLS, Bay East AOR, or Contra Costa AOR
- 2022-11-01 Price Changed $890,000 San Francisco MLS
- 2022-11-01 Listed $950,000 San Francisco MLS
- 2022-06-17 Price Changed $950,000 San Francisco MLS
- 2022-04-14 Price Changed $999,000 San Francisco MLS
- 2022-04-08 Price Changed $1,099,000 San Francisco MLS
- 2022-03-20 Listed $1,100,000 San Francisco MLS
- 2017-06-28 Sold (Public Records) $750,000 Public Records
- 2017-06-28 Sold (MLS) $750,000 bridgeMLS, Bay East AOR, or Contra Costa AOR
- 2017-05-15 Pending — bridgeMLS, Bay East AOR, or Contra Costa AOR
- 2017-05-08 Listed $750,000 bridgeMLS, Bay East AOR, or Contra Costa AOR
Property tax history
+10.8%/yrLatest (2025): $15,303 · +4.3% YoY. Source: county tax records.
Cash-flow waterfall
monthlySold comps — $/sqft
last 12 mo · ≤1 miLoading sold comps…