 Fourplex
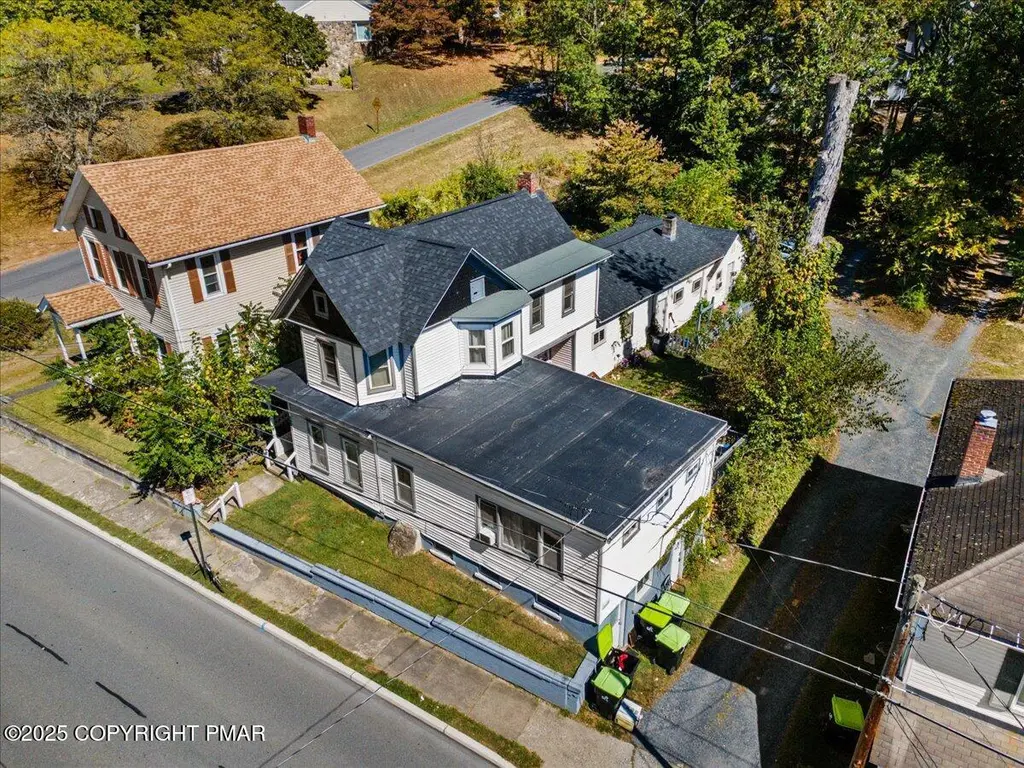
412 N 8th St · Stroudsburg, PA
Flood risk 1/10 · Minimal
- FEMA flood zone
- X (unshaded)
- Chance of flooding over 30 yrs
- 0.0%
- Est. flood insurance / yr
- $507 – $1,088
Fire risk 1/10 · Minimal
- Est. fire insurance / yr
- $511 – $949
Heat risk 4/10 · Minor
- Hot days now (above 99°F)
- 7 days/yr
- Hot days in 30 yrs
- 15 days/yr
Wind risk 4/10 · Minor
- Chance of severe wind over 30 yrs
- 11.0%
Air-quality risk 2/10 · Minimal
- Unhealthy air days now
- 1 days/yr
- Unhealthy air days in 30 yrs
- 2 days/yr
Risk factors via First Street. Map © Google.
Why this score? — see what drove the C grade
The composite is a weighted blend of 9 inputs, each scored 0–100. Each bar is that input's sub-score; the figure is the points it added to the 100-point composite (weight × sub-score).
- Cash flow +26.7/30.0
- DSCR +9.2/10.0
- 1% rule +7.2/10.0
- Livability +4.0/5.0
- Condition / age +4.0/5.0
- Schools +3.6/10.0
- Rent growth +2.5/5.0
- ARV discount +0.0/15.0
- Appreciation +0.0/10.0
$595,000
🖨 Deal sheet 📄 Offer letter ✓ Due diligence
Multi-family units
County records classify this as Multi-Family (2-4 Unit). Listing-text estimate: 4 units. confirmed
Listing remarks
Renovated 4 unit investment in the heart of Stroudsburg. 9%+ cap rate. Very low expenses. All utilities billed back to tenants. Landlord is only responsible for landscaping, snow, taxes and insurance. Three 2-bedrooms and one studio. ALL units are fully in renovated in 2023. New roof 2023. House hacker opportunity, live in one and rent the others. Walking distance to courthouse circle and Main Street Stroudsburg.
Key facts
- Fully renovated
- Renovated investment
- New roof
Tags
Property features AI
Finance
- Financial info: Annual tax: $7,692.54
Exterior
- Parking: Open parking with 4 spaces
- Utilities: Public water; Public sewer
- Home design: Multi-family residential property
- Exterior features: 0.18-acre lot; Zoned for multi-family
Interior
- Interior features: Residential income property (multi-family)
Neighborhood map
What this means for you Summary
Snapshot
- This is a 3×2bd/1ba + 1×1bd/1ba units multifamily listed at $595k. Condition is rated good.
Deal economics
- At list price, monthly cash flow is $2k ($19k/yr) — positive. Per door: $403/mo.
- The deal already cash-flows at list — no discount required.
- Meets the 1% rule at list price ($7k rent vs $595k).
- Recommended offer: $586k (1.5% below list) — sets the bar for market timing.
Location & tenants
- Location reads 80/100 on livability (#196 in PA, #1,702 nationally) — a professional / high-income tenant draw. Strengths: amenities A+, cost of living A+, health & safety A+; Watch: employment D+.
- Stroudsburg Area SD (suburban): math 33% / reading 49% proficiency, ranked #315 of 539 in PA (top 58%) — families likely to look elsewhere, expect single-tenant / working-renter base with shorter leases.
- Market conditions: 189 active listings in the ZIP; 278 units permitted in Monroe County in 2024 (52 in 5+ unit buildings).
- At $7,244/mo this rent would consume 122% of the median local household income ($71k/yr) (locally 1020% of renters already pay >50% of income on rent) — very limited rent-growth headroom before tenants either downsize or default.
Forward outlook
- Local home prices are declining (-3.0%/yr); year-one equity from $4k of loan paydown is wiped out by about $18k of value loss. Plan a longer hold.
- Monroe County population projected at -11% by 2050 — secular population decline; favor cash flow + early exit over multi-decade hold.
- At projected returns (-3.0% appreciation + 3.0% rent growth), your $167k cash investment doubles in ~10 years — after that, you're playing with house money.
Negotiation context
- It's been on market 24 days — a 2% lower offer ($586k) is reasonable based on typical stale-listing flexibility.
- 7 sale attempts with the ask held roughly flat each time — persistent listings suggest the price (not the market) is what's stuck; bring a comps-based counter.
Risks & watch-outs
- Watch-outs: built in 1920 — expect roof / HVAC / electrical / plumbing capex.
Questions for the listing agent
- Can we see the unit-by-unit rent roll, current vacancy, and any below-market leases? What's the average tenancy length?
- What capital expenditures (roof, boiler, parking lot, exteriors) have been made in the last 5 years, and what's planned in the next 2?
- Built in 1920 — when were the roof, HVAC, electrical panel, plumbing, and water heater last replaced?
- Is there a deadline driving the sale (1031 exchange, divorce, estate, relocation)? That informs how much negotiation room exists.
- What's the average days-on-market for RENTAL listings here right now (not sales)? A rising rental-DOM trend means longer vacancies and softer asking-rent achievability than the comps imply.
- What's the recent tenant-quality profile in this submarket — average credit score on applications, eviction rate, late-payment / NSF rate, and stable-employment percentage? A property-management company in the area should have these aggregated.
- How much new apartment / multifamily construction is in the pipeline within 1–3 miles? Heavy new supply (>2% of stock underway) typically softens rents 12–24 months out; light construction supports rent growth.
Investment metrics
- 1% rule
- 1.22% ✓
- Cap rate
- 9.54%
- Cash-on-cash
- 11.60%
- DSCR
- 1.52
- GRM
- 6.8
CMA / ARV
- ARV (median comp)
- $409,460
- List price
- $595,000
- Delta
- 45.31%
- Verdict
- OVERPRICED
- Comps
- 7 within 2.0 mi
Projected returns pro-forma
-3.0% appreciation · 3.0% rent growth · sell at horizon
- IRR
- 1.0%
- Equity multiple
- 1.04×
- Total profit
- $6,290
- Equity at exit
- $88,716
- IRR
- 10.6%
- Equity multiple
- 1.83×
- Total profit
- $138,029
- Equity at exit
- $51,445
Cash invested: $166,600 (down + closing). Projections, not guarantees.
Landlord ↔ Tenant lean methodology
- Overall (STATE)
- 62 Landlord-Friendly
- State Pennsylvania
- 62 Landlord-Friendly · EVEN
- County
- — inherits STATE
- City
- — inherits STATE
ZIP-level market 18360
- Active inventory
- 189
- Price-to-rent
- 25.9×
Monthly cashflow live
- Estimated rent
- $7,244 high interval (Pro) →
- Mortgage (P&I)
- −$3,120
- Tax est. 1.5%
- −$744 /mo · $8,925/yr
- Insurance
- −$248
- HOA
- −$0
- Vacancy / Maint / Mgmt
- −$1,521
- Net cashflow
- $1,611
Break-even live
4-unit breakdown (identical units grouped — click to expand)
| Units | Beds | Baths | Est. rent |
|---|---|---|---|
| 3× units | 2 | 1 | $5,739 |
| #1 | 2 | 1 | $1,913 |
| #2 | 2 | 1 | $1,913 |
| #3 | 2 | 1 | $1,913 |
| 1× unit | 1 | 1 | $1,505 |
| Total (4 units) | $7,244 | ||
UW: 25.0% down · 7.5% · 30yr · 1.5% tax · 5.0% vac · 8.0% maint · 8.0% mgmt
Financing live
Cash to close
- Down payment
- $148,750
- Closing costs
- $17,850
- Reserves months
- —
- Total cash needed
- —
Loan-product check · same deal, 3 products live
Conventional
25% down · 7.5% · 30yr
- Down + closing
- —
- Monthly P&I
- —
- Monthly cashflow
- —
- DSCR
- —
- Eligible?
- —
Personal DTI + credit; lowest rate.
DSCR
20% down · 8.5% · 30yr
- Down + closing
- —
- Monthly P&I
- —
- Monthly cashflow
- —
- DSCR
- —
- Eligible?
- —
No personal income docs; deal must DSCR.
Hard money
10% down · 12.0% · 12mo
- Down + closing
- —
- Monthly P&I
- —
- Monthly cashflow
- —
- DSCR
- —
- Eligible?
- —
Short-term bridge; refi at stabilization.
Listing history 22 events
-
2026-06-07statusdays on market $595,000 Pending 24 DOM
-
2026-06-05days on market $595,000 Active 22 DOM
-
2026-06-03days on market $595,000 Active 21 DOM
-
2026-06-02days on market $595,000 Active 20 DOM
-
2026-06-01days on market $595,000 Active 19 DOM
-
2026-05-31days on market $595,000 Active 18 DOM
-
2026-05-30days on market $595,000 Active 17 DOM
-
2026-05-07$595,000 Active 416-char remark
-
2026-01-28historical
-
2026-01-07status Active
-
2025-12-19status Active
-
2025-12-17historical
-
2025-12-04price $565,000
-
2025-10-29status Active
-
2025-10-29price $575,000
-
2025-10-25status Active
-
2025-10-25price $575,000
-
2025-10-09status Pending
-
2025-10-07status Pending
-
2025-10-07price $595,000
-
2025-09-17$595,000 Active
-
2025-09-17$595,000 Active
ⓘ Source: listings_history table (triggers on properties + properties_extension) + one-shot
backfill from property_details.listing_events for pre-trigger history.
Climate risk First Street
- Flood 1/10 Low FEMA zone X (unshaded) · 0% chance over 30 yrs
- Wildfire 1/10 Low
- Heat 4/10 Moderate 7 d/yr ≥99°F today · 15 d/yr by 30 yrs out
- Wind 4/10 Moderate 11% chance of damaging wind over 30 yrs
- Air quality 2/10 Low 1 unhealthy d/yr today · 2 by 30 yrs out
Nearby sold comps map
Loading sold comps map…
Walkable amenities ~0.75 mi
Loading nearby amenities…
Taxation est. · year 1
- Rental income
- $86,928
- − Mortgage interest
- −$33,329
- − Property taxes
- −$8,925
- − Insurance
- −$2,975
- − Repairs & maintenance
- −$6,954
- − Management
- −$6,954
- − Depreciation
- −$17,309
- Taxable income
- $10,481
- Est. tax owed @ 24.0%
- −$2,515
- After-tax cash flow
- $16,815/yr
For passive investors: Depreciation is non-cash, so a rental often shows a tax loss while cash-flowing — sheltering income. Rental losses are passive: they offset passive income freely, and up to $25,000/yr can offset ordinary (W-2) income if you actively participate and your MAGI is under $100k (phasing out to $0 by $150k); unused losses carry forward. On sale, claimed depreciation is recaptured at up to 25%, and gains may owe capital-gains tax (a 1031 exchange can defer both). Figures are a year-1 estimate at your 24.0% rate — not tax advice; consult a CPA.
Condition & rehab AI · 6 photos
This 4-unit multi-family property is in excellent condition with a recent roof replacement and all units fully renovated in 2023. It offers a great investment opportunity with a 9%+ cap rate and low expenses.
Value-add opportunities
- Both Painting exterior — Enhances curb appeal and resale value
- Both Landscaping — Improves curb appeal and rental value
- Both Interior updates — Enhances interior aesthetics and rental value
Renovation cost estimate screening
Value-add ROI direction
- Both Painting exterior — Enhances curb appeal and resale value ↑
- Both Landscaping — Improves curb appeal and rental value ↑
- Both Interior updates — Enhances interior aesthetics and rental value ↑
ⓘ Cost ranges are severity-bucket heuristics (US national rule-of-thumb). Get contractor quotes + a written scope before underwriting a rehab budget.
Schools (NCES district)
- District
- Stroudsburg Area SD
- NCES district ID
- 4222860
- Math proficiency
- 33% ▼ -10.00%
- Reading proficiency
- 49% ▼ -15.00%
- Median HH income
- $59,061
- Composite
- 36.13/100
- National rank
- #4747
- State rank
- #315 of 539 in PA
Livability — Stroudsburg
- Score
- 80/100
- State rank
- #196
- US rank
- #1702
Category grades
Schools grade is shown separately in the Schools card above.
Census & demographics
- Census place
- Stroudsburg, PA
- County
- Monroe County · 59,057 people
- City population
- 30,080
- Metro
- East Stroudsburg, PA
- Population (ZIP)
- 30,080
- Household income
- $71,481
- Rent vs Own
- Severe rent burden
- 1020.0
Population outlook (Monroe County) Hauer SSP2
- Today (2025)
- 164,099 people
- By 2030
- 161,412 · -1.6%
- By 2040
- 154,616 · -5.8%
- By 2050
- 146,710 · -10.6%
- By 2075
- 140,830 · -14.2%
- By 2100
- 138,472 · -15.6%
Race, ethnicity, and origin ACS 2023
- Neighborhood character
- Predominantly White (68%)
- Race & ethnicity
- White 68% Hispanic / Latino 17% Two or more races 8% Black 8% Asian 2%
- Hispanic origin (detail)
- Puerto Rican 10% Dominican 1%
- Common ancestry
- Romanian 6% Polish 2% Lithuanian 2%
- Foreign-born
- 11% · Canada, South Korea, China
- Languages at home
- 85% English-only · Spanish 8% Russian/Polish/Slavic 2% Other Indo-European 2%
Political lean MEDSL · Monroe
- 2024 margin
- Toss-up / Even · D 49.1% · R 49.9%
- 2008→2024 swing
- -17.1pp toward R · 2008: 16.3pp · 2024: -0.8pp
- All cycles
- 2024: R+0.8 2020: D+6.4 2016: D+0.3 2012: D+14.0 2008: D+16.3
Not yet ingested
- Civics
- —
Market trends
- HPI YoY
- ▼ -124.01%
- Current HPI
- 152.4388
- Rent YoY
- —
- Metro
- East Stroudsburg, PA
- State GDP YoY
- ▲ 1.68%
- F500 in state
- 34
Industry mix (Fortune 500 HQ in PA)
| Industry | F500 HQs | Revenue |
|---|---|---|
| Healthcare | 2 | $309B |
|
||
| Insurance | 2 | $27B |
|
||
| Telecommunications / Media | 1 | $124B |
|
||
| Industrial Distribution | 1 | $22B |
|
||
| Financial Services | 1 | $20B |
|
||
| Chemicals / Materials | 1 | $18B |
|
||
Price history
+0.0% since first listed16 events — show timeline
- 2026-06-06 Pending — PMAR
- 2026-05-07 Listed $595,000 PMAR
- 2026-01-28 Listing Removed — GLVRMLS
- 2026-01-07 Relisted — GLVRMLS
- 2025-12-19 Relisted — PMAR
- 2025-12-17 Listing Removed — GLVRMLS
- 2025-12-04 Price Changed $565,000 PMAR
- 2025-10-29 Relisted — GLVRMLS
- 2025-10-29 Price Changed $575,000 GLVRMLS
- 2025-10-25 Relisted — PMAR
- 2025-10-25 Price Changed $575,000 PMAR
- 2025-10-09 Pending — GLVRMLS
- 2025-10-07 Pending — PMAR
- 2025-10-07 Price Changed $595,000 PMAR
- 2025-09-17 Listed $595,000 PMAR
- 2025-09-17 Listed $595,000 GLVRMLS
Cash-flow waterfall
monthlySold comps — $/sqft
last 12 mo · ≤1 miLoading sold comps…