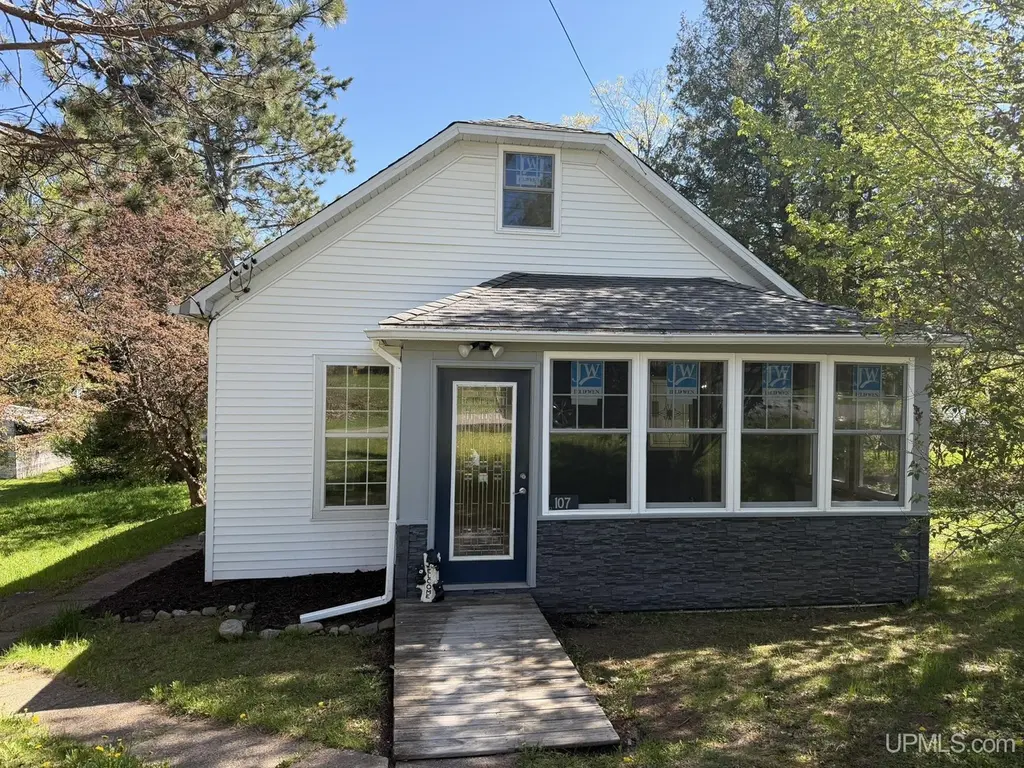
107 Fourth St · Mastodon, MI
Flood risk No data
- FEMA flood zone
- —
- Chance of flooding over 30 yrs
- —
- Est. flood insurance / yr
- —
Fire risk No data
- Est. fire insurance / yr
- —
Heat risk No data
- Hot days now (above threshold)
- —
- Hot days in 30 yrs
- —
Wind risk No data
- Chance of severe wind over 30 yrs
- —
Air-quality risk No data
- Unhealthy air days now
- —
- Unhealthy air days in 30 yrs
- —
Risk factors via First Street. Map © Google.
Why this score? — see what drove the C grade
The composite is a weighted blend of 9 inputs, each scored 0–100. Each bar is that input's sub-score; the figure is the points it added to the 100-point composite (weight × sub-score).
- Cash flow +29.0/30.0
- DSCR +10.0/10.0
- 1% rule +7.1/10.0
- Schools +2.8/10.0
- Rent growth +2.5/5.0
- Livability +2.5/5.0
- Condition / age +2.5/5.0
- ARV discount +0.0/15.0
- Appreciation +0.0/10.0
$82,500
🖨 Deal sheet (PDF) 📄 Offer letter ✓ Due diligence
Listing remarks MLS
Opportunity is knocking! ??? Located in a great area, this charming home is ready for your personal touch. With the remodel already underway, now is the perfect time to step in and make it your own. Choose the flooring, pick your favorite paint colors, and add the finishing touches that bring your vision to life. Whether you're creating your dream home or looking for your next investment opportunity, this property offers a blank canvas with endless potential. Don't miss your chance to finish the story and make this home exactly what you've always wanted!
Key facts
- Remodel underway
- Blank canvas
- Endless potential
Tags
Property features AI
Finance
- Other: Property type: Residential; Lot features: Approximately 0.3 acre (frontage approx. 97'); Lot serviced by paved, year-round city/county roads
- Financial info: No investor or income/expense details provided
- HOA & community: No HOA information provided
Exterior
- Parking: No parking information provided
- Security: No security features listed
- Utilities: Electricity connected; Natural gas heating and gas water heater; Public water; Septic system
- Home design: Residential, single-story home; Built in 1900; Below-grade area fully finished
- Construction: Block basement; Vinyl siding exterior; Year built 1900
- Exterior features: Vinyl siding; Sidewalks; Rural view; Road frontage; Located within city limits and in a rural setting
Interior
- Kitchen: Main-level kitchen (approx. 11 x 16)
- Bedrooms: Two main-level bedrooms (approx. 14 x 9 and 10 x 13)
- Flooring: No flooring information provided
- Bathrooms: Main floor full bathroom
- Heating & cooling: Floor furnace heating; No cooling system listed; Gas water heater
- Interior features: No notable interior features listed; Basement present (block foundation)
- Laundry & utility: No specific laundry appliances listed
Neighborhood map
What this means for you Summary
Snapshot
- This is a 3-bed/1.0-bath single-family listed at $82k.
Deal economics
- At list price, monthly cash flow is $282 ($3k/yr) — positive.
- The deal already cash-flows at list — no discount required.
- Meets the 1% rule at list price ($995 rent vs $82k).
- Recommended offer: $81k (1.5% below list) — sets the bar for market timing.
Location & tenants
- Location reads: area grade C — affects rentability + tenant quality, not the cash-flow math above.
- Forest Park School District (rural): math 27% / reading 39% proficiency, ranked #331 of 540 in MI (top 61%) — families likely to look elsewhere, expect single-tenant / working-renter base with shorter leases.
- Market conditions: 133 active listings in the ZIP; 156 units permitted in Iron County in 2024 (0 in 5+ unit buildings).
Forward outlook
- Local home prices are declining (-3.0%/yr); year-one equity from $570 of loan paydown is wiped out by about $2k of value loss. Plan a longer hold.
- Iron County population projected at -26% by 2050 — secular population decline; favor cash flow + early exit over multi-decade hold.
- At projected returns (-3.0% appreciation + 3.0% rent growth), your $23k cash investment doubles in ~9 years — after that, you're playing with house money.
Negotiation context
- It's been on market 19 days — a 2% lower offer ($81k) is reasonable based on typical stale-listing flexibility.
- 2 sale attempts with the ask held roughly flat each time — persistent listings suggest the price (not the market) is what's stuck; bring a comps-based counter.
- Current owner paid $30k; list at $82k implies a 175% gain — meaningful room to come down on a strong offer.
Risks & watch-outs
- Watch-outs: built in 1900 — expect roof / HVAC / electrical / plumbing capex.
Questions for the listing agent
- Built in 1900 — when were the roof, HVAC, electrical panel, plumbing, and water heater last replaced?
- Is there a deadline driving the sale (1031 exchange, divorce, estate, relocation)? That informs how much negotiation room exists.
- What's the average days-on-market for RENTAL listings here right now (not sales)? A rising rental-DOM trend means longer vacancies and softer asking-rent achievability than the comps imply.
- What's the recent tenant-quality profile in this submarket — average credit score on applications, eviction rate, late-payment / NSF rate, and stable-employment percentage? A property-management company in the area should have these aggregated.
- How much new for-sale + rental construction is in the pipeline within 1–3 miles? Heavy new supply typically softens prices + rents 12–24 months out; constrained supply supports both.
Investment metrics
- 1% rule
- 1.21% ✓
- Cap rate
- 10.39%
- Cash-on-cash
- 14.65%
- DSCR
- 1.65
- GRM
- 6.9
CMA / ARV
- ARV (on-the-fly)
- $66,240
- Comps found
- 1
Show comp detail 1 sale within ~0.75 mi
| Address | Dist | Beds/Ba | Sqft | Sold | Price | $/sf | Match |
|---|---|---|---|---|---|---|---|
| 606 2nd St | 0.43mi | 2/1.0 (-1) | 936 (-2%) | 12mo | $65,000 | $69 | 61 |
Match score weights: distance 35% · size 25% · config 20% · recency 20%. Top-matched comps best support the ARV.
Projected returns pro-forma
-3.0% appreciation · 3.0% rent growth · sell at horizon
- IRR
- 5.1%
- Equity multiple
- 1.20×
- Total profit
- $4,563
- Equity at exit
- $12,301
- IRR
- 14.5%
- Equity multiple
- 2.17×
- Total profit
- $26,992
- Equity at exit
- $7,133
Cash invested: $23,100 (down + closing). Projections, not guarantees.
Landlord ↔ Tenant lean methodology
- Overall (STATE)
- 62 Landlord-Friendly
- State Michigan
- 62 Landlord-Friendly · EVEN
- County
- — inherits STATE
- City
- — inherits STATE
ZIP-level market 49935
- Home prices YoY
- -28.7%
- Active inventory
- 133
- Price-to-rent
- 6.9×
Monthly cashflow live
- Estimated rent
- $995 medium interval (Pro) →
- Mortgage (P&I)
- −$433
- Tax from tax record
- −$37 /mo · $445/yr
- Insurance
- −$34
- HOA
- −$0
- Vacancy / Maint / Mgmt
- −$209
- Net cashflow
- $282
Break-even live
Sensitivity live
| Price | -10% $329 | -5% $305 | +0% $282 | +5% $259 | +10% $235 |
|---|---|---|---|---|---|
| Rent | -10% $203 | -5% $243 | +0% $282 | +5% $321 | +10% $361 |
| Rate | -1.0pp $323 | -0.5pp $303 | base $282 | +0.5pp $261 | +1.0pp $239 |
UW: 25.0% down · 7.5% · 30yr · 1.5% tax · 5.0% vac · 8.0% maint · 8.0% mgmt
Financing live
Cash to close
- Down payment
- $20,625
- Closing costs
- $2,475
- Reserves months
- —
- Total cash needed
- —
Loan-product check · same deal, 3 products live
Conventional
25% down · 7.5% · 30yr
- Down + closing
- —
- Monthly P&I
- —
- Monthly cashflow
- —
- DSCR
- —
- Eligible?
- —
Personal DTI + credit; lowest rate.
DSCR
20% down · 8.5% · 30yr
- Down + closing
- —
- Monthly P&I
- —
- Monthly cashflow
- —
- DSCR
- —
- Eligible?
- —
No personal income docs; deal must DSCR.
Hard money
10% down · 12.0% · 12mo
- Down + closing
- —
- Monthly P&I
- —
- Monthly cashflow
- —
- DSCR
- —
- Eligible?
- —
Short-term bridge; refi at stabilization.
Listing history 14 events
-
2026-06-21days on market $82,500 Active 19 DOM
-
2026-06-21days on market $82,500 Active 18 DOM
-
2026-06-18days on market $82,500 Active 16 DOM
-
2026-06-17days on market $82,500 Active 15 DOM
-
2026-06-16days on market $82,500 Active 14 DOM
-
2026-06-15days on market $82,500 Active 13 DOM
-
2026-06-13days on market $82,500 Active 11 DOM
-
2026-06-12days on market $82,500 Active 10 DOM
-
2026-06-09days on market $82,500 Active 7 DOM
-
2026-06-08days on market $82,500 Active 6 DOM
-
2026-06-07days on market $82,500 Active 5 DOM
-
2026-06-07days on market $82,500 Active 4 DOM
-
2026-06-02remarks 561-char remark
-
2026-06-02$82,500 Active 1 DOM
ⓘ Source: listings_history table (triggers on properties + properties_extension) + one-shot
backfill from property_details.listing_events for pre-trigger history.
Tax reassessment forecast MI · Partial reset (capped growth)
- Current annual tax
- $445 · $37/mo
- Projected year-2 tax
- $858 · $71/mo
- Expected delta
- +$413/yr (+$34/mo · 92.7%)
ⓘ Screening estimate from a state-policy table — verify with the county assessor before closing.
Nearby sold comps map
Loading sold comps map…
Walkable amenities ~0.75 mi
Loading nearby amenities…
Taxation est. · year 1
- Rental income
- $11,940
- − Mortgage interest
- −$4,621
- − Property taxes
- −$445
- − Insurance
- −$412
- − Repairs & maintenance
- −$955
- − Management
- −$955
- − Depreciation
- −$2,400
- Taxable income
- $2,151
- Est. tax owed @ 24.0%
- −$516
- After-tax cash flow
- $2,867/yr
For passive investors: Depreciation is non-cash, so a rental often shows a tax loss while cash-flowing — sheltering income. Rental losses are passive: they offset passive income freely, and up to $25,000/yr can offset ordinary (W-2) income if you actively participate and your MAGI is under $100k (phasing out to $0 by $150k); unused losses carry forward. On sale, claimed depreciation is recaptured at up to 25%, and gains may owe capital-gains tax (a 1031 exchange can defer both). Figures are a year-1 estimate at your 24.0% rate — not tax advice; consult a CPA.
Schools (NCES district)
- District
- Forest Park School District
- NCES district ID
- 2611190
- Math proficiency
- 27% ▼ -4.00%
- Reading proficiency
- 39% ▼ -7.00%
- Median HH income
- $38,409
- Composite
- 27.54/100
- National rank
- #6947
- State rank
- #331 of 540 in MI
Livability — Mastodon
No livability data for this city. (Only ~50 U.S. cities are tracked.)
Census & demographics
- Census place
- Alpha, MI
- Population (ZIP)
- 5,969
Population outlook (Iron County) Hauer SSP2
- Today (2025)
- 10,485 people
- By 2030
- 9,914 · -5.4%
- By 2040
- 8,698 · -17.0%
- By 2050
- 7,742 · -26.2%
- By 2075
- 6,485 · -38.1%
- By 2100
- 5,396 · -48.5%
Race, ethnicity, and origin ACS 2023
- Neighborhood character
- Predominantly White (94%)
- Race & ethnicity
- White 94% Hispanic / Latino 2% Two or more races 2% Native American 1%
- Common ancestry
- Romanian 10% Lithuanian 6% Portuguese 5%
- Foreign-born
- 1% · Canada, Jamaica, China
- Languages at home
- 98% English-only · Spanish 1%
Political lean MEDSL · Iron
- 2024 margin
- Strong R (+29.3) · D 34.7% · R 64.0% · Other 1.2%
- 2008→2024 swing
- -31.5pp toward R · 2008: 2.1pp · 2024: -29.3pp
- All cycles
- 2024: R+29.3 2020: R+25.4 2016: R+28.3 2012: R+9.0 2008: D+2.1
Not yet ingested
- Civics
- —
Market trends
- HPI YoY
- ▼ -90.38%
- Current HPI
- 224.8101
- Rent YoY
- —
- Metro
- —
- State GDP YoY
- ▲ 1.37%
- F500 in state
- 28
Industry mix (Fortune 500 HQ in MI)
| Industry | F500 HQs | Revenue |
|---|---|---|
| Automotive Parts | 3 | $48B |
|
||
| Automotive | 2 | $372B |
|
||
| Chemicals | 1 | $45B |
|
||
| Automotive Retail | 1 | $29B |
|
||
| Healthcare / Medical Devices | 1 | $23B |
|
||
| Automotive Technology | 1 | $20B |
|
||
Price history
+106.2% since first listed4 events — show timeline
- 2026-05-29 Listed $82,500 UPAR
- 2026-05-29 Listed $82,500 MiRealSource-MiMLS
- 2014-09-04 Sold (Public Records) $30,000 Public Records
- 2010-08-04 Sold (Public Records) $40,000 Public Records
Property tax history
+0.8%/yrLatest (2025): $445 · -23.5% YoY. Source: county tax records.
Cash-flow waterfall
monthlySold comps — $/sqft
last 12 mo · ≤1 miLoading sold comps…