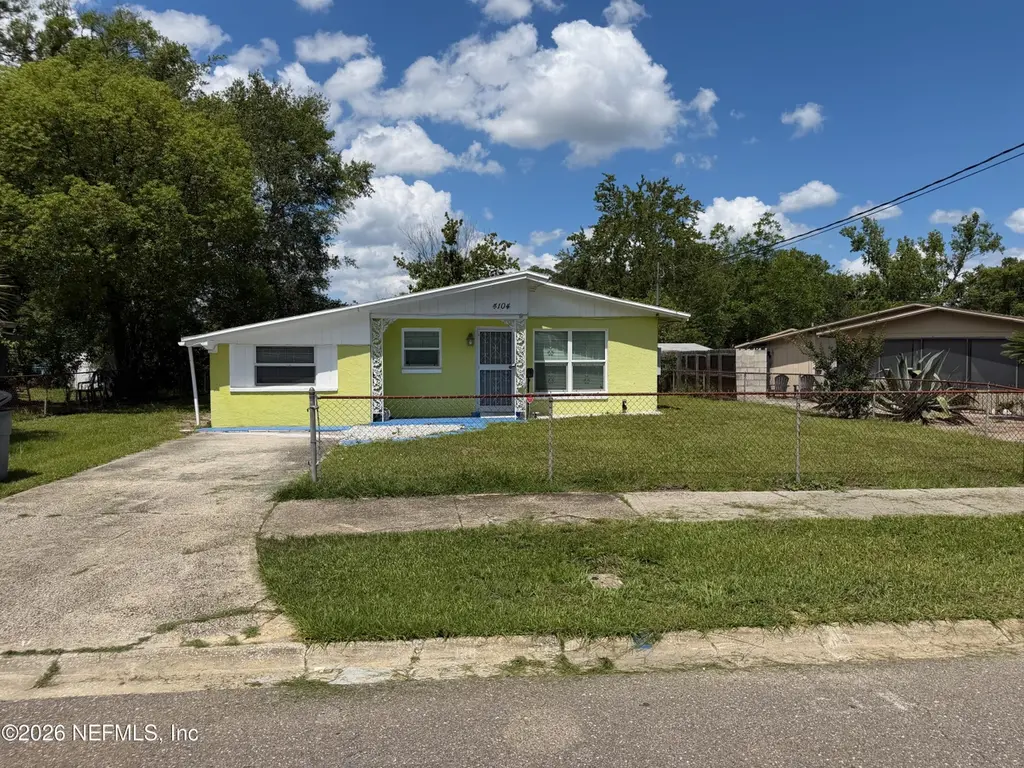
4104 Leonard Cir E · Jacksonville, FL
Flood risk 1/10 · Minimal
- FEMA flood zone
- X (shaded)
- Chance of flooding over 30 yrs
- 0.0%
- Est. flood insurance / yr
- $507 – $1,088
Fire risk 1/10 · Minimal
- Est. fire insurance / yr
- $947 – $1,759
Heat risk 9/10 · Severe
- Hot days now (above 107°F)
- 7 days/yr
- Hot days in 30 yrs
- 20 days/yr
Wind risk 9/10 · Severe
- Chance of severe wind over 30 yrs
- 99.0%
Air-quality risk 4/10 · Minor
- Unhealthy air days now
- 6 days/yr
- Unhealthy air days in 30 yrs
- 6 days/yr
Risk factors via First Street. Map © Google.
Why this score? — see what drove the C- grade
The composite is a weighted blend of 9 inputs, each scored 0–100. Each bar is that input's sub-score; the figure is the points it added to the 100-point composite (weight × sub-score).
- Cash flow +26.2/30.0
- DSCR +8.8/10.0
- 1% rule +5.8/10.0
- Livability +4.2/5.0
- Schools +3.9/10.0
- Rent growth +3.0/5.0
- Condition / age +2.5/5.0
- ARV discount +0.0/15.0
- Appreciation +0.0/10.0
$114,900
🖨 Deal sheet 📄 Offer letter ✓ Due diligence
Listing remarks MLS
PRICE CHANGE: $135,000 EFFECTIVE 11/17/23!! WELCOME HOME! 3 Bedrooms / 1 Bath home. Newer Roof and Central Heat & Air only 6 years old. All Black kitchen appliances convey. Family Room/Den, Bathroom w/ walk-in/low threshold shower, washer and dryer will convey. Carport with awning, screened gazebo in fenced backyard and storage shed will convey as well! Near Airport, Hospitals, Banks, Schools, Shopping and Downtown.
Key facts
- A c system
- Plumbing overhaul
- Electrical panel
Tags
Property features AI
Finance
- HOA & community: Not a senior community
Exterior
- Parking: Other parking
- Utilities: Electricity connected; Water connected
- Home design: Single family residence; Residential single-family use
- Exterior features: No private pool; Lot approximately 0.13 acres
Interior
- Kitchen: Electric range; Refrigerator
- Bedrooms: 3 bedrooms
- Bathrooms: 1 full bathroom
- Heating & cooling: Central heating; Central air conditioning
- Interior features: Electric range; Refrigerator
- Laundry & utility: Washer; Dryer
Neighborhood map
What this means for you Summary
Snapshot
- This is a 3-bed/1.0-bath single-family listed at $115k.
Deal economics
- At list price, monthly cash flow is $291 ($3k/yr) — positive.
- The deal already cash-flows at list — no discount required.
- Meets the 1% rule at list price ($1k rent vs $115k).
- Cap rate 9.3% vs local median 4.0% in Jacksonville — top-decile yield for the area; either an underpriced asset or a hidden risk that comps aren't pricing in. Stress-test before assuming the spread holds.
Location & tenants
- Location reads 83/100 on livability (#50 in FL, #911 nationally) — a professional / high-income tenant draw. Strengths: amenities A+, commute A+, housing A+.
- Duval (urban): math 46% / reading 45% proficiency, ranked #48 of 73 in FL (top 66%) — families likely to look elsewhere, expect single-tenant / working-renter base with shorter leases.
- Market conditions: Rents rising (+1.8%/yr); 394 active listings in the ZIP; 40 comparable units currently listed for rent nearby; rentals at typical pace (median 24d on market — plan ~3-4 weeks tenant-placement turnaround); lower-income renter base — watch delinquency; 6,503 units permitted in Duval County in 2024 (1,131 in 5+ unit buildings).
- At $1,238/mo this rent would consume 49% of the median local household income ($31k/yr) (locally 2921% of renters already pay >50% of income on rent) — very limited rent-growth headroom before tenants either downsize or default.
Forward outlook
- Local home prices are declining (-3.0%/yr); year-one equity from $794 of loan paydown is wiped out by about $3k of value loss. Plan a longer hold.
- Duval County population projected at +19% by 2050 — long-run rental-demand tailwind backs the buy-and-hold thesis.
Negotiation context
- Only 12 days on market — expect competitive offers; lowballing is unlikely to land.
- 7 sale attempts since 10y ago with the ask held roughly flat each time — persistent listings suggest the price (not the market) is what's stuck; bring a comps-based counter.
- Current owner paid $62k; list at $115k implies a 85% gain — meaningful room to come down on a strong offer.
Risks & watch-outs
- Climate carrying-cost: severe wind risk, 99% chance of damaging wind over 30y; extreme-heat days projected 7→20/yr by 2055 (HVAC capex compounding) — expect insurance premiums to compound above CPI over the hold.
Questions for the listing agent
- Built in 1960 — when were the roof, HVAC, electrical panel, plumbing, and water heater last replaced?
- Is there a deadline driving the sale (1031 exchange, divorce, estate, relocation)? That informs how much negotiation room exists.
- Schools are B-rated — typically a magnet for longer-tenancy family renters. What's the average tenant stay here, and is there a school-zone premium baked into asking?
- What's the average days-on-market for RENTAL listings here right now (not sales)? A rising rental-DOM trend means longer vacancies and softer asking-rent achievability than the comps imply.
- What's the recent tenant-quality profile in this submarket — average credit score on applications, eviction rate, late-payment / NSF rate, and stable-employment percentage? A property-management company in the area should have these aggregated.
- How much new for-sale + rental construction is in the pipeline within 1–3 miles? Heavy new supply typically softens prices + rents 12–24 months out; constrained supply supports both.
Investment metrics
- 1% rule
- 1.08% ✓
- Cap rate
- 9.34%
- Cash-on-cash
- 10.87%
- DSCR
- 1.48
- GRM
- 7.7
CMA / ARV
- ARV (on-the-fly)
- $93,330
- Comps found
- 12
Show comp detail 12 sales within ~0.75 mi
| Address | Dist | Beds/Ba | Sqft | Sold | Price | $/sf | Match |
|---|---|---|---|---|---|---|---|
| 2058 W 40th St | 0.42mi | 3/1.0 | 1,010 (-3%) | 1mo | $71,000 | $70 | 75 |
| 2050 W 40th St | 0.41mi | 3/1.0 | 1,010 (-3%) | 3mo | $79,500 | $79 | 74 |
| 1596 W 30th St | 0.39mi | 3/2.0 | 1,052 (+1%) | 4mo | $180,017 | $171 | 72 |
| 3631 Effee St | 0.20mi | 3/2.0 | 1,120 (+8%) | 1mo | $74,000 | $66 | 72 |
| 5352 Dodge Rd | 0.50mi | 3/2.0 | 1,050 (+1%) | 3mo | $75,000 | $71 | 68 |
| 2009 W 17th St | 0.66mi | 4/1.0 (+1) | 1,037 (0%) | 0mo | $60,000 | $58 | 64 |
| 2117 W 41st St | 0.52mi | 3/1.0 | 960 (-7%) | 3mo | $19,000 | $20 | 61 |
| 3424 Gladys St | 0.71mi | 3/1.0 | 1,091 (+5%) | 3mo | $98,000 | $90 | 56 |
| 1901 Pullman Ct | 0.63mi | 2/1.0 (-1) | 969 (-7%) | 0mo | $98,000 | $101 | 54 |
| 3838 Penton St | 0.70mi | 3/1.0 | 950 (-8%) | 1mo | $110,000 | $116 | 52 |
| 1636 W 34th St W | 0.34mi | 4/2.0 (+1) | 1,169 (+13%) | 3mo | $190,000 | $163 | 52 |
| 1485 W 22nd St | 0.70mi | 3/2.0 | 1,152 (+11%) | 5mo | $195,017 | $169 | 41 |
Match score weights: distance 35% · size 25% · config 20% · recency 20%. Top-matched comps best support the ARV.
Projected returns pro-forma
-3.0% appreciation · 1.81% rent growth · sell at horizon
- IRR
- -1.3%
- Equity multiple
- 0.95×
- Total profit
- $-1,566
- Equity at exit
- $17,132
- IRR
- 7.2%
- Equity multiple
- 1.51×
- Total profit
- $16,480
- Equity at exit
- $9,934
Cash invested: $32,172 (down + closing). Projections, not guarantees.
Landlord ↔ Tenant lean methodology
- Overall (STATE)
- 87 Strongly Landlord-Friendly
- State Florida
- 87 Strongly Landlord-Friendly · R+3
- County
- — inherits STATE
- City
- — inherits STATE
ZIP-level market 32209
- Home prices YoY
- -22.1%
- Rents YoY
- 1.8%
- Active inventory
- 394
- Price-to-rent
- 7.7×
Monthly cashflow live
- Estimated rent
- $1,238 high interval (Pro) →
- Mortgage (P&I)
- −$603
- Tax from tax record
- −$36 /mo · $429/yr
- Insurance
- −$48
- HOA
- −$0
- Vacancy / Maint / Mgmt
- −$260
- Net cashflow
- $291
Break-even live
UW: 25.0% down · 7.5% · 30yr · 1.5% tax · 5.0% vac · 8.0% maint · 8.0% mgmt
Financing live
Cash to close
- Down payment
- $28,725
- Closing costs
- $3,447
- Reserves months
- —
- Total cash needed
- —
Loan-product check · same deal, 3 products live
Conventional
25% down · 7.5% · 30yr
- Down + closing
- —
- Monthly P&I
- —
- Monthly cashflow
- —
- DSCR
- —
- Eligible?
- —
Personal DTI + credit; lowest rate.
DSCR
20% down · 8.5% · 30yr
- Down + closing
- —
- Monthly P&I
- —
- Monthly cashflow
- —
- DSCR
- —
- Eligible?
- —
No personal income docs; deal must DSCR.
Hard money
10% down · 12.0% · 12mo
- Down + closing
- —
- Monthly P&I
- —
- Monthly cashflow
- —
- DSCR
- —
- Eligible?
- —
Short-term bridge; refi at stabilization.
Rent comps 40 comps
| Address | Beds | Baths | Sqft | Rent | $/sqft | DOM | Units | Dist |
|---|---|---|---|---|---|---|---|---|
| 1839 W 30th St Jacksonville, FL | 3.0 | 1.0 | 828 | $1,050 | $1.27 | 23d | 1 | 0.11mi |
| 1863 W 29th St Jacksonville, FL | 3.0 | 2.0 | 956 | $1,190 | $1.24 | 21d | 1 | 0.13mi |
| 1837 W 28th St Jacksonville, FL | 3.0 | 2.0 | 1333 | $1,600 | $1.20 | 23d | 1 | 0.19mi |
| 1737 W 28th St Jacksonville, FL | 3.0 | 1.0 | 1105 | $700 | $0.63 | 23d | 1 | 0.25mi |
| 1830 W 27th St Jacksonville, FL | 3.0 | 2.0 | 952 | $1,375 | $1.44 | 23d | 1 | 0.26mi |
| 1842 W 26th St Jacksonville, FL | 3.0 | 2.0 | 933 | $1,200 | $1.29 | 23d | 1 | 0.30mi |
| 1653 W 35th St Jacksonville, FL | 2.0 | 1.0 | 800 | $825 | $1.03 | 23d | 1 | 0.33mi |
| 1867 W 41st St Jacksonville, FL | 3.0 | 2.0 | 1218 | $1,325 | $1.09 | 17d | 1 | 0.33mi |
| 1636 W 28th St Jacksonville, FL | 3.0 | 2.0 | 912 | $1,375 | $1.51 | 23d | 1 | 0.35mi |
| 1599 W 30th St Unit B Jacksonville, FL | 2.0 | 1.0 | 780 | $1,150 | $1.47 | 14d | 1 | 0.37mi |
| 1584 W 31st St Unit 3 Jacksonville, FL | 2.0 | 1.0 | 832 | $900 | $1.08 | 23d | 1 | 0.38mi |
| 1587 W 30th St Jacksonville, FL | 3.0 | 1.0 | 1363 | $1,450 | $1.06 | 14d | 1 | 0.39mi |
| 1625 W 26th St Unit 2 Jacksonville, FL | 2.0 | 1.0 | 750 | $800 | $1.07 | 23d | 1 | 0.41mi |
| 1625 W 26th St Unit 4 Jacksonville, FL | 2.0 | 1.0 | 750 | $900 | $1.20 | 23d | 1 | 0.41mi |
| 1625 W 26th St Jacksonville, FL | 2.0 | 1.0 | 750 | $800 | $1.07 | 1d | 1 | 0.41mi |
| 2050 W 40th St Jacksonville, FL | 3.0 | 1.0 | 1010 | $1,350 | $1.34 | 16d | 1 | 0.41mi |
| 1968 W 23rd St Unit Main Jacksonville, FL | 3.0 | 2.0 | 1106 | $1,400 | $1.27 | 21d | 1 | 0.43mi |
| 1551 W 33rd St #2 Jacksonville, FL | 2.0 | 1.0 | 842 | $795 | $0.94 | 20d | 1 | 0.44mi |
| 1708 W 24th St Jacksonville, FL | 3.0 | 2.0 | 1428 | $1,250 | $0.88 | 7d | 1 | 0.45mi |
| 5350 Dodge Rd Jacksonville, FL | 3.0 | 1.0 | 1000 | $1,500 | $1.50 | 23d | 1 | 0.45mi |
| 1971 W 22nd St Jacksonville, FL | 3.0 | 1.0 | 1094 | $1,095 | $1.00 | 7d | 1 | 0.45mi |
| 5352 Dodge Rd Jacksonville, FL | 3.0 | 2.0 | 1050 | $1,261 | $1.20 | 23d | 1 | 0.47mi |
| 1823 W 44th St Jacksonville, FL | 3.0 | 2.0 | 1066 | $1,500 | $1.41 | 23d | 1 | 0.48mi |
| 1712 W 23rd St Jacksonville, FL | 3.0 | 2.0 | 1200 | $1,275 | $1.06 | 23d | 1 | 0.48mi |
| 1803 W 44th St Unit 1803 Jacksonville, FL | 2.0 | 1.0 | 750 | $950 | $1.27 | 7d | 1 | 0.49mi |
| 1609 W 24th St Jacksonville, FL | 3.0 | 2.0 | 1169 | $1,223 | $1.05 | 21d | 1 | 0.49mi |
| 1645 W 23rd St Unit 2 Jacksonville, FL | 3.0 | 1.0 | 912 | $1,275 | $1.40 | 23d | 1 | 0.50mi |
| 1530 W 29th St Jacksonville, FL | 3.0 | 2.0 | 1164 | $1,385 | $1.19 | 23d | 1 | 0.50mi |
| 1490 W 33rd St Jacksonville, FL | 4.0 | 1.5 | 1150 | $1,150 | $1.00 | 23d | 1 | 0.52mi |
| 4813 Moncrief Rd Jacksonville, FL | 2.0–3.0 | 1.0 | 755 | $920 | $1.22 | 2d | 8 | 0.54mi |
| 2171 W 40th St Jacksonville, FL | 2.0 | 1.0 | 700 | $950 | $1.36 | 23d | 1 | 0.55mi |
| 1959 W 45th St Jacksonville, FL | 2.0 | 1.0 | 895 | $1,245 | $1.39 | 14d | 1 | 0.57mi |
| 4114 Moncrief Rd Jacksonville, FL | 2.0 | 1.0 | 821 | $975 | $1.19 | 7d | 1 | 0.60mi |
| 4114 Moncrief Rd Unit 2 Jacksonville, FL | 2.0 | 1.0 | 821 | $1,050 | $1.28 | 23d | 1 | 0.60mi |
| 1593 W 21st St Jacksonville, FL | 2.0 | 1.0 | 805 | $922 | $1.15 | 23d | 1 | 0.63mi |
| 1417 W 31st St Jacksonville, FL | 3.0 | 1.0 | 880 | $1,100 | $1.25 | 1d | 1 | 0.65mi |
| 5306 Paris Ave Jacksonville, FL | 3.0 | 1.0 | 944 | $1,150 | $1.22 | 23d | 1 | 0.65mi |
| 1730 W 19th St Jacksonville, FL | 3.0 | 2.0 | 1323 | $1,100 | $0.83 | 1d | 1 | 0.65mi |
| 1901 Pullman Ct Jacksonville, FL | 2.0 | 1.0 | 969 | $1,295 | $1.34 | 7d | 1 | 0.66mi |
| 1407 W 31st St Jacksonville, FL | 3.0 | 3.5 | 1140 | $1,550 | $1.36 | 23d | 1 | 0.67mi |
Listing history 11 events
-
2026-06-18days on market $114,900 Active 12 DOM
-
2026-06-17days on market $114,900 Active 11 DOM
-
2026-06-16days on market $114,900 Active 10 DOM
-
2026-06-16price $114,900 Active 9 DOM
-
2026-06-15days on market $115,000 Active 9 DOM
-
2026-06-13days on market $115,000 Active 7 DOM
-
2026-06-13days on market $115,000 Active 6 DOM
-
2026-06-09days on market $115,000 Active 3 DOM
-
2026-06-08days on market $115,000 Active 2 DOM
-
2026-06-07remarks 699-char remark
-
2026-06-07$115,000 Active 1 DOM
ⓘ Source: listings_history table (triggers on properties + properties_extension) + one-shot
backfill from property_details.listing_events for pre-trigger history.
Tax reassessment forecast FL · Resets to sale price
- Current annual tax
- $429 · $36/mo
- Projected year-2 tax
- $954 · $79/mo
- Expected delta
- +$524/yr (+$44/mo · 122.1%)
ⓘ Screening estimate from a state-policy table — verify with the county assessor before closing.
Climate risk First Street
- Flood 1/10 Low FEMA zone X (shaded) · 0% chance over 30 yrs
- Wildfire 1/10 Low
- Heat 9/10 Extreme 7 d/yr ≥107°F today · 20 d/yr by 30 yrs out
- Wind 9/10 Extreme 99% chance of damaging wind over 30 yrs
- Air quality 4/10 Moderate 6 unhealthy d/yr today · 6 by 30 yrs out
Nearby sold comps map
Loading sold comps map…
Walkable amenities ~0.75 mi
Loading nearby amenities…
Taxation est. · year 1
- Rental income
- $14,851
- − Mortgage interest
- −$6,436
- − Property taxes
- −$429
- − Insurance
- −$574
- − Repairs & maintenance
- −$1,188
- − Management
- −$1,188
- − Depreciation
- −$3,343
- Taxable income
- $1,692
- Est. tax owed @ 24.0%
- −$406
- After-tax cash flow
- $3,092/yr
For passive investors: Depreciation is non-cash, so a rental often shows a tax loss while cash-flowing — sheltering income. Rental losses are passive: they offset passive income freely, and up to $25,000/yr can offset ordinary (W-2) income if you actively participate and your MAGI is under $100k (phasing out to $0 by $150k); unused losses carry forward. On sale, claimed depreciation is recaptured at up to 25%, and gains may owe capital-gains tax (a 1031 exchange can defer both). Figures are a year-1 estimate at your 24.0% rate — not tax advice; consult a CPA.
Schools (NCES district)
- District
- Duval
- NCES district ID
- 1200480
- Math proficiency
- 46% ▼ -11.00%
- Reading proficiency
- 45% ▼ -4.00%
- Median HH income
- $48,987
- Composite
- 38.97/100
- National rank
- #4076
- State rank
- #48 of 73 in FL
Livability — Jacksonville
- Score
- 83/100
- State rank
- #50
- US rank
- #911
Category grades
Schools grade is shown separately in the Schools card above.
Census & demographics
- Census place
- Jacksonville, FL
- County
- Duval County · 1,015,274 people
- City population
- 979,034
- Metro
- Jacksonville, FL
- Population (ZIP)
- 34,657
- Household income
- $30,514
- Rent vs Own
- Severe rent burden
- 2921.0
Population outlook (Duval County) Hauer SSP2
- Today (2025)
- 1,013,010 people
- By 2030
- 1,059,228 · +4.6%
- By 2040
- 1,141,439 · +12.7%
- By 2050
- 1,205,258 · +19.0%
- By 2075
- 1,324,282 · +30.7%
- By 2100
- 1,319,620 · +30.3%
Race, ethnicity, and origin ACS 2023
- Neighborhood character
- Predominantly Black (88%)
- Race & ethnicity
- Black 88% White 5% Hispanic / Latino 5% Two or more races 2%
- Hispanic origin (detail)
- Puerto Rican 3%
- Common ancestry
- Hispanic 1% Romanian 1%
- Foreign-born
- 3% · Canada
- Languages at home
- 95% English-only · Spanish 4% French/Haitian/Cajun 1%
Political lean MEDSL · Duval
- 2024 margin
- Toss-up / Even · D 48.7% · R 50.1% · Other 1.2%
- 2008→2024 swing
- +0.4pp no change · 2008: -1.9pp · 2024: -1.5pp
- All cycles
- 2024: R+1.5 2020: D+3.8 2016: R+1.5 2012: R+3.6 2008: R+1.9
Not yet ingested
- Civics
- —
Market trends
- HPI YoY
- ▼ -53.92%
- Current HPI
- 189.5977
- Rent YoY
- ▲ 1.81%
- Metro
- Jacksonville, FL
- State GDP YoY
- ▲ 3.28%
- F500 in state
- 36
Industry mix (Fortune 500 HQ in FL)
| Industry | F500 HQs | Revenue |
|---|---|---|
| Industrial Technology | 2 | $29B |
|
||
| Insurance | 2 | $17B |
|
||
| Retail | 1 | $60B |
|
||
| Technology Distribution | 1 | $58B |
|
||
| Homebuilding | 1 | $35B |
|
||
| Technology Manufacturing | 1 | $35B |
|
||
Price history
+349.9% since first listed27 events — show timeline
- 2026-05-13 Sold (Public Records) $62,000 Public Records
- 2026-05-12 Listed $115,000 realMLS
- 2023-12-28 Pending — realMLS
- 2023-12-28 Relisted — realMLS
- 2023-12-23 Listing Removed — realMLS
- 2023-12-07 Pending — realMLS
- 2023-12-07 Relisted — realMLS
- 2023-12-04 Pending — realMLS
- 2023-11-17 Price Changed $135,000 realMLS
- 2023-11-07 Listed $169,900 realMLS
- 2017-06-09 Sold (Public Records) $58,500 Public Records
- 2017-06-02 Sold (MLS) $58,500 realMLS
- 2017-04-26 Pending — realMLS
- 2017-04-26 Contingent — realMLS
- 2017-04-12 Price Changed $65,000 realMLS
- 2017-04-06 Price Changed $69,000 realMLS
- 2017-03-29 Price Changed $74,000 realMLS
- 2017-03-22 Price Changed $75,000 realMLS
- 2017-03-15 Price Changed $76,000 realMLS
- 2017-02-15 Listed $89,000 realMLS
- 2016-06-29 Sold (MLS) $17,019 realMLS
- 2016-06-03 Pending — realMLS
- 2016-06-01 Contingent — realMLS
- 2016-05-24 Relisted — realMLS
- 2016-05-13 Pending — realMLS
- 2016-05-09 Contingent — realMLS
- 2016-04-28 Listed $13,780 realMLS
Property tax history
+8.2%/yrLatest (2025): $429 · +80.5% YoY. Source: county tax records.
Cash-flow waterfall
monthlySold comps — $/sqft
last 12 mo · ≤1 miLoading sold comps…