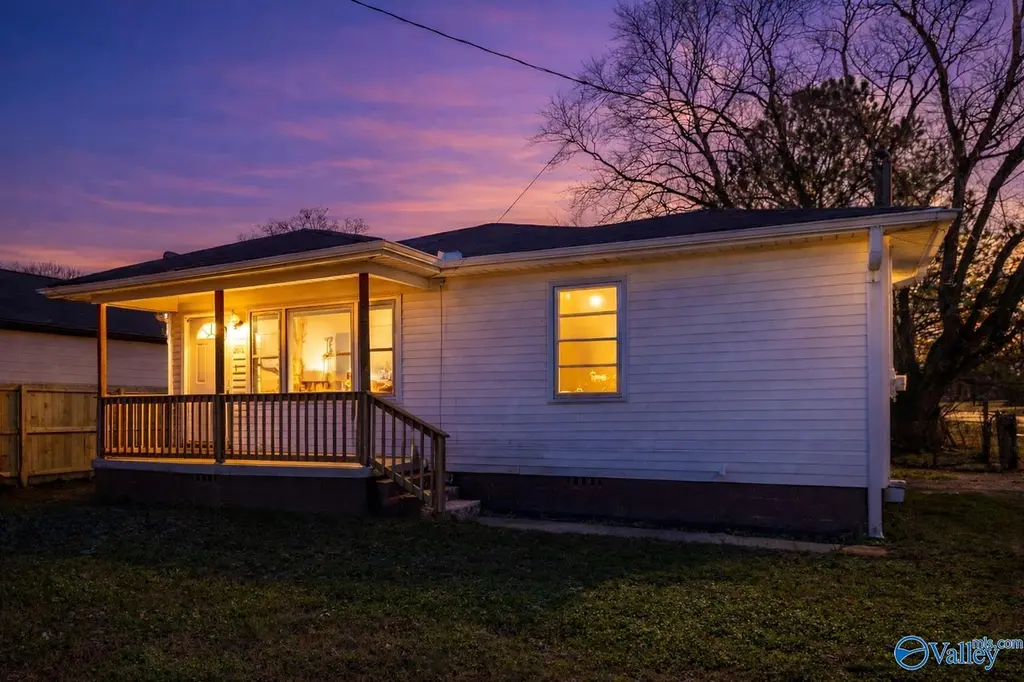
3515 6th Avenue Sw SW · Huntsville, AL
Flood risk 6/10 · Moderate
- FEMA flood zone
- X (unshaded)
- Chance of flooding over 30 yrs
- 0.74%
- Est. flood insurance / yr
- $507 – $1,088
Fire risk 1/10 · Minimal
- Est. fire insurance / yr
- $916 – $1,700
Heat risk 6/10 · Moderate
- Hot days now (above 105°F)
- 7 days/yr
- Hot days in 30 yrs
- 20 days/yr
Wind risk 4/10 · Minor
- Chance of severe wind over 30 yrs
- 17.0%
Air-quality risk 2/10 · Minimal
- Unhealthy air days now
- 1 days/yr
- Unhealthy air days in 30 yrs
- 1 days/yr
Risk factors via First Street. Map © Google.
Why this score? — see what drove the C- grade
The composite is a weighted blend of 9 inputs, each scored 0–100. Each bar is that input's sub-score; the figure is the points it added to the 100-point composite (weight × sub-score).
- Cash flow +20.5/30.0
- ARV discount +11.0/15.0
- DSCR +6.5/10.0
- 1% rule +4.5/10.0
- Livability +4.1/5.0
- Rent growth +3.0/5.0
- Schools +2.9/10.0
- Condition / age +2.5/5.0
- Appreciation +0.0/10.0
$159,900
🖨 Deal sheet 📄 Offer letter ✓ Due diligence
Listing remarks MLS
Affordable opportunity to own a home in Huntsville with easy access to downtown, Redstone Arsenal, and major employers. This inviting bungalow features a functional layout with comfortable living spaces, natural light, and a practical kitchen with ample storage. The corner lot level yard offers space to enjoy outdoor time, garden, or add future improvements. A great option for first-time buyers seeking homeownership at an attainable price in a growing area.
Key facts
- Level yard
- Corner lot
- Ample storage
Tags
Neighborhood map
What this means for you Summary
Snapshot
- This is a 3-bed/1.0-bath single-family listed at $160k.
Deal economics
- At list price, monthly cash flow is $212 ($3k/yr) — positive.
- The deal already cash-flows at list — no discount required.
- To meet the 1% rule (rent ≥ 1% of price), the offer needs to be $151k (5.3% below list).
- Recommended offer: $141k (12.0% below list) — sets the bar for market timing.
- Cap rate 7.9% vs local median 3.8% in Huntsville — top-decile yield for the area; either an underpriced asset or a hidden risk that comps aren't pricing in. Stress-test before assuming the spread holds.
Location & tenants
- Location reads 82/100 on livability (#3 in AL, #1,082 nationally) — a professional / high-income tenant draw. Strengths: commute A+, cost of living A+, housing A+; Watch: crime F.
- Huntsville City (urban): math 21% / reading 46% proficiency, ranked #48 of 129 in AL (top 37%) — families likely to look elsewhere, expect single-tenant / working-renter base with shorter leases.
- Market conditions: Rents rising (+1.8%/yr); 133 active listings in the ZIP; 40 comparable units currently listed for rent nearby; rentals at typical pace (median 24d on market — plan ~3-4 weeks tenant-placement turnaround); lower-income renter base — watch delinquency; 4,709 units permitted in Madison County in 2024 (1,186 in 5+ unit buildings).
- At $1,514/mo this rent would consume 51% of the median local household income ($35k/yr) (locally 1750% of renters already pay >50% of income on rent) — very limited rent-growth headroom before tenants either downsize or default.
Forward outlook
- Local home prices are declining (-3.0%/yr); year-one equity from $1k of loan paydown is wiped out by about $5k of value loss. Plan a longer hold.
- Madison County population projected at +18% by 2050 — long-run rental-demand tailwind backs the buy-and-hold thesis.
Negotiation context
- It's been on market 153 days — a 12% lower offer ($141k) is reasonable based on typical stale-listing flexibility.
Risks & watch-outs
- Watch-outs: built in 1950 — expect roof / HVAC / electrical / plumbing capex.
- Climate carrying-cost: major flood risk; extreme-heat days projected 7→20/yr by 2055 (HVAC capex compounding) — expect insurance premiums to compound above CPI over the hold.
Questions for the listing agent
- It's been on market 153 days. Have you received any prior offers? Is the seller open to a 12% concession, seller financing, or rate buy-down credit?
- Built in 1950 — when were the roof, HVAC, electrical panel, plumbing, and water heater last replaced?
- Why hasn't it sold? Are there any deal-killer items the seller is aware of (foundation, flood, title, zoning, code violations)?
- Is there a deadline driving the sale (1031 exchange, divorce, estate, relocation)? That informs how much negotiation room exists.
- Crime grade is F in this area — have there been break-ins, vandalism, or insurance claims at this property in the last 3 years? What carrier currently insures it and at what premium?
- What's the average days-on-market for RENTAL listings here right now (not sales)? A rising rental-DOM trend means longer vacancies and softer asking-rent achievability than the comps imply.
- What's the recent tenant-quality profile in this submarket — average credit score on applications, eviction rate, late-payment / NSF rate, and stable-employment percentage? A property-management company in the area should have these aggregated.
- How much new for-sale + rental construction is in the pipeline within 1–3 miles? Heavy new supply typically softens prices + rents 12–24 months out; constrained supply supports both.
Investment metrics
- 1% rule
- 0.95% ✗
- Cap rate
- 7.88%
- Cash-on-cash
- 5.68%
- DSCR
- 1.25
- GRM
- 8.8
CMA / ARV
- ARV (median comp)
- $173,236
- List price
- $159,900
- Delta
- -7.70%
- Verdict
- FAIR
- Comps
- 20 within 1.0 mi
Show comp detail 12 sales within ~0.75 mi
| Address | Dist | Beds/Ba | Sqft | Sold | Price | $/sf | Match |
|---|---|---|---|---|---|---|---|
| 3900 Birch Ave SW | 0.30mi | 2/1.0 (-1) | 1,008 (0%) | 2mo | $179,000 | $178 | 79 |
| 3916 Birch Ave SW | 0.39mi | 2/1.0 (-1) | 986 (-2%) | 1mo | $158,700 | $161 | 72 |
| 3811 8th Ave SW | 0.28mi | 2/1.0 (-1) | 960 (-5%) | 3mo | $200,000 | $208 | 72 |
| 2105 North Rose Dr SW | 0.58mi | 2/1.0 (-1) | 1,008 (0%) | 0mo | $129,000 | $128 | 68 |
| 3916 SW Hawthorne Ave | 0.38mi | 2/1.0 (-1) | 1,053 (+4%) | 3mo | $186,000 | $177 | 68 |
| 3503 7th Ave | 0.10mi | 2/1.0 (-1) | 1,149 (+14%) | 7mo | $133,100 | $116 | 62 |
| 4013 9th Ave | 0.48mi | 2/1.0 (-1) | 1,060 (+5%) | 7mo | $125,000 | $118 | 58 |
| 3012 7th Ave SW | 0.45mi | 3/1.0 | 1,132 (+12%) | 1mo | $88,000 | $78 | 58 |
| 3906 10th Ave SW | 0.42mi | 3/2.0 | 1,096 (+9%) | 5mo | $225,000 | $205 | 58 |
| 4004 Cypress Ave SW | 0.46mi | 3/2.0 | 1,125 (+12%) | 1mo | $268,000 | $238 | 54 |
| 4214 9th Ave | 0.63mi | 3/1.0 | 1,080 (+7%) | 7mo | $229,000 | $212 | 52 |
| 2207 Walnut St SW | 0.60mi | 3/1.5 | 1,082 (+7%) | 7mo | $265,000 | $245 | 52 |
Match score weights: distance 35% · size 25% · config 20% · recency 20%. Top-matched comps best support the ARV.
Projected returns pro-forma
-3.0% appreciation · 1.82% rent growth · sell at horizon
- IRR
- -8.8%
- Equity multiple
- 0.68×
- Total profit
- $-14,247
- Equity at exit
- $23,842
- IRR
- -0.8%
- Equity multiple
- 0.95×
- Total profit
- $-2,360
- Equity at exit
- $13,825
Cash invested: $44,772 (down + closing). Projections, not guarantees.
Landlord ↔ Tenant lean methodology
- Overall (STATE)
- 90 Strongly Landlord-Friendly
- State Alabama
- 90 Strongly Landlord-Friendly · R+15
- County
- — inherits STATE
- City
- — inherits STATE
ZIP-level market 35805
- Home prices YoY
- -17.4%
- Rents YoY
- 1.8%
- Active inventory
- 133
- Price-to-rent
- 8.8×
Monthly cashflow live
- Estimated rent
- $1,514 high interval (Pro) →
- Mortgage (P&I)
- −$839
- Tax from tax record
- −$79 /mo · $945/yr
- Insurance
- −$67
- HOA
- −$0
- Vacancy / Maint / Mgmt
- −$318
- Net cashflow
- $212
Break-even live
UW: 25.0% down · 7.5% · 30yr · 1.5% tax · 5.0% vac · 8.0% maint · 8.0% mgmt
Financing live
Cash to close
- Down payment
- $39,975
- Closing costs
- $4,797
- Reserves months
- —
- Total cash needed
- —
Loan-product check · same deal, 3 products live
Conventional
25% down · 7.5% · 30yr
- Down + closing
- —
- Monthly P&I
- —
- Monthly cashflow
- —
- DSCR
- —
- Eligible?
- —
Personal DTI + credit; lowest rate.
DSCR
20% down · 8.5% · 30yr
- Down + closing
- —
- Monthly P&I
- —
- Monthly cashflow
- —
- DSCR
- —
- Eligible?
- —
No personal income docs; deal must DSCR.
Hard money
10% down · 12.0% · 12mo
- Down + closing
- —
- Monthly P&I
- —
- Monthly cashflow
- —
- DSCR
- —
- Eligible?
- —
Short-term bridge; refi at stabilization.
Rent comps 40 comps
| Address | Beds | Baths | Sqft | Rent | $/sqft | DOM | Units | Dist |
|---|---|---|---|---|---|---|---|---|
| 3605 6th Ave SW Huntsville, AL | 2.0 | 1.5 | 1338 | $2,000 | $1.49 | 43d | 1 | 0.04mi |
| 3700 Governors Dr SW Huntsville, AL | 3.0 | 1.0–2.0 | 1547 | $2,588 | $1.67 | 13d | 58 | 0.18mi |
| 3801 6th Ave SW Huntsville, AL | 2.0 | 2.0 | 953 | $1,325 | $1.39 | 23d | 2 | 0.21mi |
| 2900 4th Ave NW Huntsville, AL | 2.0 | 1.0–2.0 | 765 | $1,804 | $2.36 | 13d | 81 | 0.32mi |
| 3912 Pine Ave SW Huntsville, AL | 3.0 | 1.0 | 1350 | $1,450 | $1.07 | 23d | 1 | 0.35mi |
| 4013 9th Ave SW Huntsville, AL | 2.0 | 1.0 | 1060 | $1,098 | $1.04 | 43d | 1 | 0.48mi |
| 609 10th St NW Huntsville, AL | 4.0 | 2.0 | 1140 | $1,650 | $1.45 | 23d | 1 | 0.54mi |
| 612 Marguerite Dr NW Huntsville, AL | 3.0 | 1.0 | 1040 | $1,400 | $1.35 | 43d | 1 | 0.56mi |
| 4112 17th St SW Unit C Huntsville, AL | 2.0 | 2.0 | 750 | $1,095 | $1.46 | 43d | 1 | 0.61mi |
| 3016 Holmes Ave NW Huntsville, AL | 3.0 | 1.0 | 1092 | $1,275 | $1.17 | 23d | 1 | 0.72mi |
| 2708 7th Ave SW Unit D Huntsville, AL | 2.0 | 1.0 | 1000 | $950 | $0.95 | 43d | 1 | 0.73mi |
| 2714 9th Ave SW Huntsville, AL | 3.0 | 2.0 | 1300 | $1,500 | $1.15 | 43d | 1 | 0.73mi |
| 905 Fairway Dr NW Huntsville, AL | 2.0 | 1.0 | 1000 | $995 | $0.99 | 43d | 1 | 0.78mi |
| 4306 9th Ave SW Huntsville, AL | 2.0 | 1.0 | 745 | $1,175 | $1.58 | 23d | 1 | 0.79mi |
| 2700 9th Ave SW Huntsville, AL | 3.0 | 2.0 | 1469 | $1,495 | $1.02 | 43d | 1 | 0.80mi |
| 2999 Woodway Dr SW Huntsville, AL | 1.0–2.0 | 1.0 | 676 | $915 | $1.35 | 13d | 1 | 0.80mi |
| 3615 N Crestview Dr NW Unit 2 Huntsville, AL | 2.0 | 1.5 | 920 | $795 | $0.86 | 23d | 1 | 0.84mi |
| 3902 Harwood Ave SW Huntsville, AL | 3.0 | 1.5 | 1248 | $1,400 | $1.12 | 23d | 1 | 0.86mi |
| 3621 N Crestview Dr NW Unit 2 Huntsville, AL | 2.0 | 1.5 | 900 | $895 | $0.99 | 43d | 1 | 0.86mi |
| 2400 1st St SW Huntsville, AL | 2.0–3.0 | 1.5–2.0 | 1067 | $1,300 | $1.22 | 43d | 2 | 0.88mi |
| 3208 Clopton St SW Huntsville, AL | 2.0 | 1.0 | 812 | $960 | $1.18 | 21d | 1 | 0.89mi |
| 3210 Clopton St SW Huntsville, AL | 2.0 | 1.0 | 812 | $960 | $1.18 | 13d | 1 | 0.90mi |
| 3206 Brook Manor Ave NW Huntsville, AL | 2.0 | 1.0 | 1156 | $1,100 | $0.95 | 13d | 1 | 0.91mi |
| 2500 9th Ave SW Huntsville, AL | 2.0 | 1.0–2.0 | 841 | $1,623 | $1.93 | 13d | 12 | 0.93mi |
| 4405 Judith Ln SW Huntsville, AL | 1.0–3.0 | 1.0–2.0 | 937 | $1,149 | $1.23 | 43d | 8 | 0.93mi |
| 1208 Julia St NW Huntsville, AL | 2.0 | 1.0 | 800 | $745 | $0.93 | 23d | 1 | 0.93mi |
| 407 Warner St NW Huntsville, AL | 3.0 | 1.0 | 1015 | $1,295 | $1.28 | 23d | 1 | 0.93mi |
| 4611 Governors House Dr SW Huntsville, AL | 3.0 | 1.0–2.0 | 1149 | $1,995 | $1.74 | 13d | 12 | 0.98mi |
| 1300 Julia St NW Unit N/A Huntsville, AL | 2.0 | 1.0 | 1100 | $1,195 | $1.09 | 13d | 1 | 0.98mi |
| 804 Appleby St NW Huntsville, AL | 2.0 | 2.0 | 1170 | $1,295 | $1.11 | 13d | 1 | 1.00mi |
| 2700 Union Dr NW Huntsville, AL | 3.0 | 2.0 | 1340 | $1,450 | $1.08 | 21d | 1 | 1.02mi |
| 3205 Hillandale Rd NW Huntsville, AL | 2.0 | 1.0 | 1100 | $1,200 | $1.09 | 43d | 1 | 1.03mi |
| 3204 Berkley St SW Huntsville, AL | 3.0 | 1.5 | 1118 | $1,400 | $1.25 | 23d | 1 | 1.07mi |
| 604 Austin Dr NW Huntsville, AL | 3.0 | 1.0 | 1075 | $1,350 | $1.26 | 23d | 1 | 1.12mi |
| 3218 Fairacres Rd SW Huntsville, AL | 3.0 | 1.5 | 1105 | $1,300 | $1.18 | 43d | 1 | 1.13mi |
| 3009 Hillsboro Rd SW Huntsville, AL | 3.0 | 1.0 | 1000 | $1,250 | $1.25 | 23d | 1 | 1.13mi |
| 608 Austin Dr NW Huntsville, AL | 3.0 | 1.5 | 1100 | $1,350 | $1.23 | 23d | 1 | 1.13mi |
| 909 Woodall Ln NW Huntsville, AL | 3.0 | 2.0 | 1368 | $1,695 | $1.24 | 43d | 1 | 1.13mi |
| 3218 Joslin St SW Huntsville, AL | 3.0 | 1.5 | 1107 | $1,495 | $1.35 | 23d | 1 | 1.14mi |
| 3206 Bayless Dr SW Huntsville, AL | 3.0 | 2.0 | 1150 | $1,400 | $1.22 | 13d | 1 | 1.14mi |
Listing history 19 events
-
2026-06-18days on market $159,900 Active 153 DOM
-
2026-06-17days on market $159,900 Active 152 DOM
-
2026-06-16days on market $159,900 Active 151 DOM
-
2026-06-15days on market $159,900 Active 150 DOM
-
2026-06-14days on market $159,900 Active 148 DOM
-
2026-06-10days on market $159,900 Active 145 DOM
-
2026-06-09days on market $159,900 Active 144 DOM
-
2026-06-08days on market $159,900 Active 143 DOM
-
2026-06-07days on market $159,900 Active 142 DOM
-
2026-06-03days on market $159,900 Active 138 DOM
-
2026-06-02days on market $159,900 Active 137 DOM
-
2026-06-01days on market $159,900 Active 136 DOM
-
2026-05-31days on market $159,900 Active 135 DOM
-
2026-05-30days on market $159,900 Active 134 DOM
-
2026-02-09price $159,900 461-char remark
Show marketing remark (461 chars)
Affordable opportunity to own a home in Huntsville with easy access to downtown, Redstone Arsenal, and major employers. This inviting bungalow features a functional layout with comfortable living spaces, natural light, and a practical kitchen with ample storage. The corner lot level yard offers space to enjoy outdoor time, garden, or add future improvements. A great option for first-time buyers seeking homeownership at an attainable price in a growing area.
-
2026-01-16$174,900 Active 461-char remark
Show marketing remark (461 chars)
Affordable opportunity to own a home in Huntsville with easy access to downtown, Redstone Arsenal, and major employers. This inviting bungalow features a functional layout with comfortable living spaces, natural light, and a practical kitchen with ample storage. The corner lot level yard offers space to enjoy outdoor time, garden, or add future improvements. A great option for first-time buyers seeking homeownership at an attainable price in a growing area.
-
2021-06-14soldstatus $283,000
-
2018-12-27soldstatus $100,000
-
2015-09-23soldstatus $88,500
ⓘ Source: listings_history table (triggers on properties + properties_extension) + one-shot
backfill from property_details.listing_events for pre-trigger history.
Tax reassessment forecast AL · Resets to sale price
- Current annual tax
- $945 · $79/mo
- Projected year-2 tax
- $945 · $79/mo
- Expected delta
- $0/yr ($0/mo · 0.0%)
ⓘ Screening estimate from a state-policy table — verify with the county assessor before closing.
Climate risk First Street
- Flood 6/10 Major FEMA zone X (unshaded) · 74% chance over 30 yrs
- Wildfire 1/10 Low
- Heat 6/10 Major 7 d/yr ≥105°F today · 20 d/yr by 30 yrs out
- Wind 4/10 Moderate 17% chance of damaging wind over 30 yrs
- Air quality 2/10 Low 1 unhealthy d/yr today · 1 by 30 yrs out
Nearby sold comps map
Loading sold comps map…
Walkable amenities ~0.75 mi
Loading nearby amenities…
Taxation est. · year 1
- Rental income
- $18,164
- − Mortgage interest
- −$8,957
- − Property taxes
- −$945
- − Insurance
- −$800
- − Repairs & maintenance
- −$1,453
- − Management
- −$1,453
- − Depreciation
- −$4,652
- Taxable loss
- −$96
- Est. tax savings @ 24.0%
- +$23
- After-tax cash flow
- $2,565/yr
For passive investors: Depreciation is non-cash, so a rental often shows a tax loss while cash-flowing — sheltering income. Rental losses are passive: they offset passive income freely, and up to $25,000/yr can offset ordinary (W-2) income if you actively participate and your MAGI is under $100k (phasing out to $0 by $150k); unused losses carry forward. On sale, claimed depreciation is recaptured at up to 25%, and gains may owe capital-gains tax (a 1031 exchange can defer both). Figures are a year-1 estimate at your 24.0% rate — not tax advice; consult a CPA.
Schools (NCES district)
- District
- Huntsville City
- NCES district ID
- 0101800
- Math proficiency
- 21% ▼ -23.00%
- Reading proficiency
- 46% ▬ 0.00%
- Median HH income
- $48,264
- Composite
- 28.84/100
- National rank
- #6647
- State rank
- #48 of 129 in AL
Livability — Huntsville
- Score
- 82/100
- State rank
- #3
- US rank
- #1082
Category grades
Schools grade is shown separately in the Schools card above.
Census & demographics
- Census place
- Huntsville, AL
- County
- Madison County · 380,832 people
- City population
- 220,435
- Metro
- Huntsville, AL
- Population (ZIP)
- 20,856
- Household income
- $35,385
- Rent vs Own
- Severe rent burden
- 1750.0
Population outlook (Madison County) Hauer SSP2
- Today (2025)
- 392,086 people
- By 2030
- 409,788 · +4.5%
- By 2040
- 440,557 · +12.4%
- By 2050
- 460,990 · +17.6%
- By 2075
- 502,872 · +28.3%
- By 2100
- 513,623 · +31.0%
Race, ethnicity, and origin ACS 2023
- Neighborhood character
- Diverse neighborhood (Simpson 0.69)
- Race & ethnicity
- White 40% Black 31% Hispanic / Latino 24% Two or more races 8%
- Hispanic origin (detail)
- Mexican 17% Puerto Rican 2%
- Common ancestry
- Lithuanian 1% Slovak 1% Serbian 1%
- Foreign-born
- 16% · Canada, Jamaica
- Languages at home
- 76% English-only · Spanish 22% German/W. Germanic 1%
Political lean MEDSL · Madison
- 2024 margin
- Lean R (+9.0) · D 44.7% · R 53.7% · Other 1.6%
- 2008→2024 swing
- +6.0pp toward D · 2008: -14.9pp · 2024: -9.0pp
- All cycles
- 2024: R+9.0 2020: R+8.0 2016: R+16.8 2012: R+18.7 2008: R+14.9
Not yet ingested
- Civics
- —
Market trends
- HPI YoY
- ▼ -48.03%
- Current HPI
- 228.6963
- Rent YoY
- ▲ 1.82%
- Metro
- Huntsville, AL
- State GDP YoY
- ▲ 2.94%
- F500 in state
- 4
Industry mix (Fortune 500 HQ in AL)
| Industry | F500 HQs | Revenue |
|---|---|---|
| Financial Services | 1 | $8B |
|
||
| Healthcare | 1 | $5B |
|
||
Price history
+80.7% since first listed5 events — show timeline
- 2026-02-09 Price Changed $159,900 VMLS
- 2026-01-16 Listed $174,900 VMLS
- 2021-06-14 Sold (Public Records) $283,000 Public Records
- 2018-12-27 Sold (Public Records) $100,000 Public Records
- 2015-09-23 Sold (Public Records) $88,500 Public Records
Property tax history
+10.7%/yrLatest (2024): $945 · +15.6% YoY. Source: county tax records.
Cash-flow waterfall
monthlySold comps — $/sqft
last 12 mo · ≤1 miLoading sold comps…