13346 Pecan Trails Dr · Santa Fe, TX
Flood risk 1/10 · Minimal
- FEMA flood zone
- X (unshaded)
- Chance of flooding over 30 yrs
- 0.0%
- Est. flood insurance / yr
- $507 – $1,088
Fire risk 3/10 · Minor
- Est. fire insurance / yr
- $1,222 – $2,270
Heat risk 10/10 · Severe
- Hot days now (above 109°F)
- 7 days/yr
- Hot days in 30 yrs
- 26 days/yr
Wind risk 9/10 · Severe
- Chance of severe wind over 30 yrs
- 99.0%
Air-quality risk 2/10 · Minimal
- Unhealthy air days now
- 1 days/yr
- Unhealthy air days in 30 yrs
- 1 days/yr
Risk factors via First Street. Map © Google.
Why this score? — see what drove the B- grade
The composite is a weighted blend of 9 inputs, each scored 0–100. Each bar is that input's sub-score; the figure is the points it added to the 100-point composite (weight × sub-score).
- Cash flow +30.0/30.0
- 1% rule +10.0/10.0
- DSCR +10.0/10.0
- ARV discount +7.9/15.0
- Schools +3.5/10.0
- Livability +3.4/5.0
- Rent growth +2.5/5.0
- Condition / age +2.2/5.0
- Appreciation +0.0/10.0
$319,900
🖨 Deal sheet 📄 Offer letter ✓ Due diligence
Listing remarks
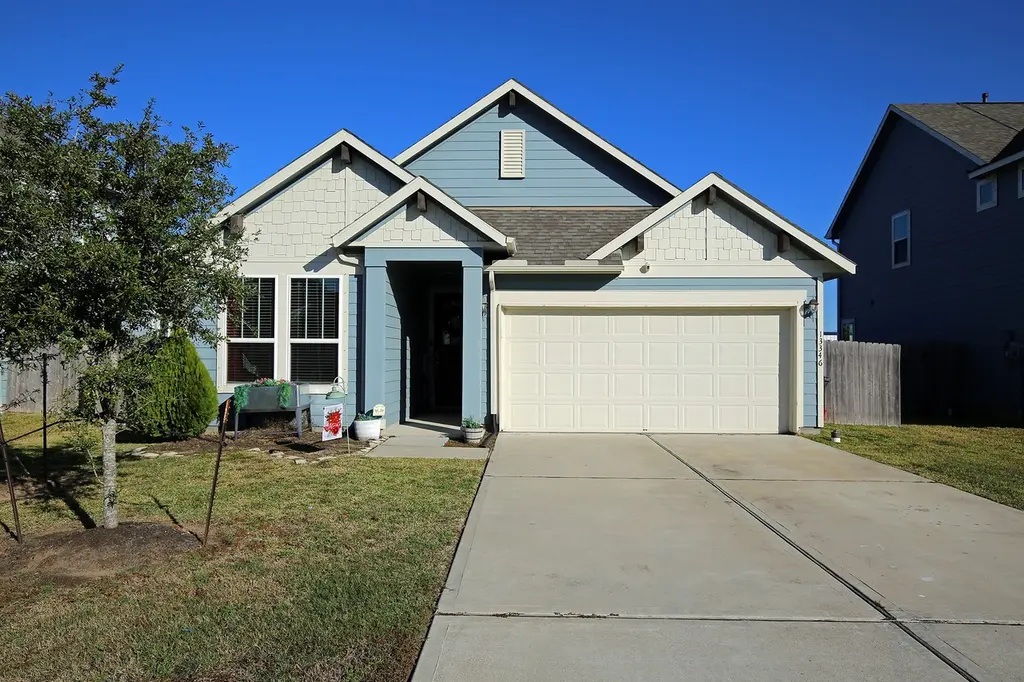
Built in 2020, this move-in ready 4-bedroom, 3-bath home in Pecan Trails offers a spacious one-story layout designed for comfortable living and entertaining. The open concept floor plan features a kitchen with granite countertops, gas cooking, Energy Star appliances, and ample cabinet space. The private primary suite includes a soaking tub, separate shower, and walk in closet. Three additional bedrooms and two full baths provide flexibility for guests, home office or growing households. One of the homes standouts features is the oversized backyard with plenty of room for outdoor activities, pets, gardening, or future additions. Additional features include a tankless water heater, two car ga
Key facts
- Granite countertops
- Oversized backyard
- 7,640 sq ft lot
Tags
Property features AI
Finance
- HOA & community: Pecan Trails HOA with an annual fee of $500
Exterior
- Parking: Attached garage; 2 garage spaces
- Security: Smoke detector(s)
- Utilities: Public water; Public sewer
- Home design: Residential property; Built in 2020; Slab foundation; Composition roof
- Construction: Cement siding; Wood siding
- Exterior features: Covered patio; Deck; Patio; Private yard; Fence (back yard); Located in a cul-de-sac; Subdivision setting; Concrete road surface
Interior
- Kitchen: Dishwasher; Gas cooktop; Gas oven; Microwave; Refrigerator
- Bedrooms: Total rooms: 11
- Flooring: Carpet; Tile
- Bathrooms: 3 full bathrooms
- Heating & cooling: Central heating (gas); Central air; Electric cooling; Attic fan
- Interior features: Breakfast bar; Double vanity; Granite counters; High ceilings; Kitchen island; Kitchen/family room combo; Pantry; Soaking tub; Separate shower; Tub/shower combination; Window treatments; Ceiling fan(s); Kitchen/dining combo; Programmable thermostat; Low emissivity windows; Window coverings; ENERGY STAR qualified appliances; Tankless water heater
- Laundry & utility: Washer hookup; Gas dryer hookup; Washer; Dryer
Neighborhood map
What this means for you Summary
Snapshot
- This is a 4-bed/3.0-bath single-family listed at $320k. Condition is rated fair.
Deal economics
- At list price, monthly cash flow is $4k ($54k/yr) — positive.
- The deal already cash-flows at list — no discount required.
- Meets the 1% rule at list price ($9k rent vs $320k).
- Cap rate 23.0% vs local median 4.5% in Santa Fe — top-decile yield for the area; either an underpriced asset or a hidden risk that comps aren't pricing in. Stress-test before assuming the spread holds.
Location & tenants
- Location reads 67/100 on livability (#550 in TX) — a middle-class / working-renter tenant base. Strengths: crime A+, cost of living A+, housing A+; Watch: amenities F, commute F, health & safety F.
- Santa Fe ISD (suburban): math 38% / reading 39% proficiency, ranked #385 of 826 in TX (top 47%) — families likely to look elsewhere, expect single-tenant / working-renter base with shorter leases.
- Zoned schools: Dan J Kubacak El (math 44% / reading 38%, grade F, #1,462 of 4,322 statewide, top 34%, 687 students, 56% FRL); Santa Fe H S (math 19% / reading 34%, grade F, #1,228 of 1,632 statewide, top 76%, 1,369 students, 47% FRL) — zoned schools average 52% FRL vs 35% district-wide (17 pts higher); higher-poverty schools than district average — tighter screening recommended.
- Market conditions: 233 active listings in the ZIP; 2 comparable units currently listed for rent nearby; 3,258 units permitted in Galveston County in 2024 (0 in 5+ unit buildings).
Forward outlook
- Local home prices are declining (-3.0%/yr); year-one equity from $2k of loan paydown is wiped out by about $10k of value loss. Plan a longer hold.
- Galveston County population projected at +43% by 2050 — long-run rental-demand tailwind backs the buy-and-hold thesis.
- At projected returns (-3.0% appreciation + 3.0% rent growth), your $90k cash investment doubles in ~2 years — after that, you're playing with house money.
Negotiation context
- Only 1 days on market — expect competitive offers; lowballing is unlikely to land.
- 10 sale attempts since 6y ago with the ask held roughly flat each time — persistent listings suggest the price (not the market) is what's stuck; bring a comps-based counter.
Risks & watch-outs
- Climate carrying-cost: severe wind risk, 99% chance of damaging wind over 30y; extreme-heat days projected 7→26/yr by 2055 (HVAC capex compounding) — expect insurance premiums to compound above CPI over the hold.
Questions for the listing agent
- Have any recent inspections been done? Can we get a copy of the seller's disclosures and any deferred-maintenance estimates?
- What does the HOA fee cover, when was the last increase, and are there any pending special assessments or reserve-fund shortfalls?
- Is there a deadline driving the sale (1031 exchange, divorce, estate, relocation)? That informs how much negotiation room exists.
- What's the average days-on-market for RENTAL listings here right now (not sales)? A rising rental-DOM trend means longer vacancies and softer asking-rent achievability than the comps imply.
- What's the recent tenant-quality profile in this submarket — average credit score on applications, eviction rate, late-payment / NSF rate, and stable-employment percentage? A property-management company in the area should have these aggregated.
- How much new for-sale + rental construction is in the pipeline within 1–3 miles? Heavy new supply typically softens prices + rents 12–24 months out; constrained supply supports both.
Investment metrics
- 1% rule
- 2.73% ✓
- Cap rate
- 23.05%
- Cash-on-cash
- 59.83%
- DSCR
- 3.66
- GRM
- 3.1
CMA / ARV
- ARV (median comp)
- $322,569
- List price
- $319,900
- Delta
- 0.72%
- Verdict
- FAIR
- Comps
- 20 within 1.0 mi
Show comp detail 11 sales within ~0.75 mi
| Address | Dist | Beds/Ba | Sqft | Sold | Price | $/sf | Match |
|---|---|---|---|---|---|---|---|
| 3704 Avenue S E | 0.12mi | 3/2.5 (-1) | 1,750 (-4%) | 2mo | $335,000 | $191 | 79 |
| 13331 Pecan Trails Dr | 0.05mi | 3/2.0 (-1) | 1,689 (-8%) | 3mo | $314,999 | $187 | 73 |
| 3811 Anna Ct | 0.17mi | 3/2.0 (-1) | 1,995 (+9%) | 1mo | $264,900 | $133 | 67 |
| 13306 Winston Dr | 0.20mi | 3/2.0 (-1) | 1,624 (-11%) | 3mo | $399,900 | $246 | 61 |
| 3807 Wade St | 0.55mi | 3/1.5 (-1) | 1,803 (-1%) | 4mo | $305,000 | $169 | 58 |
| 12725 W 6th St | 0.73mi | 3/2.0 (-1) | 1,798 (-2%) | 1mo | $340,000 | $189 | 53 |
| 13246 8th St | 0.62mi | 3/2.0 (-1) | 1,846 (+1%) | 13mo | $218,000 | $118 | 49 |
| 13726 Bunde Rd | 0.48mi | 4/2.0 | 2,046 (+12%) | 7mo | $450,000 | $220 | 47 |
| 3411 Sunflower | 0.34mi | 3/2.5 (-1) | 2,049 (+12%) | 19mo | $460,000 | $224 | 41 |
| 13903 3rd St | 0.62mi | 3/2.0 (-1) | 1,585 (-13%) | 14mo | $359,000 | $226 | 29 |
| 13907 3rd St | 0.62mi | 3/2.0 (-1) | 1,585 (-13%) | 14mo | $355,000 | $224 | 28 |
Match score weights: distance 35% · size 25% · config 20% · recency 20%. Top-matched comps best support the ARV.
Projected returns pro-forma
-3.0% appreciation · 3.0% rent growth · sell at horizon
- IRR
- 58.6%
- Equity multiple
- 3.60×
- Total profit
- $232,866
- Equity at exit
- $47,698
- IRR
- 63.4%
- Equity multiple
- 7.37×
- Total profit
- $570,130
- Equity at exit
- $27,659
Cash invested: $89,572 (down + closing). Projections, not guarantees.
Landlord ↔ Tenant lean methodology
- Overall (STATE)
- 87 Strongly Landlord-Friendly
- State Texas
- 87 Strongly Landlord-Friendly · R+5
- County
- — inherits STATE
- City
- — inherits STATE
ZIP-level market 77510
- Home prices YoY
- -15.3%
- Active inventory
- 233
- Price-to-rent
- 3.1×
Monthly cashflow live
- Estimated rent
- $8,739 medium interval (Pro) →
- Mortgage (P&I)
- −$1,678
- Tax from tax record
- −$585 /mo · $7,017/yr
- Insurance
- −$133
- HOA
- −$42
- Vacancy / Maint / Mgmt
- −$1,835
- Net cashflow
- $4,466
Break-even live
UW: 25.0% down · 7.5% · 30yr · 1.5% tax · 5.0% vac · 8.0% maint · 8.0% mgmt
Financing live
Cash to close
- Down payment
- $79,975
- Closing costs
- $9,597
- Reserves months
- —
- Total cash needed
- —
Loan-product check · same deal, 3 products live
Conventional
25% down · 7.5% · 30yr
- Down + closing
- —
- Monthly P&I
- —
- Monthly cashflow
- —
- DSCR
- —
- Eligible?
- —
Personal DTI + credit; lowest rate.
DSCR
20% down · 8.5% · 30yr
- Down + closing
- —
- Monthly P&I
- —
- Monthly cashflow
- —
- DSCR
- —
- Eligible?
- —
No personal income docs; deal must DSCR.
Hard money
10% down · 12.0% · 12mo
- Down + closing
- —
- Monthly P&I
- —
- Monthly cashflow
- —
- DSCR
- —
- Eligible?
- —
Short-term bridge; refi at stabilization.
Rent comps 2 comps
| Address | Beds | Baths | Sqft | Rent | $/sqft | DOM | Units | Dist |
|---|---|---|---|---|---|---|---|---|
| 13342 Pecan Trails Dr Santa Fe, TX | 4.0 | 3.0 | 2150 | $2,700 | $1.26 | 43d | 1 | 0.03mi |
| 4120 Avenue O #10 Santa Fe, TX | 3.0 | 2.0 | 1280 | $74,621 | $58.30 | 43d | 1 | 0.90mi |
HOA detail
- Monthly dues
- $42 · $504/yr
- Likely covers
- watergas
Listing history 40 events
-
2026-06-17pricedays on market $319,900 Active 1 DOM
-
2026-06-16days on market $324,900 Active 36 DOM
-
2026-06-15days on market $324,900 Active 35 DOM
-
2026-06-13days on market $324,900 Active 33 DOM
-
2026-06-09days on market $324,900 Active 29 DOM
-
2026-06-08days on market $324,900 Active 28 DOM
-
2026-06-07days on market $324,900 Active 27 DOM
-
2026-06-04days on market $324,900 Active 24 DOM
-
2026-06-03days on market $324,900 Active 23 DOM
-
2026-06-02days on market $324,900 Active 22 DOM
-
2026-06-01days on market $324,900 Active 21 DOM
-
2026-05-31days on market $324,900 Active 20 DOM
-
2026-05-11$328,000 Active 704-char remark
-
2026-05-09historical
-
2026-04-13price $328,000
-
2026-03-18$328,900 Active
-
2026-03-17historical
-
2026-02-10price $332,000
-
2026-01-19$339,000 Active
-
2025-12-20historical
-
2025-12-15$339,000 Active
-
2024-10-01soldstatus
-
2023-08-14soldstatus
-
2023-08-11soldstatus Sold
-
2023-07-18status Pending
-
2023-07-10status Option Pending
-
2023-07-03price $315,000
-
2023-06-23$320,000 Active
-
2023-06-17historical
-
2023-06-08price $331,000
-
2023-05-31price $339,500
-
2023-05-24$344,000 Active
-
2022-11-02historical
-
2022-10-19status Active
-
2022-10-07status Pending, Continue to Show
-
2022-08-22price $320,000
-
2022-08-06$335,000 Active
-
2021-04-07soldstatus Sold
-
2020-10-29status Pending
-
2020-10-21$264,885 Active
ⓘ Source: listings_history table (triggers on properties + properties_extension) + one-shot
backfill from property_details.listing_events for pre-trigger history.
Tax reassessment forecast TX · Resets to sale price
- Current annual tax
- $7,017 · $585/mo
- Projected year-2 tax
- $7,017 · $585/mo
- Expected delta
- $0/yr ($0/mo · 0.0%)
ⓘ Screening estimate from a state-policy table — verify with the county assessor before closing.
Climate risk First Street
- Flood 1/10 Low FEMA zone X (unshaded) · 0% chance over 30 yrs
- Wildfire 3/10 Moderate
- Heat 10/10 Extreme 7 d/yr ≥109°F today · 26 d/yr by 30 yrs out
- Wind 9/10 Extreme 99% chance of damaging wind over 30 yrs
- Air quality 2/10 Low 1 unhealthy d/yr today · 1 by 30 yrs out
Nearby sold comps map
Loading sold comps map…
Walkable amenities ~0.75 mi
Loading nearby amenities…
Taxation est. · year 1
- Rental income
- $104,864
- − Mortgage interest
- −$17,919
- − Property taxes
- −$7,017
- − Insurance
- −$1,600
- − Repairs & maintenance
- −$8,389
- − Management
- −$8,389
- − HOA
- −$504
- − Depreciation
- −$9,306
- Taxable income
- $51,739
- Est. tax owed @ 24.0%
- −$12,417
- After-tax cash flow
- $41,173/yr
For passive investors: Depreciation is non-cash, so a rental often shows a tax loss while cash-flowing — sheltering income. Rental losses are passive: they offset passive income freely, and up to $25,000/yr can offset ordinary (W-2) income if you actively participate and your MAGI is under $100k (phasing out to $0 by $150k); unused losses carry forward. On sale, claimed depreciation is recaptured at up to 25%, and gains may owe capital-gains tax (a 1031 exchange can defer both). Figures are a year-1 estimate at your 24.0% rate — not tax advice; consult a CPA.
Condition & rehab AI · 1 photo
This 6-year-old home requires moderate repairs and maintenance, particularly to the exterior siding and landscaping, to improve its condition and value.
Repairs flagged
- Major Exterior siding — Weathered and in need of repainting
- Major Landscaping — Overgrown and requires trimming
Value-add opportunities
- Both Paint exterior siding — Enhances curb appeal and value
- Both Trim landscaping — Improves curb appeal and value
- Both Replace worn flooring — Improves living space and value
- Both Paint interior walls/paint — Enhances interior appearance and value
Renovation cost estimate screening
| Repair item | Severity | Est. cost |
|---|---|---|
| Exterior siding · Weathered and in need of repainting | Major | $15,000–50,000 |
| Landscaping · Overgrown and requires trimming | Major | $15,000–50,000 |
| Total estimated repair cost · 2 items | $30,000–100,000 |
Value-add ROI direction
- Both Paint exterior siding — Enhances curb appeal and value ↑
- Both Trim landscaping — Improves curb appeal and value ↑
- Both Replace worn flooring — Improves living space and value ↑
- Both Paint interior walls/paint — Enhances interior appearance and value ↑
ⓘ Cost ranges are severity-bucket heuristics (US national rule-of-thumb). Get contractor quotes + a written scope before underwriting a rehab budget.
Schools (NCES district)
- District
- Santa Fe ISD
- NCES district ID
- 4839270
- Math proficiency
- 38% ▼ -10.00%
- Reading proficiency
- 39% ▼ -2.00%
- Median HH income
- $66,769
- Composite
- 34.86/100
- National rank
- #5091
- State rank
- #385 of 826 in TX
Livability — Santa Fe
- Score
- 67/100
- State rank
- #550
- US rank
- #10637
Category grades
Schools grade is shown separately in the Schools card above.
Census & demographics
- Census place
- Santa Fe, TX
- Population (ZIP)
- 13,938
Population outlook (Galveston County) Hauer SSP2
- Today (2025)
- 390,640 people
- By 2030
- 425,226 · +8.9%
- By 2040
- 493,765 · +26.4%
- By 2050
- 559,698 · +43.3%
- By 2075
- 719,260 · +84.1%
- By 2100
- 819,628 · +109.8%
Race, ethnicity, and origin ACS 2023
- Neighborhood character
- Predominantly White (72%)
- Race & ethnicity
- White 72% Hispanic / Latino 21% Two or more races 17% Asian 2%
- Hispanic origin (detail)
- Mexican 14% Puerto Rican 3% Cuban 1%
- Common ancestry
- Lithuanian 4% Italian 3% Slovak 1%
- Foreign-born
- 5% · Canada
- Languages at home
- 89% English-only · Spanish 10% Tagalog/Filipino 1%
Political lean MEDSL · Galveston
- 2024 margin
- Strong R (+27.4) · D 35.7% · R 63.1% · Other 1.2%
- 2008→2024 swing
- -7.9pp toward R · 2008: -19.5pp · 2024: -27.4pp
- All cycles
- 2024: R+27.4 2020: R+22.6 2016: R+22.6 2012: R+26.9 2008: R+19.5
Not yet ingested
- Civics
- —
Market trends
- HPI YoY
- ▼ -54.15%
- Current HPI
- 299.2228
- Rent YoY
- —
- Metro
- —
- State GDP YoY
- ▲ 3.95%
- F500 in state
- 110
Industry mix (Fortune 500 HQ in TX)
| Industry | F500 HQs | Revenue |
|---|---|---|
| Energy | 16 | $1,198B |
|
||
| Technology | 5 | $198B |
|
||
| Engineering / Construction | 4 | $72B |
|
||
| Energy Services | 3 | $60B |
|
||
| Utilities | 3 | $41B |
|
||
| Healthcare | 2 | $330B |
|
||
Price history
+20.8% since first listed31 events — show timeline
- 2026-06-17 Listed $319,900 HARMLS
- 2026-06-16 Listing Removed — HARMLS
- 2026-05-27 Price Changed $324,900 HARMLS
- 2026-05-11 Listed $328,000 HARMLS
- 2026-05-09 Listing Removed — HARMLS
- 2026-04-13 Price Changed $328,000 HARMLS
- 2026-03-18 Listed $328,900 HARMLS
- 2026-03-17 Listing Removed — HARMLS
- 2026-02-10 Price Changed $332,000 HARMLS
- 2026-01-19 Listed $339,000 HARMLS
- 2025-12-20 Listing Removed — HARMLS
- 2025-12-15 Listed $339,000 HARMLS
- 2024-10-01 Sold (Public Records) — Public Records
- 2023-08-14 Sold (Public Records) — Public Records
- 2023-08-11 Sold (MLS) — HARMLS
- 2023-07-18 Pending — HARMLS
- 2023-07-10 Pending — HARMLS
- 2023-07-03 Price Changed $315,000 HARMLS
- 2023-06-23 Listed $320,000 HARMLS
- 2023-06-17 Listing Removed — HARMLS
- 2023-06-08 Price Changed $331,000 HARMLS
- 2023-05-31 Price Changed $339,500 HARMLS
- 2023-05-24 Listed $344,000 HARMLS
- 2022-11-02 Listing Removed — HARMLS
- 2022-10-19 Relisted — HARMLS
- 2022-10-07 Pending — HARMLS
- 2022-08-22 Price Changed $320,000 HARMLS
- 2022-08-06 Listed $335,000 HARMLS
- 2021-04-07 Sold (MLS) — HARMLS
- 2020-10-29 Pending — HARMLS
- 2020-10-21 Listed $264,885 HARMLS
Property tax history
+39.0%/yrLatest (2025): $7,017 · -8.0% YoY. Source: county tax records.
Cash-flow waterfall
monthlySold comps — $/sqft
last 12 mo · ≤1 miLoading sold comps…