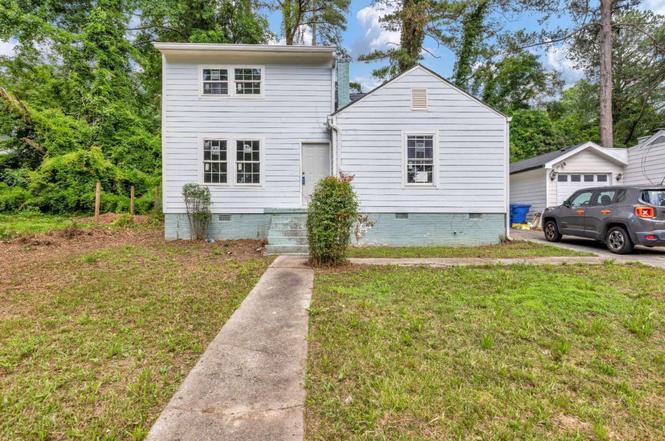
1220 Graymont Dr SW · Atlanta, GA
Flood risk 1/10 · Minimal
- FEMA flood zone
- X (unshaded)
- Chance of flooding over 30 yrs
- 0.0%
- Est. flood insurance / yr
- $473 – $860
Fire risk 1/10 · Minimal
- Est. fire insurance / yr
- $963 – $1,789
Heat risk 5/10 · Moderate
- Hot days now (above 104°F)
- 7 days/yr
- Hot days in 30 yrs
- 17 days/yr
Wind risk 6/10 · Moderate
- Chance of severe wind over 30 yrs
- 27.0%
Air-quality risk 4/10 · Minor
- Unhealthy air days now
- 4 days/yr
- Unhealthy air days in 30 yrs
- 6 days/yr
Risk factors via First Street. Map © Google.
Why this score? — see what drove the B grade
The composite is a weighted blend of 9 inputs, each scored 0–100. Each bar is that input's sub-score; the figure is the points it added to the 100-point composite (weight × sub-score).
- Cash flow +28.2/30.0
- ARV discount +11.5/15.0
- DSCR +10.0/10.0
- 1% rule +8.3/10.0
- Livability +4.2/5.0
- Rent growth +3.2/5.0
- Schools +2.7/10.0
- Condition / age +2.5/5.0
- Appreciation +0.0/10.0
$149,900
🖨 Deal sheet 📄 Offer letter ✓ Due diligence
Listing remarks MLS
Opportunity awaits at this partially completed renovation in Southwest Atlanta. Originally a bungalow, this property has undergone significant improvements and expansion, creating an exciting opportunity for an investor, builder, or savvy buyer looking to complete the project and make it their own. The property offers the potential for significantly more living space than its original footprint, providing a blank canvas for your design vision and finishing touches. The existing layout features a fireplace, spacious living areas, and what appears to be a future upper-level suite, creating the opportunity for a truly unique finished product. Whether you're looking for your next renovation project, a resale opportunity, or a chance to create your own custom home, this property offers tremendous upside for the right buyer. Sold As-Is. Buyer to verify square footage, permits, and all property details.
Key facts
- Blank canvas
- 5,998 sq ft lot
- Built 1950
Tags
Property features AI
Finance
- HOA & community: Community features: Other
Exterior
- Parking: Driveway with open parking
- Utilities: Public water; Public sewer
- Home design: Two levels; Wood siding construction; Composition roof; Foundation: See remarks
- Construction: Wood siding; Composition roof
- Exterior features: Private entrance; Private yard; Back yard privacy fence; Deck and patio; Asphalt road frontage on a city street
Interior
- Kitchen: Kitchen features: Other; Dining room features: Other
- Bedrooms: Three upstairs bedrooms; Bedroom features: Other
- Bathrooms: Two full bathrooms; One half bathroom (main level)
- Heating & cooling: Heating: Other; Cooling: Other
- Interior features: One fireplace with brick surround in the living room; No common walls; Resale condition
- Laundry & utility: Laundry features: Other
Neighborhood map
What this means for you Summary
Snapshot
- This is a 3-bed/2.0-bath single-family listed at $150k.
Deal economics
- At list price, monthly cash flow is $477 ($6k/yr) — positive.
- The deal already cash-flows at list — no discount required.
- Meets the 1% rule at list price ($2k rent vs $150k).
- Cap rate 10.1% vs local median 3.1% in Atlanta — top-decile yield for the area; either an underpriced asset or a hidden risk that comps aren't pricing in. Stress-test before assuming the spread holds.
Location & tenants
- Location reads 83/100 on livability (#6 in GA, #919 nationally) — a professional / high-income tenant draw. Strengths: amenities A+, commute A+, housing A+; Watch: cost of living C-.
- Atlanta Public Schools (urban): math 28% / reading 35% proficiency, ranked #80 of 174 in GA (top 46%) — families likely to look elsewhere, expect single-tenant / working-renter base with shorter leases; 71% free/reduced lunch — lower-income household profile, screen leases tightly.
- Zoned schools: Finch Elementary (math 2% / reading 2%, grade F, #1,204 of 1,228 statewide, top 100%, 339 students, 100% FRL); Sylvan Hills Middle School (math 5% / reading 12%, grade F, #439 of 470 statewide, top 94%, 445 students, 100% FRL) — zoned schools average 100% FRL vs 71% district-wide (29 pts higher); higher-poverty schools than district average — tighter screening recommended.
- Zoned-school proficiency averages 6% at this address vs 32% district-wide (-26 pts) — the specific schools serving this property underperform the Atlanta Public Schools average; the district grade overstates school quality for this exact location.
- Market conditions: Rents rising (+2.8%/yr); 452 active listings in the ZIP; 40 comparable units currently listed for rent nearby; rentals at typical pace (median 24d on market — plan ~3-4 weeks tenant-placement turnaround); 11,565 units permitted in Fulton County in 2024 (8,159 in 5+ unit buildings).
Forward outlook
- Local home prices are declining (-3.0%/yr); year-one equity from $1k of loan paydown is wiped out by about $4k of value loss. Plan a longer hold.
- Fulton County population projected at +38% by 2050 — long-run rental-demand tailwind backs the buy-and-hold thesis.
- At projected returns (-3.0% appreciation + 2.8% rent growth), your $42k cash investment doubles in ~9 years — after that, you're playing with house money.
Negotiation context
- Only 3 days on market — expect competitive offers; lowballing is unlikely to land.
- 13 sale attempts since 19y ago with the ask held roughly flat each time — persistent listings suggest the price (not the market) is what's stuck; bring a comps-based counter.
- Current owner paid $55k; list at $150k implies a 173% gain — meaningful room to come down on a strong offer.
Risks & watch-outs
- Watch-outs: built in 1950 — expect roof / HVAC / electrical / plumbing capex.
- Climate carrying-cost: major wind risk, 27% chance of damaging wind over 30y; extreme-heat days projected 7→17/yr by 2055 (HVAC capex compounding) — expect insurance premiums to compound above CPI over the hold.
Questions for the listing agent
- Built in 1950 — when were the roof, HVAC, electrical panel, plumbing, and water heater last replaced?
- Is there a deadline driving the sale (1031 exchange, divorce, estate, relocation)? That informs how much negotiation room exists.
- What's the average days-on-market for RENTAL listings here right now (not sales)? A rising rental-DOM trend means longer vacancies and softer asking-rent achievability than the comps imply.
- What's the recent tenant-quality profile in this submarket — average credit score on applications, eviction rate, late-payment / NSF rate, and stable-employment percentage? A property-management company in the area should have these aggregated.
- How much new for-sale + rental construction is in the pipeline within 1–3 miles? Heavy new supply typically softens prices + rents 12–24 months out; constrained supply supports both.
Investment metrics
- 1% rule
- 1.33% ✓
- Cap rate
- 10.11%
- Cash-on-cash
- 13.64%
- DSCR
- 1.61
- GRM
- 6.3
CMA / ARV
- ARV (on-the-fly)
- $164,536
- Comps found
- 12
Show comp detail 12 sales within ~0.75 mi
| Address | Dist | Beds/Ba | Sqft | Sold | Price | $/sf | Match |
|---|---|---|---|---|---|---|---|
| 1328 Lorenzo Dr SW | 0.31mi | 3/2.0 | 1,070 (+2%) | 4mo | $155,000 | $145 | 78 |
| 1239 Kenilworth Dr SW | 0.11mi | 2/1.0 (-1) | 1,008 (-4%) | 6mo | $100,000 | $99 | 74 |
| 1390 Almont Dr SW | 0.31mi | 3/2.5 | 1,114 (+6%) | 1mo | $340,000 | $305 | 72 |
| 1228 Elizabeth Ave SW | 0.06mi | 3/1.0 | 1,176 (+12%) | 2mo | $184,500 | $157 | 71 |
| 1535 Pineview Ter SW | 0.48mi | 3/1.0 | 1,036 (-1%) | 2mo | $141,000 | $136 | 70 |
| 1100 Edgefield Dr SW | 0.44mi | 3/1.0 | 1,011 (-4%) | 2mo | $125,000 | $124 | 68 |
| 1417 Elizabeth Ave | 0.44mi | 2/2.0 (-1) | 950 (-9%) | 0mo | $200,000 | $211 | 59 |
| 1459 Kenilworth Dr SW | 0.47mi | 3/2.0 | 1,155 (+10%) | 6mo | $255,000 | $221 | 56 |
| 1675 Avon Ave SW | 0.37mi | 4/3.0 (+1) | 1,156 (+10%) | 3mo | $353,000 | $305 | 54 |
| 1126 Indale Pl SW | 0.48mi | 3/1.0 | 1,136 (+8%) | 7mo | $162,000 | $143 | 54 |
| 1391 Elizabeth Ave SW | 0.39mi | 2/1.0 (-1) | 933 (-11%) | 6mo | $180,000 | $193 | 50 |
| 1356 Campbellton Rd SW | 0.52mi | 2/1.0 (-1) | 1,200 (+14%) | 5mo | $70,000 | $58 | 38 |
Match score weights: distance 35% · size 25% · config 20% · recency 20%. Top-matched comps best support the ARV.
Projected returns pro-forma
-3.0% appreciation · 2.77% rent growth · sell at horizon
- IRR
- 3.5%
- Equity multiple
- 1.14×
- Total profit
- $5,707
- Equity at exit
- $22,351
- IRR
- 12.9%
- Equity multiple
- 2.01×
- Total profit
- $42,491
- Equity at exit
- $12,961
Cash invested: $41,972 (down + closing). Projections, not guarantees.
Landlord ↔ Tenant lean methodology
- Overall (STATE)
- 90 Strongly Landlord-Friendly
- State Georgia
- 90 Strongly Landlord-Friendly · R+3
- County
- — inherits STATE
- City
- — inherits STATE
ZIP-level market 30310
- Home prices YoY
- -32.8%
- Rents YoY
- 2.8%
- Active inventory
- 452
- Price-to-rent
- 6.3×
Monthly cashflow live
- Estimated rent
- $1,987 high interval (Pro) →
- Mortgage (P&I)
- −$786
- Tax from tax record
- −$244 /mo · $2,924/yr
- Insurance
- −$62
- HOA
- −$0
- Vacancy / Maint / Mgmt
- −$417
- Net cashflow
- $477
Break-even live
UW: 25.0% down · 7.5% · 30yr · 1.5% tax · 5.0% vac · 8.0% maint · 8.0% mgmt
Financing live
Cash to close
- Down payment
- $37,475
- Closing costs
- $4,497
- Reserves months
- —
- Total cash needed
- —
Loan-product check · same deal, 3 products live
Conventional
25% down · 7.5% · 30yr
- Down + closing
- —
- Monthly P&I
- —
- Monthly cashflow
- —
- DSCR
- —
- Eligible?
- —
Personal DTI + credit; lowest rate.
DSCR
20% down · 8.5% · 30yr
- Down + closing
- —
- Monthly P&I
- —
- Monthly cashflow
- —
- DSCR
- —
- Eligible?
- —
No personal income docs; deal must DSCR.
Hard money
10% down · 12.0% · 12mo
- Down + closing
- —
- Monthly P&I
- —
- Monthly cashflow
- —
- DSCR
- —
- Eligible?
- —
Short-term bridge; refi at stabilization.
Rent comps 40 comps
| Address | Beds | Baths | Sqft | Rent | $/sqft | DOM | Units | Dist |
|---|---|---|---|---|---|---|---|---|
| 1246 Westmont Rd SW Atlanta, GA | 3.0 | 1.0 | 1200 | $1,500 | $1.25 | 3d | 1 | 0.09mi |
| 1449 Lynford Dr SW Atlanta, GA | 3.0 | 1.0 | 1242 | $1,895 | $1.53 | 18d | 1 | 0.11mi |
| 1449 Lynford Dr SW Atlanta, GA | 3.0 | 1.0 | 1242 | $1,895 | $1.53 | 24d | 1 | 0.11mi |
| 1255 Westmont Rd SW Atlanta, GA | 3.0 | 2.0 | 1500 | $1,695 | $1.13 | 24d | 1 | 0.13mi |
| 1280 Elizabeth Ave SW Atlanta, GA | 3.0 | 1.0 | 1105 | $1,950 | $1.76 | 24d | 1 | 0.14mi |
| 1537 Orlando St SW Atlanta, GA | 2.0 | 1.0 | 1068 | $1,700 | $1.59 | 24d | 1 | 0.15mi |
| 1262 Kenilworth Dr SW Atlanta, GA | 4.0 | 2.0 | 1400 | $2,400 | $1.71 | 24d | 1 | 0.15mi |
| 1295 Westmont Rd SW Atlanta, GA | 2.0 | 1.0 | 910 | $1,500 | $1.65 | 24d | 1 | 0.18mi |
| 1280 Kenilworth Dr SW Atlanta, GA | 3.0 | 2.0 | 1000 | $1,800 | $1.80 | 24d | 1 | 0.18mi |
| 1310 Kenilworth Dr SW Atlanta, GA | 3.0 | 2.0 | 1192 | $2,000 | $1.68 | 24d | 1 | 0.22mi |
| 1389 Lanvale Dr SW Atlanta, GA | 3.0 | 2.0 | 1430 | $2,500 | $1.75 | 7d | 1 | 0.22mi |
| 1262 Lorenzo Dr SW Atlanta, GA | 4.0 | 2.0 | 1292 | $2,100 | $1.63 | 24d | 1 | 0.23mi |
| 1291 Lorenzo Dr SW Unit 1 Atlanta, GA | 3.0 | 1.0 | 1100 | $1,825 | $1.66 | 15d | 1 | 0.24mi |
| 1307 Lorenzo Dr SW Unit A Atlanta, GA | 3.0 | 2.0 | 1300 | $1,795 | $1.38 | 24d | 1 | 0.26mi |
| 1080 Westmont Rd SW Atlanta, GA | 3.0 | 2.0 | 1022 | $2,500 | $2.45 | 15d | 1 | 0.27mi |
| 1346 Lorenzo Dr SW Atlanta, GA | 3.0 | 2.0 | 1486 | $5,000 | $3.36 | 24d | 1 | 0.33mi |
| 1300 Wichita Dr SW Atlanta, GA | 3.0 | 2.0 | 1077 | $2,200 | $2.04 | 24d | 1 | 0.35mi |
| 1361 Byrere Ter SW Unit 2 Atlanta, GA | 2.0 | 1.0 | 836 | $1,299 | $1.55 | 24d | 1 | 0.37mi |
| 1404 Lockwood Dr SW Atlanta, GA | 2.0 | 2.0 | 980 | $1,700 | $1.73 | 7d | 1 | 0.38mi |
| 1408 Lockwood Dr SW Atlanta, GA | 3.0 | 2.0 | 1300 | $1,950 | $1.50 | 24d | 1 | 0.39mi |
| 1346 Wichita Dr SW Atlanta, GA | 3.0 | 2.0 | 1183 | $2,125 | $1.80 | 7d | 1 | 0.39mi |
| 1550 Mayflower Ave SW Atlanta, GA | 4.0 | 2.5 | 1396 | $6,500 | $4.66 | 20d | 1 | 0.41mi |
| 1427 Lorenzo Dr SW Atlanta, GA | 3.0 | 2.0 | 1128 | $1,995 | $1.77 | 24d | 1 | 0.45mi |
| 1250 Byewood Ln SW Atlanta, GA | 2.0 | 2.0 | 1100 | $2,150 | $1.95 | 24d | 1 | 0.46mi |
| 966 Gaston St SW Atlanta, GA | 3.0 | 2.5 | 1331 | $2,250 | $1.69 | 24d | 1 | 0.47mi |
| 1226 Byewood Ln SW Unit B Atlanta, GA | 2.0 | 2.0 | 831 | $1,950 | $2.35 | 24d | 1 | 0.50mi |
| 1443 Venetian Dr SW Atlanta, GA | 3.0 | 1.0 | 1139 | $1,395 | $1.22 | 24d | 1 | 0.50mi |
| 1255 Campbellton Rd SW Atlanta, GA | 3.0 | 2.0 | 1305 | $2,095 | $1.61 | 24d | 1 | 0.52mi |
| 1448 Westboro Dr SW Atlanta, GA | 3.0 | 2.0 | 1437 | $2,300 | $1.60 | 7d | 1 | 0.68mi |
| 1084 Cordova St SW Atlanta, GA | 2.0 | 1.0 | 750 | $1,295 | $1.73 | 18d | 1 | 0.72mi |
| 1474 Beecher St SW Atlanta, GA | 3.0 | 2.0 | 1332 | $3,200 | $2.40 | 24d | 1 | 0.77mi |
| 1848 Cummings Dr SW Atlanta, GA | 4.0 | 1.0 | 1216 | $1,795 | $1.48 | 24d | 1 | 0.79mi |
| 1180 Richland Rd SW Atlanta, GA | 3.0 | 2.0 | 1082 | $2,800 | $2.59 | 24d | 1 | 0.80mi |
| 1876 Sandtown Rd SW Atlanta, GA | 3.0 | 2.0 | 1230 | $2,500 | $2.03 | 24d | 1 | 0.81mi |
| 973 Lawton St SW Atlanta, GA | 3.0 | 1.0 | 912 | $1,575 | $1.73 | 7d | 1 | 0.84mi |
| 1578 Linda Way SW Atlanta, GA | 3.0 | 2.0 | 1343 | $2,030 | $1.51 | 14d | 1 | 0.86mi |
| 763 Cascade Ave SW Atlanta, GA | 2.0 | 1.0 | 900 | $1,249 | $1.39 | 2d | 5 | 0.88mi |
| 1587 Olympian Cir SW Unit B Atlanta, GA | 2.0 | 1.0 | 1086 | $1,300 | $1.20 | 24d | 1 | 0.96mi |
| 969 Arden Ave SW Atlanta, GA | 4.0 | 2.0 | 1380 | $1,850 | $1.34 | 24d | 1 | 0.98mi |
| 1735 Alvarado Ter SW Atlanta, GA | 3.0 | 2.0 | 1235 | $1,595 | $1.29 | 22d | 1 | 1.00mi |
Listing history 4 events
-
2026-06-18days on market $149,900 Active 3 DOM
-
2026-06-17days on market $149,900 Active 2 DOM
-
2026-06-15remarks 699-char remark
Show marketing remark (921 chars)
Opportunity awaits at this partially completed renovation in Southwest Atlanta. Originally a bungalow, this property has undergone significant improvements and expansion, creating an exciting opportunity for an investor, builder, or savvy buyer looking to complete the project and make it their own. The property offers the potential for significantly more living space than its original footprint, providing a blank canvas for your design vision and finishing touches. The existing layout features a fireplace, spacious living areas, and what appears to be a future upper-level suite, creating the opportunity for a truly unique finished product. Whether you're looking for your next renovation project, a resale opportunity, or a chance to create your own custom home, this property offers tremendous upside for the right buyer. Sold As-Is. Buyer to verify square footage, permits, and all property details.
-
2026-06-15$149,900 Active 1 DOM
Show marketing remark (921 chars)
Opportunity awaits at this partially completed renovation in Southwest Atlanta. Originally a bungalow, this property has undergone significant improvements and expansion, creating an exciting opportunity for an investor, builder, or savvy buyer looking to complete the project and make it their own. The property offers the potential for significantly more living space than its original footprint, providing a blank canvas for your design vision and finishing touches. The existing layout features a fireplace, spacious living areas, and what appears to be a future upper-level suite, creating the opportunity for a truly unique finished product. Whether you're looking for your next renovation project, a resale opportunity, or a chance to create your own custom home, this property offers tremendous upside for the right buyer. Sold As-Is. Buyer to verify square footage, permits, and all property details.
ⓘ Source: listings_history table (triggers on properties + properties_extension) + one-shot
backfill from property_details.listing_events for pre-trigger history.
Tax reassessment forecast GA · Resets to sale price
- Current annual tax
- $2,924 · $244/mo
- Projected year-2 tax
- $2,924 · $244/mo
- Expected delta
- $0/yr ($0/mo · 0.0%)
ⓘ Screening estimate from a state-policy table — verify with the county assessor before closing.
Climate risk First Street
- Flood 1/10 Low FEMA zone X (unshaded) · 0% chance over 30 yrs
- Wildfire 1/10 Low
- Heat 5/10 Major 7 d/yr ≥104°F today · 17 d/yr by 30 yrs out
- Wind 6/10 Major 27% chance of damaging wind over 30 yrs
- Air quality 4/10 Moderate 4 unhealthy d/yr today · 6 by 30 yrs out
Nearby sold comps map
Loading sold comps map…
Walkable amenities ~0.75 mi
Loading nearby amenities…
Taxation est. · year 1
- Rental income
- $23,839
- − Mortgage interest
- −$8,397
- − Property taxes
- −$2,924
- − Insurance
- −$750
- − Repairs & maintenance
- −$1,907
- − Management
- −$1,907
- − Depreciation
- −$4,361
- Taxable income
- $3,594
- Est. tax owed @ 24.0%
- −$862
- After-tax cash flow
- $4,864/yr
For passive investors: Depreciation is non-cash, so a rental often shows a tax loss while cash-flowing — sheltering income. Rental losses are passive: they offset passive income freely, and up to $25,000/yr can offset ordinary (W-2) income if you actively participate and your MAGI is under $100k (phasing out to $0 by $150k); unused losses carry forward. On sale, claimed depreciation is recaptured at up to 25%, and gains may owe capital-gains tax (a 1031 exchange can defer both). Figures are a year-1 estimate at your 24.0% rate — not tax advice; consult a CPA.
Schools (NCES district)
- District
- Atlanta Public Schools
- NCES district ID
- 1300120
- Math proficiency
- 28% ▼ -6.00%
- Reading proficiency
- 35% ▼ -2.00%
- Median HH income
- $48,306
- Composite
- 27.27/100
- National rank
- #7006
- State rank
- #80 of 174 in GA
Livability — Atlanta
- Score
- 83/100
- State rank
- #6
- US rank
- #919
Category grades
Schools grade is shown separately in the Schools card above.
Census & demographics
- Census place
- Atlanta, GA
- County
- Fulton County · 1,094,430 people
- City population
- 629,525
- Metro
- Atlanta-Sandy Springs-Alpharetta, GA
- Population (ZIP)
- 27,186
- Household income
- $53,037
- Rent vs Own
- Severe rent burden
- 1676.0
Population outlook (Fulton County) Hauer SSP2
- Today (2025)
- 1,203,707 people
- By 2030
- 1,299,706 · +8.0%
- By 2040
- 1,488,256 · +23.6%
- By 2050
- 1,664,580 · +38.3%
- By 2075
- 2,036,072 · +69.2%
- By 2100
- 2,222,402 · +84.6%
Race, ethnicity, and origin ACS 2023
- Neighborhood character
- Predominantly Black (76%)
- Race & ethnicity
- Black 76% White 14% Two or more races 4% Hispanic / Latino 4% Asian 2%
- Common ancestry
- Lithuanian 1% Slovak 1% Serbian 0%
- Foreign-born
- 5% · Canada, South Korea, Vietnam
- Languages at home
- 92% English-only · Spanish 4% French/Haitian/Cajun 1% Other Indo-European 1%
Political lean MEDSL · Fulton
- 2024 margin
- Solid D (+44.9) · D 71.9% · R 27.0% · Other 1.1%
- 2008→2024 swing
- +9.8pp toward D · 2008: 35.0pp · 2024: 44.9pp
- All cycles
- 2024: D+44.9 2020: D+46.4 2016: D+42.1 2012: D+29.6 2008: D+35.0
Not yet ingested
- Civics
- —
Market trends
- HPI YoY
- ▼ -204.00%
- Current HPI
- 418.7297
- Rent YoY
- ▲ 2.77%
- Metro
- Atlanta-Sandy Springs-Alpharetta, GA
- State GDP YoY
- ▲ 2.66%
- F500 in state
- 28
Industry mix (Fortune 500 HQ in GA)
| Industry | F500 HQs | Revenue |
|---|---|---|
| Paper / Packaging | 2 | $29B |
|
||
| Retail | 1 | $160B |
|
||
| Transportation / Logistics | 1 | $91B |
|
||
| Airlines | 1 | $62B |
|
||
| Consumer Goods | 1 | $47B |
|
||
| Utilities | 1 | $25B |
|
||
Price history
+242.2% since first listed43 events — show timeline
- 2026-06-15 Listed $149,900 FMLS
- 2026-06-15 Listed $149,900 GAMLS
- 2017-06-12 Sold (Public Records) $55,000 Public Records
- 2017-06-09 Sold (MLS) $55,000 GAMLS
- 2017-06-09 Sold (MLS) $55,000 FMLS
- 2017-05-25 Pending — GAMLS
- 2017-05-25 Contingent — FMLS
- 2017-05-24 Relisted — GAMLS
- 2017-05-24 Relisted — FMLS
- 2017-05-18 Contingent — FMLS
- 2017-05-18 Pending — GAMLS
- 2017-05-18 Listed $50,000 FMLS
- 2017-05-18 Listed $50,000 GAMLS
- 2017-02-16 Listing Removed — GAMLS
- 2017-01-10 Price Changed $45,000 GAMLS
- 2017-01-09 Relisted — GAMLS
- 2017-01-06 Listing Removed — GAMLS
- 2016-10-14 Price Changed $37,500 GAMLS
- 2016-10-05 Listed $40,000 GAMLS
- 2016-04-27 Sold (Public Records) $15,000 Public Records
- 2016-04-20 Price Changed $15,000 GAMLS
- 2016-04-02 Pending — GAMLS
- 2016-03-31 Sold (MLS) $15,000 GAMLS
- 2016-03-28 Price Changed $17,000 GAMLS
- 2016-02-14 Listed $17,000 GAMLS
- 2016-02-10 Price Changed $1,600 FMLS
- 2015-06-04 Price Changed $2,750 FMLS
- 2014-09-27 Price Changed $1,600 GAMLS
- 2014-04-15 Listing Removed — FMLS
- 2014-03-19 Sold (MLS) $2,750 FMLS
- 2014-03-14 Sold (MLS) $2,750 GAMLS
- 2014-02-14 Pending — FMLS
- 2014-01-26 Relisted — FMLS
- 2013-11-26 Pending — GAMLS
- 2013-11-26 Pending — FMLS
- 2013-11-26 Price Changed $2,750 GAMLS
- 2013-11-22 Listed $1,600 GAMLS
- 2013-11-22 Listed $1,600 FMLS
- 2008-02-22 Sold (MLS) $35,000 FMLS
- 2007-11-19 Listed $39,900 FMLS
- 1995-10-13 Sold (Public Records) $52,500 Public Records
- 1995-09-12 Sold (Public Records) $37,500 Public Records
- 1992-07-13 Sold (Public Records) $43,800 Public Records
Property tax history
+5.4%/yrLatest (2025): $2,924 · -0.0% YoY. Source: county tax records.
Cash-flow waterfall
monthlySold comps — $/sqft
last 12 mo · ≤1 miLoading sold comps…