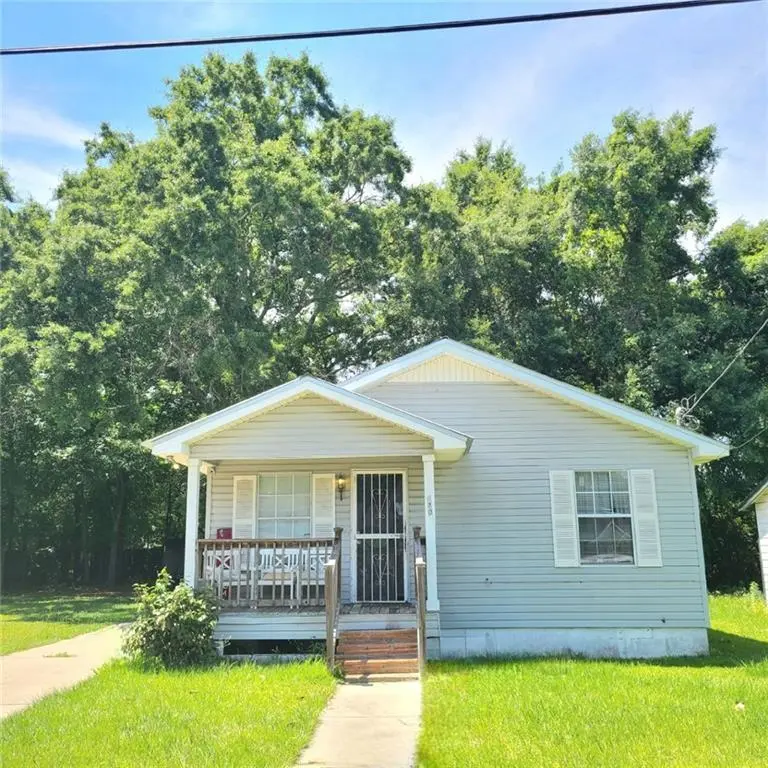
220 Sinclair Ave · Prichard, AL
Flood risk 1/10 · Minimal
- FEMA flood zone
- X (unshaded)
- Chance of flooding over 30 yrs
- 0.0%
- Est. flood insurance / yr
- $507 – $1,088
Fire risk 1/10 · Minimal
- Est. fire insurance / yr
- $916 – $1,700
Heat risk 9/10 · Severe
- Hot days now (above 104°F)
- 7 days/yr
- Hot days in 30 yrs
- 21 days/yr
Wind risk 9/10 · Severe
- Chance of severe wind over 30 yrs
- 99.0%
Air-quality risk 2/10 · Minimal
- Unhealthy air days now
- 1 days/yr
- Unhealthy air days in 30 yrs
- 1 days/yr
Risk factors via First Street. Map © Google.
Why this score? — see what drove the C- grade
The composite is a weighted blend of 9 inputs, each scored 0–100. Each bar is that input's sub-score; the figure is the points it added to the 100-point composite (weight × sub-score).
- Cash flow +19.5/30.0
- ARV discount +7.5/15.0
- DSCR +6.2/10.0
- Appreciation +5.2/10.0
- 1% rule +3.9/10.0
- Livability +2.7/5.0
- Rent growth +2.5/5.0
- Condition / age +2.5/5.0
- Schools +2.3/10.0
$140,160
🖨 Deal sheet (PDF) 📄 Offer letter ✓ Due diligence
Listing remarks
4 BEDROOMS! Excellent family home MOVE-IN READY! LARGE LIVING ROOM! HUGE KITCHEN has eat-in area and appliances remain. Generous sized bedrooms. Master bedroom has a walk-in closet and half bath attached. Easy to clean flooring. Separate laundry room. NEW water heater. Metal Roof 3 years young. Covered front porch. Extra-long concrete driveway for multiple vehicles. Empty lot next door. Situated near Interstate 65 and 165 for a quick commute to Downtown Mobile! Great starter home, rental for investor, or AirBnb. A MUST SEE IN THIS PRICE RANGE! VRM: Seller entertaining offers between $140,000-$160,000.
Key facts
- Move-in ready
- Covered front porch
- Metal roof
Tags
Property features AI
Exterior
- Parking: Driveway; Level driveway
- Utilities: Electricity available; Natural gas available; Public sewer; Water available
- Home design: Single family residence; Residential property
- Construction: Vinyl siding; Metal roof; Concrete perimeter foundation
- Exterior features: Awnings; Back yard fencing; View available
Interior
- Kitchen: Eat-in kitchen; Electric oven; Electric range; Refrigerator
- Bedrooms: 4 bedrooms
- Flooring: Ceramic tile; Vinyl
- Bathrooms: 1 full bathroom; 1 half bathroom
- Heating & cooling: Central heating; Central air conditioning
- Interior features: Walk-in closets; Additional/other interior features
- Laundry & utility: Gas water heater
Neighborhood map
What this means for you Summary
Snapshot
- This is a 4-bed/1.5-bath single-family listed at $140k.
Deal economics
- At list price, monthly cash flow is $158 ($2k/yr) — positive.
- The deal already cash-flows at list — no discount required.
- To meet the 1% rule (rent ≥ 1% of price), the offer needs to be $125k (10.9% below list).
- Recommended offer: $125k (10.9% below list) — sets the bar for 1% rule.
- Cap rate 7.6% vs local median 11.4% in Prichard — below-typical yield; the buyer is paying a premium for something (appreciation thesis, condition, location) that the cap rate doesn't capture.
Location & tenants
- Location reads 54/100 on livability (#472 in AL) — a working-class tenant base; expect higher turnover. Strengths: cost of living A+, housing A; Watch: schools D-, crime F, amenities F.
- Mobile County (urban): math 15% / reading 39% proficiency, ranked #81 of 129 in AL (top 63%) — low school quality limits family demand, transient renter base, plan for 1-2y turnover; 67% free/reduced lunch — lower-income household profile, screen leases tightly.
- Market conditions: 41 active listings in the ZIP; 2 comparable units currently listed for rent nearby; 1,678 units permitted in Mobile County in 2024 (264 in 5+ unit buildings).
Forward outlook
- In year one you build about $1k of equity ($969 loan paydown + $522 appreciation (0.4% local appreciation)).
- Mobile County population projected to shrink 8% by 2050 — rents likely to lag national; underwrite the cash flow, not the appreciation.
- At projected returns (0.4% appreciation + 3.0% rent growth), your $39k cash investment doubles in ~8 years — after that, you're playing with house money.
Negotiation context
- It's been on market 29 days — a 2% lower offer ($138k) is reasonable based on typical stale-listing flexibility.
Risks & watch-outs
- Climate carrying-cost: severe wind risk, 99% chance of damaging wind over 30y; extreme-heat days projected 7→21/yr by 2055 (HVAC capex compounding) — expect insurance premiums to compound above CPI over the hold.
Questions for the listing agent
- Is there a deadline driving the sale (1031 exchange, divorce, estate, relocation)? That informs how much negotiation room exists.
- Schools are D-rated, which usually means shorter tenancies and higher turnover. Who's the typical renter profile here, and what's been the actual vacancy rate?
- Crime grade is F in this area — have there been break-ins, vandalism, or insurance claims at this property in the last 3 years? What carrier currently insures it and at what premium?
- What's the average days-on-market for RENTAL listings here right now (not sales)? A rising rental-DOM trend means longer vacancies and softer asking-rent achievability than the comps imply.
- What's the recent tenant-quality profile in this submarket — average credit score on applications, eviction rate, late-payment / NSF rate, and stable-employment percentage? A property-management company in the area should have these aggregated.
- How much new for-sale + rental construction is in the pipeline within 1–3 miles? Heavy new supply typically softens prices + rents 12–24 months out; constrained supply supports both.
Investment metrics
- 1% rule
- 0.89% ✗
- Cap rate
- 7.65%
- Cash-on-cash
- 4.83%
- DSCR
- 1.22
- GRM
- 9.4
CMA / ARV
- ARV (on-the-fly)
- $43,316
- Comps found
- 11
Show comp detail 11 sales within ~0.75 mi
| Address | Dist | Beds/Ba | Sqft | Sold | Price | $/sf | Match |
|---|---|---|---|---|---|---|---|
| 407 Garrison Ave | 0.14mi | 3/2.0 (-1) | 1,222 (-4%) | 1mo | $50,000 | $41 | 78 |
| 614 Gehrig Ave | 0.57mi | 3/2.0 (-1) | 1,263 (-1%) | 5mo | $42,400 | $34 | 61 |
| 1700 Dade St | 0.44mi | 3/1.0 (-1) | 1,245 (-2%) | 10mo | $19,000 | $15 | 60 |
| 1603 Ace St | 0.36mi | 4/2.0 | 1,175 (-8%) | 12mo | $40,000 | $34 | 58 |
| 643 Gehrig Ave | 0.63mi | 3/2.0 (-1) | 1,308 (+3%) | 4mo | $76,000 | $58 | 56 |
| 215 Book Ave | 0.30mi | 4/2.0 | 1,444 (+13%) | 13mo | $40,000 | $28 | 51 |
| 515 Gilbert St | 0.67mi | 3/1.0 (-1) | 1,154 (-9%) | 3mo | $10,000 | $9 | 43 |
| 210 Irby St | 0.63mi | 3/1.0 (-1) | 1,416 (+11%) | 13mo | $73,500 | $52 | 34 |
| 609 Gehrig Ave | 0.56mi | 3/2.0 (-1) | 1,458 (+14%) | 11mo | $59,000 | $40 | 34 |
| 211 Williams Ave S | 0.64mi | 3/2.0 (-1) | 1,392 (+9%) | 23mo | $13,500 | $10 | 28 |
| 720 College St N | 0.70mi | 3/1.0 (-1) | 1,458 (+14%) | 23mo | $28,000 | $19 | 17 |
Match score weights: distance 35% · size 25% · config 20% · recency 20%. Top-matched comps best support the ARV.
Projected returns pro-forma
0.37% appreciation · 3.0% rent growth · sell at horizon
- IRR
- 4.4%
- Equity multiple
- 1.21×
- Total profit
- $8,371
- Equity at exit
- $43,326
- IRR
- 9.3%
- Equity multiple
- 2.05×
- Total profit
- $41,202
- Equity at exit
- $54,226
Cash invested: $39,245 (down + closing). Projections, not guarantees.
Landlord ↔ Tenant lean methodology
- Overall (STATE)
- 90 Strongly Landlord-Friendly
- State Alabama
- 90 Strongly Landlord-Friendly · R+15
- County
- — inherits STATE
- City
- — inherits STATE
ZIP-level market 36610
- Home prices YoY
- 0.9%
- Active inventory
- 41
- Price-to-rent
- 9.4×
Monthly cashflow live
- Estimated rent
- $1,249 medium interval (Pro) →
- Mortgage (P&I)
- −$735
- Tax from tax record
- −$35 /mo · $418/yr
- Insurance
- −$58
- HOA
- −$0
- Vacancy / Maint / Mgmt
- −$262
- Net cashflow
- $158
Break-even live
Sensitivity live
| Price | -10% $237 | -5% $198 | +0% $158 | +5% $118 | +10% $79 |
|---|---|---|---|---|---|
| Rent | -10% $59 | -5% $109 | +0% $158 | +5% $207 | +10% $257 |
| Rate | -1.0pp $229 | -0.5pp $194 | base $158 | +0.5pp $122 | +1.0pp $85 |
UW: 25.0% down · 7.5% · 30yr · 1.5% tax · 5.0% vac · 8.0% maint · 8.0% mgmt
Financing live
Cash to close
- Down payment
- $35,040
- Closing costs
- $4,205
- Reserves months
- —
- Total cash needed
- —
Loan-product check · same deal, 3 products live
Conventional
25% down · 7.5% · 30yr
- Down + closing
- —
- Monthly P&I
- —
- Monthly cashflow
- —
- DSCR
- —
- Eligible?
- —
Personal DTI + credit; lowest rate.
DSCR
20% down · 8.5% · 30yr
- Down + closing
- —
- Monthly P&I
- —
- Monthly cashflow
- —
- DSCR
- —
- Eligible?
- —
No personal income docs; deal must DSCR.
Hard money
10% down · 12.0% · 12mo
- Down + closing
- —
- Monthly P&I
- —
- Monthly cashflow
- —
- DSCR
- —
- Eligible?
- —
Short-term bridge; refi at stabilization.
Rent comps 2 comps
| Address | Beds | Baths | Sqft | Rent | $/sqft | DOM | Units | Dist |
|---|---|---|---|---|---|---|---|---|
| 100 Dairy Rd Mobile, AL | 2.0–3.0 | 2.0 | 999 | $1,100 | $1.10 | 14d | 1 | 1.26mi |
| 1821 Seale St Mobile, AL | 4.0 | 2.0 | 1584 | $1,400 | $0.88 | 21d | 1 | 1.32mi |
Listing history 17 events
-
2026-06-18days on market $140,160 Active 29 DOM
-
2026-06-17days on market $140,160 Active 28 DOM
-
2026-06-16days on market $140,160 Active 27 DOM
-
2026-06-15days on market $140,160 Active 26 DOM
-
2026-06-14days on market $140,160 Active 24 DOM
-
2026-06-13days on market $140,160 Active 23 DOM
-
2026-06-10days on market $140,160 Active 21 DOM
-
2026-06-09days on market $140,160 Active 20 DOM
-
2026-06-08days on market $140,160 Active 19 DOM
-
2026-06-07days on market $140,160 Active 18 DOM
-
2026-06-05days on market $140,160 Active 15 DOM
-
2026-06-03days on market $140,160 Active 14 DOM
-
2026-06-02days on market $140,160 Active 13 DOM
-
2026-06-01days on market $140,160 Active 12 DOM
-
2026-05-31days on market $140,160 Active 11 DOM
-
2026-05-30days on market $140,160 Active 10 DOM
-
2026-05-20$140,160 Active
ⓘ Source: listings_history table (triggers on properties + properties_extension) + one-shot
backfill from property_details.listing_events for pre-trigger history.
Tax reassessment forecast AL · Resets to sale price
- Current annual tax
- $418 · $35/mo
- Projected year-2 tax
- $575 · $48/mo
- Expected delta
- +$156/yr (+$13/mo · 37.4%)
ⓘ Screening estimate from a state-policy table — verify with the county assessor before closing.
Climate risk First Street
- Flood 1/10 Low FEMA zone X (unshaded) · 0% chance over 30 yrs
- Wildfire 1/10 Low
- Heat 9/10 Extreme 7 d/yr ≥104°F today · 21 d/yr by 30 yrs out
- Wind 9/10 Extreme 99% chance of damaging wind over 30 yrs
- Air quality 2/10 Low 1 unhealthy d/yr today · 1 by 30 yrs out
Nearby sold comps map
Loading sold comps map…
Walkable amenities ~0.75 mi
Loading nearby amenities…
Taxation est. · year 1
- Rental income
- $14,982
- − Mortgage interest
- −$7,851
- − Property taxes
- −$418
- − Insurance
- −$701
- − Repairs & maintenance
- −$1,199
- − Management
- −$1,199
- − Depreciation
- −$4,077
- Taxable loss
- −$462
- Est. tax savings @ 24.0%
- +$111
- After-tax cash flow
- $2,008/yr
For passive investors: Depreciation is non-cash, so a rental often shows a tax loss while cash-flowing — sheltering income. Rental losses are passive: they offset passive income freely, and up to $25,000/yr can offset ordinary (W-2) income if you actively participate and your MAGI is under $100k (phasing out to $0 by $150k); unused losses carry forward. On sale, claimed depreciation is recaptured at up to 25%, and gains may owe capital-gains tax (a 1031 exchange can defer both). Figures are a year-1 estimate at your 24.0% rate — not tax advice; consult a CPA.
Schools (NCES district)
- District
- Mobile County
- NCES district ID
- 0102370
- Math proficiency
- 15% ▼ -28.00%
- Reading proficiency
- 39% ▬ 0.00%
- Median HH income
- $42,455
- Composite
- 22.9/100
- National rank
- #8002
- State rank
- #81 of 129 in AL
Livability — Prichard
- Score
- 54/100
- State rank
- #472
- US rank
- #24080
Category grades
Schools grade is shown separately in the Schools card above.
Census & demographics
- Census place
- Prichard, AL
- City population
- 13,402
- Population (ZIP)
- 9,692
Population outlook (Mobile County) Hauer SSP2
- Today (2025)
- 415,303 people
- By 2030
- 411,755 · -0.9%
- By 2040
- 399,670 · -3.8%
- By 2050
- 382,616 · -7.9%
- By 2075
- 337,353 · -18.8%
- By 2100
- 283,391 · -31.8%
Race, ethnicity, and origin ACS 2023
- Neighborhood character
- Predominantly Black (97%)
- Race & ethnicity
- Black 97% Hispanic / Latino 1% White 1%
- Foreign-born
- 0%
Political lean MEDSL · Mobile
- 2024 margin
- R (+16.4) · D 41.3% · R 57.7%
- 2008→2024 swing
- -7.7pp toward R · 2008: -8.7pp · 2024: -16.4pp
- All cycles
- 2024: R+16.4 2020: R+11.9 2016: R+13.9 2012: R+9.3 2008: R+8.7
Not yet ingested
- Civics
- —
Market trends
- HPI YoY
- ▲ 0.37%
- Current HPI
- 42.6203
- Rent YoY
- —
- Metro
- —
- State GDP YoY
- ▲ 2.94%
- F500 in state
- 4
Industry mix (Fortune 500 HQ in AL)
| Industry | F500 HQs | Revenue |
|---|---|---|
| Financial Services | 1 | $8B |
|
||
| Healthcare | 1 | $5B |
|
||
Price history
1 event — show timeline
- 2026-05-20 Listed $140,160 GCMLS AL
Property tax history
-0.4%/yrLatest (2025): $418 · +1.2% YoY. Source: county tax records.
Cash-flow waterfall
monthlySold comps — $/sqft
last 12 mo · ≤1 miLoading sold comps…