100 Gulf Camp Rd · Baxterville, MS
Flood risk 1/10 · Minimal
- FEMA flood zone
- X (unshaded)
- Chance of flooding over 30 yrs
- 0.0%
- Est. flood insurance / yr
- $507 – $1,088
Fire risk 6/10 · Moderate
- Est. fire insurance / yr
- $1,241 – $2,305
Heat risk 8/10 · Major
- Hot days now (above 108°F)
- 7 days/yr
- Hot days in 30 yrs
- 20 days/yr
Wind risk 8/10 · Major
- Chance of severe wind over 30 yrs
- 99.0%
Air-quality risk 1/10 · Minimal
- Unhealthy air days now
- 0 days/yr
- Unhealthy air days in 30 yrs
- 0 days/yr
Risk factors via First Street. Map © Google.
Why this score? — see what drove the C+ grade
The composite is a weighted blend of 9 inputs, each scored 0–100. Each bar is that input's sub-score; the figure is the points it added to the 100-point composite (weight × sub-score).
- Cash flow +23.6/30.0
- Appreciation +8.6/10.0
- DSCR +7.6/10.0
- ARV discount +7.5/15.0
- 1% rule +5.1/10.0
- Schools +4.1/10.0
- Rent growth +2.5/5.0
- Livability +2.5/5.0
- Condition / age +2.5/5.0
$125,000
🖨 Deal sheet (PDF) 📄 Offer letter ✓ Due diligence
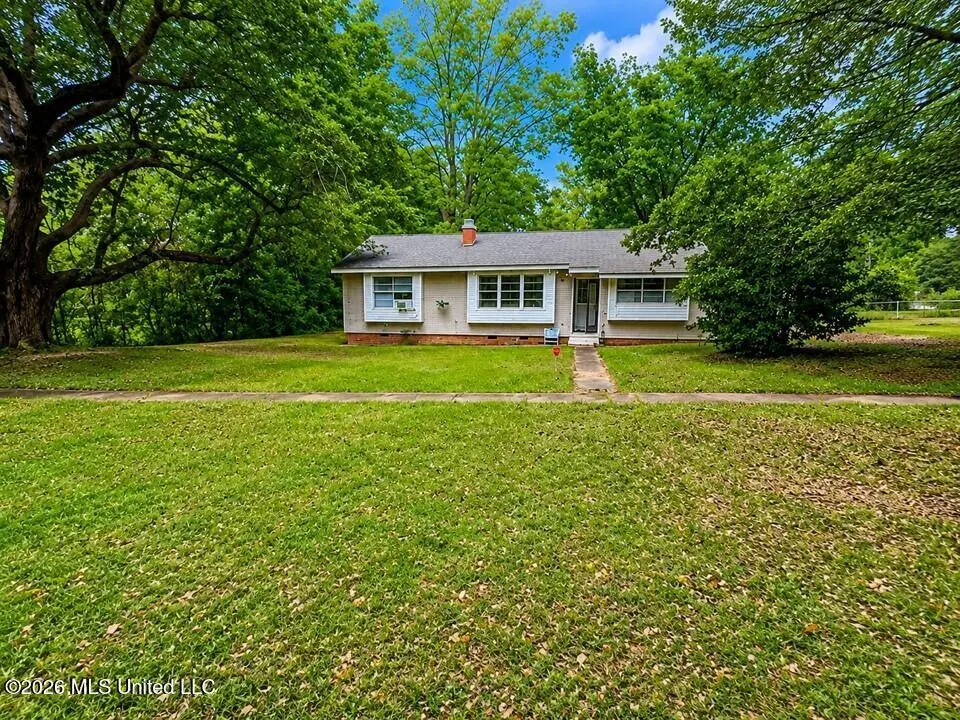
Listing remarks
Discover the potential of this 3-bedroom, 2-bathroom home featuring a living room with a fireplace, a kitchen, and a dining area that provides a comfortable setting for everyday living. The property also offers a spacious backyard, perfect for hosting family gatherings, entertaining guests, or enjoying outdoor activities. With its inviting atmosphere and generous outdoor space, this home presents a wonderful opportunity to create lasting memories and make it your own.
Key facts
- Spacious backyard
- Dining area
- 0.78 acre lot
Tags
Property features AI
Exterior
- Parking: 1-car garage; Total parking for 1 vehicle
- Utilities: Public water; Septic tank; Electricity available; Sewer available
- Home design: Single-family residence (house); One level
- Construction: Vinyl exterior; Slab foundation
- Exterior features: Metal roof; Lot approximately 0.78 acre
Interior
- Kitchen: Dishwasher
- Bathrooms: 2 full bathrooms
- Heating & cooling: Central heating; Central air conditioning
- Interior features: Dishwasher; Wood-burning fireplace in the living room
Neighborhood map
What this means for you Summary
Snapshot
- This is a 3-bed/1.0-bath single-family listed at $125k.
Deal economics
- At list price, monthly cash flow is $235 ($3k/yr) — positive.
- The deal already cash-flows at list — no discount required.
- Meets the 1% rule at list price ($1k rent vs $125k).
- Recommended offer: $123k (1.5% below list) — sets the bar for market timing.
Location & tenants
- Location reads: area grade C — affects rentability + tenant quality, not the cash-flow math above.
- Lamar County School District (rural): math 48% / reading 46% proficiency, ranked #18 of 130 in MS (top 14%) — families likely to look elsewhere, expect single-tenant / working-renter base with shorter leases.
- Zoned schools: Baxterville School (math 47% / reading 42%, grade F, #92 of 375 statewide, top 26%, 252 students, 99% FRL); Purvis High School (math 27% / reading 42%, grade F, #68 of 197 statewide, top 39%, 620 students, 100% FRL) — zoned schools average 99% FRL vs 43% district-wide (57 pts higher); higher-poverty schools than district average — tighter screening recommended.
- Market conditions: 302 active listings in the ZIP; 45 units permitted in Lamar County in 2024 (0 in 5+ unit buildings).
Forward outlook
- In year one you build about $10k of equity ($864 loan paydown + $9k appreciation (7.2% local appreciation)).
- Lamar County population projected at +36% by 2050 — long-run rental-demand tailwind backs the buy-and-hold thesis.
- At projected returns (7.2% appreciation + 3.0% rent growth), your $35k cash investment doubles in ~3 years — after that, you're playing with house money.
- By year 4, paydown + projected appreciation supports a ~$34k cash-out refi (75% LTV) — recoverable capital for the next deal without selling this one.
Negotiation context
- It's been on market 16 days — a 2% lower offer ($123k) is reasonable based on typical stale-listing flexibility.
- 5 sale attempts since 9y ago with the ask held roughly flat each time — persistent listings suggest the price (not the market) is what's stuck; bring a comps-based counter.
Risks & watch-outs
- Watch-outs: built in 1947 — expect roof / HVAC / electrical / plumbing capex.
- Climate carrying-cost: severe wind risk, 99% chance of damaging wind over 30y; major wildfire risk; extreme-heat days projected 7→20/yr by 2055 (HVAC capex compounding) — expect insurance premiums to compound above CPI over the hold.
Questions for the listing agent
- Built in 1947 — when were the roof, HVAC, electrical panel, plumbing, and water heater last replaced?
- Is there a deadline driving the sale (1031 exchange, divorce, estate, relocation)? That informs how much negotiation room exists.
- What's the average days-on-market for RENTAL listings here right now (not sales)? A rising rental-DOM trend means longer vacancies and softer asking-rent achievability than the comps imply.
- What's the recent tenant-quality profile in this submarket — average credit score on applications, eviction rate, late-payment / NSF rate, and stable-employment percentage? A property-management company in the area should have these aggregated.
- How much new for-sale + rental construction is in the pipeline within 1–3 miles? Heavy new supply typically softens prices + rents 12–24 months out; constrained supply supports both.
Investment metrics
- 1% rule
- 1.01% ✓
- Cap rate
- 8.54%
- Cash-on-cash
- 8.04%
- DSCR
- 1.36
- GRM
- 8.3
CMA / ARV
No comps found within radius.
Projected returns pro-forma
7.23% appreciation · 3.0% rent growth · sell at horizon
- IRR
- 24.6%
- Equity multiple
- 2.72×
- Total profit
- $60,323
- Equity at exit
- $88,514
- IRR
- 22.6%
- Equity multiple
- 5.68×
- Total profit
- $163,913
- Equity at exit
- $169,879
Cash invested: $35,000 (down + closing). Projections, not guarantees.
Landlord ↔ Tenant lean methodology
- Overall (STATE)
- 90 Strongly Landlord-Friendly
- State Mississippi
- 90 Strongly Landlord-Friendly · R+11
- County
- — inherits STATE
- City
- — inherits STATE
ZIP-level market 39455
- Home prices YoY
- 3.7%
- Active inventory
- 302
- Price-to-rent
- 8.3×
Monthly cashflow live
- Estimated rent
- $1,258 medium interval (Pro) →
- Mortgage (P&I)
- −$656
- Tax from tax record
- −$51 /mo · $617/yr
- Insurance
- −$52
- HOA
- −$0
- Vacancy / Maint / Mgmt
- −$264
- Net cashflow
- $235
Break-even live
Sensitivity live
| Price | -10% $305 | -5% $270 | +0% $235 | +5% $199 | +10% $164 |
|---|---|---|---|---|---|
| Rent | -10% $135 | -5% $185 | +0% $235 | +5% $284 | +10% $334 |
| Rate | -1.0pp $298 | -0.5pp $266 | base $235 | +0.5pp $202 | +1.0pp $169 |
UW: 25.0% down · 7.5% · 30yr · 1.5% tax · 5.0% vac · 8.0% maint · 8.0% mgmt
Financing live
Cash to close
- Down payment
- $31,250
- Closing costs
- $3,750
- Reserves months
- —
- Total cash needed
- —
Loan-product check · same deal, 3 products live
Conventional
25% down · 7.5% · 30yr
- Down + closing
- —
- Monthly P&I
- —
- Monthly cashflow
- —
- DSCR
- —
- Eligible?
- —
Personal DTI + credit; lowest rate.
DSCR
20% down · 8.5% · 30yr
- Down + closing
- —
- Monthly P&I
- —
- Monthly cashflow
- —
- DSCR
- —
- Eligible?
- —
No personal income docs; deal must DSCR.
Hard money
10% down · 12.0% · 12mo
- Down + closing
- —
- Monthly P&I
- —
- Monthly cashflow
- —
- DSCR
- —
- Eligible?
- —
Short-term bridge; refi at stabilization.
Listing history 13 events
-
2026-06-21days on market $125,000 Active 16 DOM
-
2026-06-19days on market $125,000 Active 14 DOM
-
2026-06-18days on market $125,000 Active 13 DOM
-
2026-06-17days on market $125,000 Active 12 DOM
-
2026-06-16days on market $125,000 Active 11 DOM
-
2026-06-15days on market $125,000 Active 10 DOM
-
2026-06-14days on market $125,000 Active 8 DOM
-
2026-06-13days on market $125,000 Active 7 DOM
-
2026-06-10days on market $125,000 Active 5 DOM
-
2026-06-09days on market $125,000 Active 4 DOM
-
2026-06-08days on market $125,000 Active 3 DOM
-
2026-06-07remarks 472-char remark
-
2026-06-07$125,000 Active 2 DOM
ⓘ Source: listings_history table (triggers on properties + properties_extension) + one-shot
backfill from property_details.listing_events for pre-trigger history.
Tax reassessment forecast MS · Resets to sale price
- Current annual tax
- $617 · $51/mo
- Projected year-2 tax
- $988 · $82/mo
- Expected delta
- +$371/yr (+$31/mo · 60.1%)
ⓘ Screening estimate from a state-policy table — verify with the county assessor before closing.
Climate risk First Street
- Flood 1/10 Low FEMA zone X (unshaded) · 0% chance over 30 yrs
- Wildfire 6/10 Major
- Heat 8/10 Severe 7 d/yr ≥108°F today · 20 d/yr by 30 yrs out
- Wind 8/10 Severe 99% chance of damaging wind over 30 yrs
- Air quality 1/10 Low 0 unhealthy d/yr today · 0 by 30 yrs out
Nearby sold comps map
Loading sold comps map…
Walkable amenities ~0.75 mi
Loading nearby amenities…
Taxation est. · year 1
- Rental income
- $15,092
- − Mortgage interest
- −$7,002
- − Property taxes
- −$617
- − Insurance
- −$625
- − Repairs & maintenance
- −$1,207
- − Management
- −$1,207
- − Depreciation
- −$3,636
- Taxable income
- $797
- Est. tax owed @ 24.0%
- −$191
- After-tax cash flow
- $2,624/yr
For passive investors: Depreciation is non-cash, so a rental often shows a tax loss while cash-flowing — sheltering income. Rental losses are passive: they offset passive income freely, and up to $25,000/yr can offset ordinary (W-2) income if you actively participate and your MAGI is under $100k (phasing out to $0 by $150k); unused losses carry forward. On sale, claimed depreciation is recaptured at up to 25%, and gains may owe capital-gains tax (a 1031 exchange can defer both). Figures are a year-1 estimate at your 24.0% rate — not tax advice; consult a CPA.
Schools (NCES district)
- District
- Lamar County School District
- NCES district ID
- 2802400
- Math proficiency
- 48% ▼ -13.00%
- Reading proficiency
- 46% ▼ -7.00%
- Median HH income
- $54,742
- Composite
- 40.77/100
- National rank
- #3645
- State rank
- #18 of 130 in MS
Livability — Baxterville
No livability data for this city. (Only ~50 U.S. cities are tracked.)
Census & demographics
- Population (ZIP)
- 9,030
Population outlook (Lamar County) Hauer SSP2
- Today (2025)
- 71,826 people
- By 2030
- 77,309 · +7.6%
- By 2040
- 87,733 · +22.1%
- By 2050
- 97,289 · +35.5%
- By 2075
- 115,347 · +60.6%
- By 2100
- 125,601 · +74.9%
Race, ethnicity, and origin ACS 2023
- Neighborhood character
- Predominantly White (82%)
- Race & ethnicity
- White 82% Black 15% Two or more races 3%
- Common ancestry
- Lithuanian 5% Portuguese 2% Slovak 1%
- Foreign-born
- 0%
Political lean MEDSL · Lamar
- 2024 margin
- Solid R (+48.8) · D 25.0% · R 73.8% · Other 1.3%
- 2008→2024 swing
- +7.0pp toward D · 2008: -55.8pp · 2024: -48.8pp
- All cycles
- 2024: R+48.8 2020: R+46.9 2016: R+55.6 2012: R+54.6 2008: R+55.8
Not yet ingested
- Civics
- —
Market trends
- HPI YoY
- ▲ 7.23%
- Current HPI
- 202.5728
- Rent YoY
- —
- Metro
- —
- State GDP YoY
- —
- F500 in state
- 0
Price history
+528.1% since first listed19 events — show timeline
- 2026-06-05 Listed $125,000 MLSU
- 2025-12-15 Listing Removed — MLSU
- 2025-09-25 Price Changed $125,000 HAAR
- 2025-09-25 Price Changed $125,000 MLSU
- 2025-08-21 Price Changed $132,000 HAAR
- 2025-08-21 Price Changed $132,000 MLSU
- 2025-08-04 Price Changed $142,100 HAAR
- 2025-08-04 Price Changed $142,100 MLSU
- 2025-08-02 Price Changed $142,900 HAAR
- 2025-08-02 Price Changed $142,900 MLSU
- 2025-06-27 Listed $149,900 MLSU
- 2025-06-25 Price Changed $149,900 HAAR
- 2025-06-12 Price Changed $159,900 HAAR
- 2025-05-29 Listed $165,000 HAAR
- 2019-01-02 Sold (Public Records) $121,000 Public Records
- 2018-12-28 Sold (MLS) — HAAR
- 2018-09-22 Listed $119,900 HAAR
- 2018-04-30 Sold (MLS) — HAAR
- 2017-10-17 Listed $19,900 HAAR
Property tax history
+6.9%/yrLatest (2025): $617 · +4.5% YoY. Source: county tax records.
Cash-flow waterfall
monthlySold comps — $/sqft
last 12 mo · ≤1 miLoading sold comps…