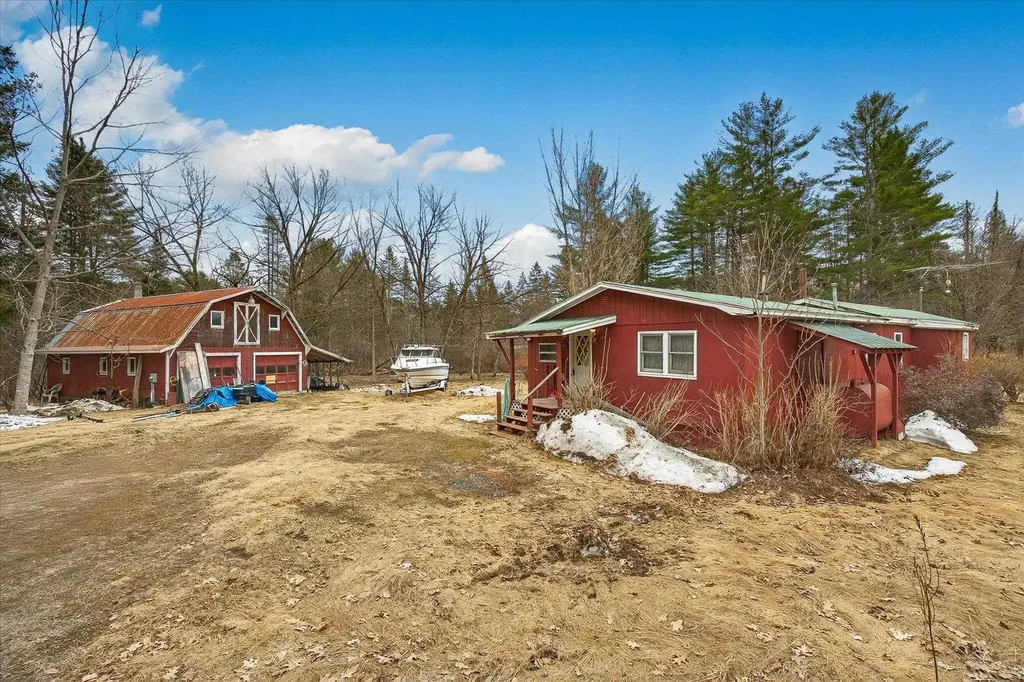
1343 Chelsea Rd · Corinth, VT
Flood risk 4/10 · Minor
- FEMA flood zone
- A
- Chance of flooding over 30 yrs
- 0.22%
- Est. flood insurance / yr
- $946 – $6,584
Fire risk 3/10 · Minor
- Est. fire insurance / yr
- $480 – $892
Heat risk 2/10 · Minimal
- Hot days now (above 88°F)
- 7 days/yr
- Hot days in 30 yrs
- 16 days/yr
Wind risk 2/10 · Minimal
- Chance of severe wind over 30 yrs
- 4.0%
Air-quality risk 2/10 · Minimal
- Unhealthy air days now
- 0 days/yr
- Unhealthy air days in 30 yrs
- 1 days/yr
Risk factors via First Street. Map © Google.
Why this score? — see what drove the C grade
The composite is a weighted blend of 9 inputs, each scored 0–100. Each bar is that input's sub-score; the figure is the points it added to the 100-point composite (weight × sub-score).
- Cash flow +19.9/30.0
- ARV discount +7.5/15.0
- DSCR +6.3/10.0
- Appreciation +6.2/10.0
- Schools +5.0/10.0
- 1% rule +4.9/10.0
- Rent growth +2.5/5.0
- Livability +2.5/5.0
- Condition / age +2.5/5.0
$129,000
🖨 Deal sheet (PDF) 📄 Offer letter ✓ Due diligence
Listing remarks
If you've been looking for a rural Vermont property to make your own, 1343 Chelsea Road is worth a look. Situated on 8.5 acres along Meadow Brook, this parcel offers privacy and mature evergreens on all sides. Note that the property is located in a flood zone. The standout feature is the two-story gambrel barn with two garage bays, a concrete floor, built-in workbenches, and a large upper level with impressive timber framing and a metal roof, ready for storage, a workshop, or finishing into additional space. The existing home is a manufactured home that will need significant work or replacement. A dug well and septic system are on site. Buyer to do their own due diligence in determining the
Key facts
- Mature evergreens
- Privacy
- 8.5 acres
Tags
Property features AI
Exterior
- Parking: 2-car garage
- Utilities: Dug well water; Septic sewer; Circuit breaker electrical service; Internet availability unknown; No additional utilities listed
- Home design: Manufactured home (Manuf/Mobile); Red exterior color; Metal roof; Existing structure; Single-story (all main level)
- Construction: Built in 1980; Wood siding; Metal roof; Manufactured home construction
- Exterior features: Level lot; Dirt driveway; Public road frontage (247 feet); Flood zone
Interior
- Kitchen: Kitchen on main level; Gas range; Microwave
- Bedrooms: Master bedroom on main level; Two additional bedrooms on main level
- Flooring: Carpet; Concrete; Tile; Wood
- Bathrooms: One full bathroom on main level
- Heating & cooling: Forced air heating; Propane and oil heating sources; Wall AC units
- Interior features: Five total rooms; Dirt-floor basement with interior access; Carpet, concrete, tile, and wood flooring
- Laundry & utility: Washer; Dryer
Neighborhood map
What this means for you Summary
Snapshot
- This is a 3-bed/1.0-bath manufactured listed at $129k.
Deal economics
- At list price, monthly cash flow is $-158 ($-2k/yr) — negative.
- To cash-flow at today's rent, offer at most $101k (21.6% below list).
- To meet the 1% rule (rent ≥ 1% of price), the offer needs to be $128k (0.8% below list).
- Recommended offer: $101k (21.6% below list) — sets the bar for cash-flow.
Location & tenants
- Location reads: area grade C — affects rentability + tenant quality, not the cash-flow math above.
- Zoned schools: Waits River Valley Union School (math 32% / reading 47%, grade F, #96 of 192 statewide, top 57%, 263 students, 38% FRL).
- Market conditions: 7 active listings in the ZIP; 74 units permitted in Orange County in 2024 (28 in 5+ unit buildings).
Forward outlook
- In year one you build about $4k of equity ($892 loan paydown + $3k appreciation (2.3% local appreciation)).
- Orange County population projected at -18% by 2050 — secular population decline; favor cash flow + early exit over multi-decade hold.
- By year 9, paydown + projected appreciation supports a ~$33k cash-out refi (75% LTV) — recoverable capital for the next deal without selling this one.
Negotiation context
- It's been on market 50 days — a 3% lower offer ($125k) is reasonable based on typical stale-listing flexibility.
- 2 sale attempts with the ask held roughly flat each time — persistent listings suggest the price (not the market) is what's stuck; bring a comps-based counter.
Risks & watch-outs
- Watch-outs: flood insurance adds $314/mo.
- Climate carrying-cost: in FEMA flood zone A (mandatory federal flood insurance) — expect insurance premiums to compound above CPI over the hold.
Questions for the listing agent
- What do current leases actually rent for vs. the listed asking? Can we see a recent rent roll and the last 12 months of T-12 income?
- It's been on market 50 days. Have you received any prior offers? Is the seller open to a 22% concession, seller financing, or rate buy-down credit?
- What's the actual annual flood-insurance premium (NFIP or private), and is the property in a SFHA with mandatory coverage?
- Is there a deadline driving the sale (1031 exchange, divorce, estate, relocation)? That informs how much negotiation room exists.
- What's the average days-on-market for RENTAL listings here right now (not sales)? A rising rental-DOM trend means longer vacancies and softer asking-rent achievability than the comps imply.
- What's the recent tenant-quality profile in this submarket — average credit score on applications, eviction rate, late-payment / NSF rate, and stable-employment percentage? A property-management company in the area should have these aggregated.
- How much new for-sale + rental construction is in the pipeline within 1–3 miles? Heavy new supply typically softens prices + rents 12–24 months out; constrained supply supports both.
Investment metrics
- 1% rule
- 0.99% ✗
- Cap rate
- 7.74%
- Cash-on-cash
- 5.18%
- DSCR
- 1.23
- GRM
- 8.4
CMA / ARV
No comps found within radius.
Projected returns pro-forma
2.33% appreciation · 3.0% rent growth · sell at horizon
- IRR
- 0.6%
- Equity multiple
- 1.03×
- Total profit
- $1,181
- Equity at exit
- $53,230
- IRR
- 4.7%
- Equity multiple
- 1.67×
- Total profit
- $24,322
- Equity at exit
- $78,499
Cash invested: $36,120 (down + closing). Projections, not guarantees.
Landlord ↔ Tenant lean methodology
- Overall (STATE)
- 41 Moderately Tenant-Leaning
- State Vermont
- 41 Moderately Tenant-Leaning · D+15
- County
- — inherits STATE
- City
- — inherits STATE
ZIP-level market 05039
- Home prices YoY
- 1.8%
- Active inventory
- 7
- Price-to-rent
- 8.4×
Monthly cashflow live
- Estimated rent
- $1,279 medium interval (Pro) →
- Mortgage (P&I)
- −$676
- Tax from tax record
- −$125 /mo · $1,494/yr
- Insurance
- −$54
- Flood insurance flood zone
- −$314 /mo · $3,765/yr
- HOA
- −$0
- Vacancy / Maint / Mgmt
- −$269
- Net cashflow
- $-158
Break-even live
Sensitivity live
| Price | -10% $-85 | -5% $-121 | +0% $-158 | +5% $-194 | +10% $-231 |
|---|---|---|---|---|---|
| Rent | -10% $-259 | -5% $-208 | +0% $-158 | +5% $-107 | +10% $-57 |
| Rate | -1.0pp $-93 | -0.5pp $-125 | base $-158 | +0.5pp $-191 | +1.0pp $-225 |
UW: 25.0% down · 7.5% · 30yr · 1.5% tax · 5.0% vac · 8.0% maint · 8.0% mgmt
Financing live
Cash to close
- Down payment
- $32,250
- Closing costs
- $3,870
- Reserves months
- —
- Total cash needed
- —
Loan-product check · same deal, 3 products live
Conventional
25% down · 7.5% · 30yr
- Down + closing
- —
- Monthly P&I
- —
- Monthly cashflow
- —
- DSCR
- —
- Eligible?
- —
Personal DTI + credit; lowest rate.
DSCR
20% down · 8.5% · 30yr
- Down + closing
- —
- Monthly P&I
- —
- Monthly cashflow
- —
- DSCR
- —
- Eligible?
- —
No personal income docs; deal must DSCR.
Hard money
10% down · 12.0% · 12mo
- Down + closing
- —
- Monthly P&I
- —
- Monthly cashflow
- —
- DSCR
- —
- Eligible?
- —
Short-term bridge; refi at stabilization.
Listing history 20 events
-
2026-06-21days on market $129,000 Active 50 DOM
-
2026-06-19days on market $129,000 Active 48 DOM
-
2026-06-18days on market $129,000 Active 47 DOM
-
2026-06-17days on market $129,000 Active 46 DOM
-
2026-06-16days on market $129,000 Active 45 DOM
-
2026-06-15days on market $129,000 Active 44 DOM
-
2026-06-14days on market $129,000 Active 42 DOM
-
2026-06-12days on market $129,000 Active 41 DOM
-
2026-06-09days on market $129,000 Active 38 DOM
-
2026-06-08days on market $129,000 Active 37 DOM
-
2026-06-07days on market $129,000 Active 36 DOM
-
2026-06-07days on market $129,000 Active 35 DOM
-
2026-06-04days on market $129,000 Active 32 DOM
-
2026-06-02days on market $129,000 Active 31 DOM
-
2026-06-01days on market $129,000 Active 30 DOM
-
2026-05-31days on market $129,000 Active 29 DOM
-
2026-05-31days on market $129,000 Active 28 DOM
-
2026-05-16status Active
-
2026-04-20status Pending
-
2026-04-06$129,000 Active
ⓘ Source: listings_history table (triggers on properties + properties_extension) + one-shot
backfill from property_details.listing_events for pre-trigger history.
Tax reassessment forecast VT · Partial reset (capped growth)
- Current annual tax
- $1,494 · $125/mo
- Projected year-2 tax
- $1,973 · $164/mo
- Expected delta
- +$478/yr (+$40/mo · 32.0%)
ⓘ Screening estimate from a state-policy table — verify with the county assessor before closing.
Climate risk First Street
- Flood 4/10 Moderate FEMA zone A · 22% chance over 30 yrs
- Wildfire 3/10 Moderate
- Heat 2/10 Low 7 d/yr ≥88°F today · 16 d/yr by 30 yrs out
- Wind 2/10 Low 4% chance of damaging wind over 30 yrs
- Air quality 2/10 Low 0 unhealthy d/yr today · 1 by 30 yrs out
Nearby sold comps map
Loading sold comps map…
Walkable amenities ~0.75 mi
Loading nearby amenities…
Taxation est. · year 1
- Rental income
- $15,350
- − Mortgage interest
- −$7,226
- − Property taxes
- −$1,494
- − Insurance
- −$4,410
- − Repairs & maintenance
- −$1,228
- − Management
- −$1,228
- − Depreciation
- −$3,753
- Taxable loss
- −$3,989
- Est. tax savings @ 24.0%
- +$957
- After-tax cash flow
- $-938/yr
For passive investors: Depreciation is non-cash, so a rental often shows a tax loss while cash-flowing — sheltering income. Rental losses are passive: they offset passive income freely, and up to $25,000/yr can offset ordinary (W-2) income if you actively participate and your MAGI is under $100k (phasing out to $0 by $150k); unused losses carry forward. On sale, claimed depreciation is recaptured at up to 25%, and gains may owe capital-gains tax (a 1031 exchange can defer both). Figures are a year-1 estimate at your 24.0% rate — not tax advice; consult a CPA.
Schools (NCES district)
No district data.
Livability — Corinth
No livability data for this city. (Only ~50 U.S. cities are tracked.)
Census & demographics
- Population (ZIP)
- 987
Population outlook (Orange County) Hauer SSP2
- Today (2025)
- 28,186 people
- By 2030
- 27,359 · -2.9%
- By 2040
- 25,221 · -10.5%
- By 2050
- 23,023 · -18.3%
- By 2075
- 18,621 · -33.9%
- By 2100
- 14,477 · -48.6%
Race, ethnicity, and origin ACS 2023
- Neighborhood character
- Predominantly White (94%)
- Race & ethnicity
- White 94% Two or more races 4% Hispanic / Latino 1%
- Common ancestry
- Slovak 14% Lithuanian 10% Serbian 2%
- Foreign-born
- 1%
Political lean MEDSL · Orange
- 2024 margin
- Strong D (+20.2) · D 58.3% · R 38.1% · Other 3.6%
- 2008→2024 swing
- -11.1pp toward R · 2008: 31.3pp · 2024: 20.2pp
- All cycles
- 2024: D+20.2 2020: D+24.1 2016: D+18.8 2012: D+32.1 2008: D+31.3
Not yet ingested
- Civics
- —
Market trends
- HPI YoY
- ▲ 2.33%
- Current HPI
- 135.6372
- Rent YoY
- —
- Metro
- —
- State GDP YoY
- —
- F500 in state
- 0
Price history
3 events — show timeline
- 2026-05-16 Relisted — PrimeMLS
- 2026-04-20 Pending — PrimeMLS
- 2026-04-06 Listed $129,000 PrimeMLS
Property tax history
+16.8%/yrLatest (2024): $1,494 · -6.4% YoY. Source: county tax records.
Cash-flow waterfall
monthlySold comps — $/sqft
last 12 mo · ≤1 miLoading sold comps…