9200 W Bellfort St #76 · Houston, TX
Flood risk 5/10 · Moderate
- FEMA flood zone
- X (unshaded)
- Chance of flooding over 30 yrs
- 0.65%
- Est. flood insurance / yr
- $507 – $1,088
Fire risk 1/10 · Minimal
- Est. fire insurance / yr
- $1,222 – $2,270
Heat risk 9/10 · Severe
- Hot days now (above 110°F)
- 7 days/yr
- Hot days in 30 yrs
- 23 days/yr
Wind risk 9/10 · Severe
- Chance of severe wind over 30 yrs
- 99.0%
Air-quality risk 2/10 · Minimal
- Unhealthy air days now
- 2 days/yr
- Unhealthy air days in 30 yrs
- 2 days/yr
Risk factors via First Street. Map © Google.
Why this score? — see what drove the D- grade
The composite is a weighted blend of 9 inputs, each scored 0–100. Each bar is that input's sub-score; the figure is the points it added to the 100-point composite (weight × sub-score).
- ARV discount +14.4/15.0
- 1% rule +5.3/10.0
- Appreciation +5.2/10.0
- Livability +3.7/5.0
- Cash flow +3.4/30.0
- Schools +2.7/10.0
- Rent growth +2.5/5.0
- Condition / age +2.5/5.0
- DSCR +0.0/10.0
$108,000
🖨 Deal sheet 📄 Offer letter ✓ Due diligence
Listing remarks MLS
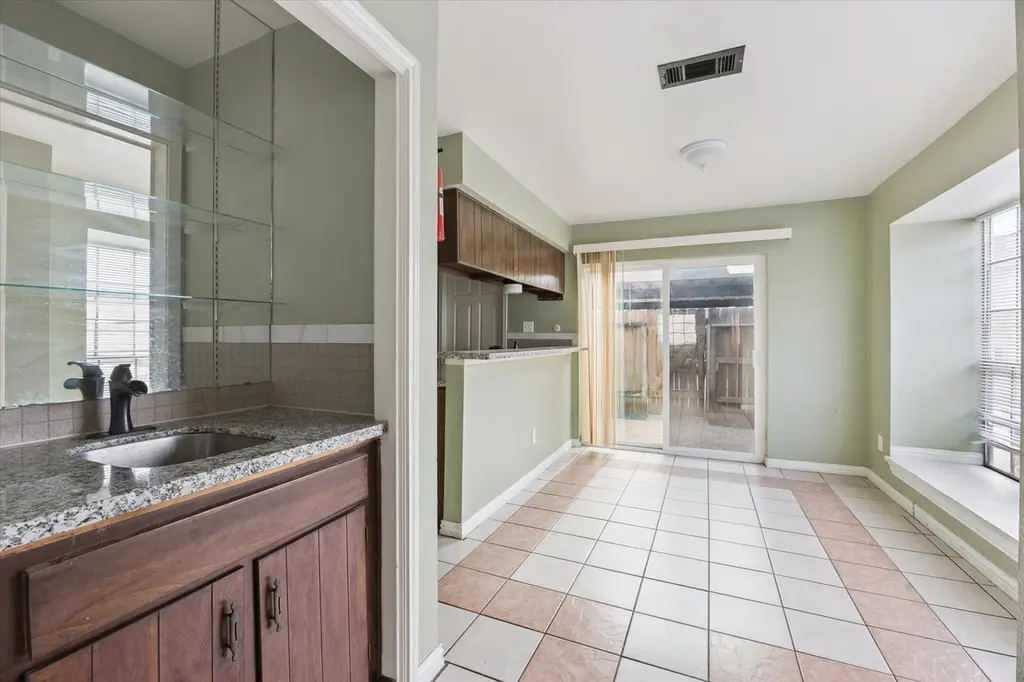
Welcome to this charming 2-bedroom, 1-bath townhouse offering 1,179 sq ft of comfortable living space. Nestled in a quiet community, this home features a spacious layout filled with natural light and a private patio perfect for relaxing or entertaining. The open-concept living and dining area flows seamlessly, while the kitchen offers ample storage and counter space. Both bedrooms are generously sized with great closet space. Enjoy the convenience of low-maintenance living just minutes from shopping, dining, and major freeways. Whether you're a first-time homebuyer or investor, this home is a must-see!
Key facts
- Natural light
- Private patio
- Open-concept living
Tags
Neighborhood map
What this means for you Summary
Snapshot
- This is a 2-bed/1.5-bath condo listed at $108k.
Deal economics
- At list price, monthly cash flow is $-332 ($-4k/yr) — negative.
- To cash-flow at today's rent, offer at most $49k (54.3% below list).
- Meets the 1% rule at list price ($1k rent vs $108k).
- Recommended offer: $49k (54.3% below list) — sets the bar for cash-flow.
Location & tenants
- Location reads 74/100 on livability (#184 in TX, #4,771 nationally) — a middle-class / working-renter tenant base. Strengths: amenities A+, cost of living A+, housing A+; Watch: schools D, crime F.
- Houston ISD (urban): math 27% / reading 35% proficiency, ranked #593 of 826 in TX (top 72%) — families likely to look elsewhere, expect single-tenant / working-renter base with shorter leases; 71% free/reduced lunch — lower-income household profile, screen leases tightly.
- Market conditions: 62 active listings in the ZIP; 40 comparable units currently listed for rent nearby; rentals at typical pace (median 16d on market — plan ~3-4 weeks tenant-placement turnaround); 29,883 units permitted in Harris County in 2024 (8,621 in 5+ unit buildings).
Forward outlook
- In year one you build about $1k of equity ($747 loan paydown + $408 appreciation (0.4% local appreciation)).
- Harris County population projected at +47% by 2050 — long-run rental-demand tailwind backs the buy-and-hold thesis.
Negotiation context
- It's been on market 259 days — a 12% lower offer ($95k) is reasonable based on typical stale-listing flexibility.
- 2 sale attempts with the ask held roughly flat each time — persistent listings suggest the price (not the market) is what's stuck; bring a comps-based counter.
Risks & watch-outs
- Watch-outs: HOA is 36% of rent.
- Climate carrying-cost: moderate flood risk; severe wind risk, 99% chance of damaging wind over 30y; extreme-heat days projected 7→23/yr by 2055 (HVAC capex compounding) — expect insurance premiums to compound above CPI over the hold.
Questions for the listing agent
- What do current leases actually rent for vs. the listed asking? Can we see a recent rent roll and the last 12 months of T-12 income?
- It's been on market 259 days. Have you received any prior offers? Is the seller open to a 54% concession, seller financing, or rate buy-down credit?
- Built in 1979 — when were the roof, HVAC, electrical panel, plumbing, and water heater last replaced?
- What does the HOA fee cover, when was the last increase, and are there any pending special assessments or reserve-fund shortfalls?
- Any open or pending special assessments — roof, HVAC, plumbing, elevator, façade? What's the per-unit balance and payoff schedule, and is the seller paying it off at close or rolling it to the buyer?
- Why hasn't it sold? Are there any deal-killer items the seller is aware of (foundation, flood, title, zoning, code violations)?
- Is there a deadline driving the sale (1031 exchange, divorce, estate, relocation)? That informs how much negotiation room exists.
- Schools are D-rated, which usually means shorter tenancies and higher turnover. Who's the typical renter profile here, and what's been the actual vacancy rate?
- Crime grade is F in this area — have there been break-ins, vandalism, or insurance claims at this property in the last 3 years? What carrier currently insures it and at what premium?
- The area grade is low — what's the realistic commute time and amenity access for the typical tenant pool here? Any planned neighborhood developments (good or bad) we should know about?
- What's the average days-on-market for RENTAL listings here right now (not sales)? A rising rental-DOM trend means longer vacancies and softer asking-rent achievability than the comps imply.
- What's the recent tenant-quality profile in this submarket — average credit score on applications, eviction rate, late-payment / NSF rate, and stable-employment percentage? A property-management company in the area should have these aggregated.
- How much new apartment / multifamily construction is in the pipeline within 1–3 miles? Heavy new supply (>2% of stock underway) typically softens rents 12–24 months out; light construction supports rent growth.
Investment metrics
- 1% rule
- 1.03% ✓
- Cap rate
- 2.60%
- Cash-on-cash
- -13.18%
- DSCR
- 0.41
- GRM
- 8.1
CMA / ARV
- ARV (median comp)
- $127,640
- List price
- $108,000
- Delta
- -15.39%
- Verdict
- UNDERPRICED
- Comps
- 20 within 1.0 mi
Projected returns pro-forma
0.38% appreciation · 3.0% rent growth · sell at horizon
- IRR
- -15.3%
- Equity multiple
- 0.27×
- Total profit
- $-22,076
- Equity at exit
- $33,414
- IRR
- -8.5%
- Equity multiple
- 0.05×
- Total profit
- $-28,847
- Equity at exit
- $41,843
Cash invested: $30,240 (down + closing). Projections, not guarantees.
Landlord ↔ Tenant lean methodology
- Overall (STATE)
- 87 Strongly Landlord-Friendly
- State Texas
- 87 Strongly Landlord-Friendly · R+5
- County
- — inherits STATE
- City
- — inherits STATE
ZIP-level market 77031
- Home prices YoY
- 0.2%
- Active inventory
- 62
- Price-to-rent
- 8.1×
Monthly cashflow live
- Estimated rent
- $1,111 high interval (Pro) →
- Mortgage (P&I)
- −$566
- Tax from tax record
- −$198 /mo · $2,381/yr
- Insurance
- −$45
- HOA
- −$400
- Vacancy / Maint / Mgmt
- −$233
- Net cashflow
- $-332
Break-even live
UW: 25.0% down · 7.5% · 30yr · 1.5% tax · 5.0% vac · 8.0% maint · 8.0% mgmt
Financing live
Cash to close
- Down payment
- $27,000
- Closing costs
- $3,240
- Reserves months
- —
- Total cash needed
- —
Loan-product check · same deal, 3 products live
Conventional
25% down · 7.5% · 30yr
- Down + closing
- —
- Monthly P&I
- —
- Monthly cashflow
- —
- DSCR
- —
- Eligible?
- —
Personal DTI + credit; lowest rate.
DSCR
20% down · 8.5% · 30yr
- Down + closing
- —
- Monthly P&I
- —
- Monthly cashflow
- —
- DSCR
- —
- Eligible?
- —
No personal income docs; deal must DSCR.
Hard money
10% down · 12.0% · 12mo
- Down + closing
- —
- Monthly P&I
- —
- Monthly cashflow
- —
- DSCR
- —
- Eligible?
- —
Short-term bridge; refi at stabilization.
Rent comps 40 comps
| Address | Beds | Baths | Sqft | Rent | $/sqft | DOM | Units | Dist |
|---|---|---|---|---|---|---|---|---|
| 8888 Benning Dr Houston, TX | 3.0 | 3.0 | 1472 | $1,750 | $1.19 | 44d | 1 | 0.55mi |
| 10756 Westbrae Pkwy Houston, TX | 2.0 | 2.0 | 838 | $1,145 | $1.37 | 44d | 1 | 0.59mi |
| 10750 Westbrae Pkwy Unit 2047 Houston, TX | 2.0 | 2.0 | 838 | $1,159 | $1.38 | 3d | 1 | 0.63mi |
| 10750 Westbrae Pkwy Unit 422 Houston, TX | 2.0 | 2.0 | 838 | $1,135 | $1.35 | 8d | 1 | 0.63mi |
| 10750 Westbrae Pkwy Unit 10807 Houston, TX | 2.0 | 2.0 | 838 | $1,159 | $1.38 | 11d | 1 | 0.63mi |
| 10750 Westbrae Pkwy Unit 2165 Houston, TX | 2.0 | 2.0 | 838 | $1,127 | $1.34 | 3d | 1 | 0.63mi |
| 10965 S Gessner Rd Unit 421 Houston, TX | 1.0 | 1.0 | 1003 | $989 | $0.99 | 24d | 1 | 0.84mi |
| 10965 S Gessner Rd Unit 1110 Houston, TX | 2.0 | 2.0 | 1322 | $1,229 | $0.93 | 24d | 1 | 0.84mi |
| 10965 S Gessner Rd Houston, TX | 2.0 | 2.0 | 1322 | $1,229 | $0.93 | 16d | 1 | 0.89mi |
| 10228 S Gessner Rd Houston, TX | 1.0 | 1.0 | 740 | $905 | $1.22 | 44d | 1 | 0.95mi |
| 8700 Gustine Ln Houston, TX | 1.0–2.0 | 1.0–2.0 | 752 | $1,035 | $1.38 | 44d | 20 | 0.99mi |
| 8700 Gustine Ln Houston, TX | 1.0–2.0 | 1.0–2.0 | 752 | $1,004 | $1.33 | 2d | 25 | 0.99mi |
| 10222 S Gessner Rd Houston, TX | 1.0 | 1.0 | 740 | $899 | $1.21 | 13d | 1 | 1.00mi |
| 10222 S Gessner Rd Houston, TX | 2.0 | 2.0 | 1030 | $1,239 | $1.20 | 44d | 1 | 1.00mi |
| 10222 S Gessner Rd Unit 2162 Houston, TX | 2.0 | 2.0 | 910 | $1,080 | $1.19 | 5d | 1 | 1.01mi |
| 10222 S Gessner Rd Unit 2112 Houston, TX | 2.0 | 2.0 | 910 | $1,072 | $1.18 | 3d | 1 | 1.01mi |
| 10222 S Gessner Rd Unit 1162 Houston, TX | 1.0 | 1.0 | 740 | $910 | $1.23 | 5d | 1 | 1.01mi |
| 10222 S Gessner Rd Unit 422 Houston, TX | 2.0 | 2.0 | 910 | $1,080 | $1.19 | 8d | 1 | 1.01mi |
| 10222 S Gessner Rd Unit 324 Houston, TX | 1.0 | 1.0 | 740 | $910 | $1.23 | 8d | 1 | 1.01mi |
| 10222 S Gessner Rd Unit 1165 Houston, TX | 1.0 | 1.0 | 740 | $907 | $1.23 | 3d | 1 | 1.01mi |
| 10222 S Gessner Rd Unit 10273 Houston, TX | 1.0 | 1.0 | 740 | $940 | $1.27 | 44d | 1 | 1.01mi |
| 10222 S Gessner Rd Unit 10243 Houston, TX | 1.0 | 1.0 | 740 | $945 | $1.28 | 14d | 1 | 1.01mi |
| 10222 S Gessner Rd Unit 10243 Houston, TX | 1.0 | 1.0 | 740 | $949 | $1.28 | 11d | 1 | 1.01mi |
| 30 Gustine Ln Houston, TX | 1.0 | 1.0 | 757 | $775 | $1.02 | 44d | 1 | 1.05mi |
| 8207 W Bellfort Ave Houston, TX | 2.0 | 2.0 | 982 | $990 | $1.01 | 18d | 1 | 1.06mi |
| 8207 W Bellfort Ave Houston, TX | 2.0 | 2.0 | 982 | $990 | $1.01 | 44d | 1 | 1.06mi |
| 8243 Creekbend Dr Houston, TX | 2.0 | 2.0 | 1150 | $1,350 | $1.17 | 24d | 1 | 1.09mi |
| 10411 South Dr Houston, TX | 1.0–2.0 | 1.0–2.0 | 757 | $1,495 | $1.97 | 44d | 1 | 1.10mi |
| 9001 S Braeswood Blvd Houston, TX | 1.0–2.0 | 1.0–2.0 | 739 | $852 | $1.15 | 2d | 26 | 1.13mi |
| 9001 S Braeswood Blvd Houston, TX | 1.0–2.0 | 1.0–2.0 | 739 | $971 | $1.31 | 44d | 26 | 1.13mi |
| 8110 Creekbend Dr Apt 628 Houston, TX | 1.0 | 1.0 | 710 | $920 | $1.30 | 24d | 1 | 1.16mi |
| 8110 Creekbend Dr Unit 113 Houston, TX | 2.0 | 2.0 | 915 | $1,260 | $1.38 | 24d | 1 | 1.16mi |
| 8110 Creekbend Dr Apt 305 Houston, TX | 3.0 | 1.5 | 747 | $1,007 | $1.35 | 24d | 1 | 1.16mi |
| 8110 Creekbend Dr Apt 115 Houston, TX | 2.0 | 1.0 | 850 | $1,181 | $1.39 | 24d | 1 | 1.16mi |
| 8110 Creekbend Dr Apt 616 Houston, TX | 1.0 | 1.0 | 710 | $921 | $1.30 | 44d | 1 | 1.16mi |
| 8201 W Bellfort Ave Unit 422 Houston, TX | 2.0 | 2.0 | 848 | $955 | $1.13 | 8d | 1 | 1.17mi |
| 8201 W Bellfort Ave Unit 2162 Houston, TX | 2.0 | 2.0 | 848 | $955 | $1.13 | 5d | 1 | 1.17mi |
| 8201 W Bellfort Ave Unit 510 Houston, TX | 3.0 | 2.0 | 1203 | $1,157 | $0.96 | 3d | 1 | 1.17mi |
| 12660 Stafford Rd Stafford, TX | 1.0–3.0 | 1.0–2.0 | 1027 | $1,478 | $1.44 | 2d | 43 | 1.18mi |
| 9707 Braeburn Glen Blvd Houston, TX | 1.0–3.0 | 1.0–2.0 | 905 | $1,070 | $1.18 | 8d | 15 | 1.23mi |
HOA detail condo
- Monthly dues
- $400 · $4,800/yr
- Assessments
- None detected in remarks — confirm with the listing agent.
Listing history 18 events
-
2026-06-18days on market $108,000 Active 259 DOM
-
2026-06-17days on market $108,000 Active 258 DOM
-
2026-06-16days on market $108,000 Active 257 DOM
-
2026-06-15days on market $108,000 Active 256 DOM
-
2026-06-13days on market $108,000 Active 254 DOM
-
2026-06-10days on market $108,000 Active 250 DOM
-
2026-06-08days on market $108,000 Active 249 DOM
-
2026-06-07days on market $108,000 Active 248 DOM
-
2026-06-04days on market $108,000 Active 245 DOM
-
2026-06-01days on market $108,000 Active 242 DOM
-
2026-05-31days on market $108,000 Active 241 DOM
-
2025-10-02historical
Show marketing remark (609 chars)
Welcome to this charming 2-bedroom, 1-bath townhouse offering 1,179 sq ft of comfortable living space. Nestled in a quiet community, this home features a spacious layout filled with natural light and a private patio perfect for relaxing or entertaining. The open-concept living and dining area flows seamlessly, while the kitchen offers ample storage and counter space. Both bedrooms are generously sized with great closet space. Enjoy the convenience of low-maintenance living just minutes from shopping, dining, and major freeways. Whether you're a first-time homebuyer or investor, this home is a must-see!
-
2025-10-02$108,000 Active 609-char remark
Show marketing remark (609 chars)
Welcome to this charming 2-bedroom, 1-bath townhouse offering 1,179 sq ft of comfortable living space. Nestled in a quiet community, this home features a spacious layout filled with natural light and a private patio perfect for relaxing or entertaining. The open-concept living and dining area flows seamlessly, while the kitchen offers ample storage and counter space. Both bedrooms are generously sized with great closet space. Enjoy the convenience of low-maintenance living just minutes from shopping, dining, and major freeways. Whether you're a first-time homebuyer or investor, this home is a must-see!
-
2025-10-01price $108,000
-
2025-08-07$115,000 Active
-
2005-08-23soldstatus
-
2005-07-06soldstatus
-
2000-07-11soldstatus
ⓘ Source: listings_history table (triggers on properties + properties_extension) + one-shot
backfill from property_details.listing_events for pre-trigger history.
Tax reassessment forecast TX · Resets to sale price
- Current annual tax
- $2,381 · $198/mo
- Projected year-2 tax
- $2,381 · $198/mo
- Expected delta
- $0/yr ($0/mo · 0.0%)
ⓘ Screening estimate from a state-policy table — verify with the county assessor before closing.
Climate risk First Street
- Flood 5/10 Major FEMA zone X (unshaded) · 65% chance over 30 yrs
- Wildfire 1/10 Low
- Heat 9/10 Extreme 7 d/yr ≥110°F today · 23 d/yr by 30 yrs out
- Wind 9/10 Extreme 99% chance of damaging wind over 30 yrs
- Air quality 2/10 Low 2 unhealthy d/yr today · 2 by 30 yrs out
Nearby sold comps map
Loading sold comps map…
Walkable amenities ~0.75 mi
Loading nearby amenities…
Taxation est. · year 1
- Rental income
- $13,332
- − Mortgage interest
- −$6,050
- − Property taxes
- −$2,381
- − Insurance
- −$540
- − Repairs & maintenance
- −$1,067
- − Management
- −$1,067
- − HOA
- −$4,800
- − Depreciation
- −$3,142
- Taxable loss
- −$5,713
- Est. tax savings @ 24.0%
- +$1,371
- After-tax cash flow
- $-2,614/yr
For passive investors: Depreciation is non-cash, so a rental often shows a tax loss while cash-flowing — sheltering income. Rental losses are passive: they offset passive income freely, and up to $25,000/yr can offset ordinary (W-2) income if you actively participate and your MAGI is under $100k (phasing out to $0 by $150k); unused losses carry forward. On sale, claimed depreciation is recaptured at up to 25%, and gains may owe capital-gains tax (a 1031 exchange can defer both). Figures are a year-1 estimate at your 24.0% rate — not tax advice; consult a CPA.
Schools (NCES district)
- District
- Houston ISD
- NCES district ID
- 4823640
- Math proficiency
- 27% ▼ -18.00%
- Reading proficiency
- 35% ▼ -6.00%
- Median HH income
- $46,054
- Composite
- 26.63/100
- National rank
- #7173
- State rank
- #593 of 826 in TX
Livability — Houston
- Score
- 74/100
- State rank
- #184
- US rank
- #4771
Category grades
Schools grade is shown separately in the Schools card above.
Census & demographics
- Census place
- Houston, TX
- City population
- 3,226,434
- Population (ZIP)
- 15,740
Population outlook (Harris County) Hauer SSP2
- Today (2025)
- 5,571,493 people
- By 2030
- 6,089,821 · +9.3%
- By 2040
- 7,142,806 · +28.2%
- By 2050
- 8,185,864 · +46.9%
- By 2075
- 10,574,329 · +89.8%
- By 2100
- 12,109,958 · +117.4%
Race, ethnicity, and origin ACS 2023
- Neighborhood character
- Diverse neighborhood (Simpson 0.61)
- Race & ethnicity
- Hispanic / Latino 57% Two or more races 25% Black 20% White 14% Asian 7%
- Hispanic origin (detail)
- Mexican 27%
- Common ancestry
- Italian 1% Lithuanian 1%
- Foreign-born
- 42% · Canada, Jamaica, Vietnam
- Languages at home
- 42% English-only · Spanish 48% Vietnamese 2% Other Indo-European 2%
Political lean MEDSL · Harris
- 2024 margin
- Lean D (+5.5) · D 52.0% · R 46.4% · Other 1.6%
- 2008→2024 swing
- +3.9pp toward D · 2008: 1.6pp · 2024: 5.5pp
- All cycles
- 2024: D+5.5 2020: D+13.3 2016: D+12.4 2012: D+0.1 2008: D+1.6
Not yet ingested
- Civics
- —
Market trends
- HPI YoY
- ▲ 0.38%
- Current HPI
- 235.9144
- Rent YoY
- —
- Metro
- —
- State GDP YoY
- ▲ 3.95%
- F500 in state
- 110
Industry mix (Fortune 500 HQ in TX)
| Industry | F500 HQs | Revenue |
|---|---|---|
| Energy | 16 | $1,198B |
|
||
| Technology | 5 | $198B |
|
||
| Engineering / Construction | 4 | $72B |
|
||
| Energy Services | 3 | $60B |
|
||
| Utilities | 3 | $41B |
|
||
| Healthcare | 2 | $330B |
|
||
Price history
-6.1% since first listed7 events — show timeline
- 2025-10-02 Listed $108,000 HARMLS
- 2025-10-02 Listing Removed — HARMLS
- 2025-10-01 Price Changed $108,000 HARMLS
- 2025-08-07 Listed $115,000 HARMLS
- 2005-08-23 Sold (Public Records) — Public Records
- 2005-07-06 Sold (Public Records) — Public Records
- 2000-07-11 Sold (Public Records) — Public Records
Property tax history
+5.2%/yrLatest (2025): $2,381 · +1.5% YoY. Source: county tax records.
Cash-flow waterfall
monthlySold comps — $/sqft
last 12 mo · ≤1 miLoading sold comps…