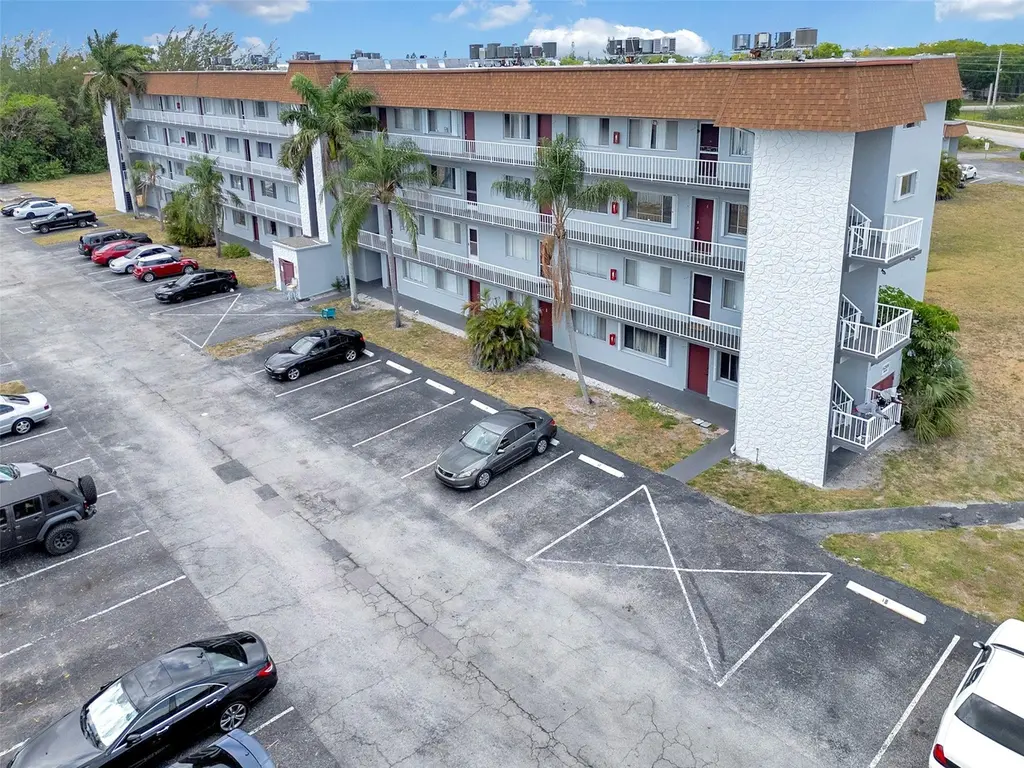
6289 Lear Dr #403 · Atlantis, FL
Flood risk 6/10 · Moderate
- FEMA flood zone
- X (unshaded)
- Chance of flooding over 30 yrs
- 0.69%
- Est. flood insurance / yr
- $507 – $1,088
Fire risk 1/10 · Minimal
- Est. fire insurance / yr
- $947 – $1,759
Heat risk 9/10 · Severe
- Hot days now (above 105°F)
- 7 days/yr
- Hot days in 30 yrs
- 26 days/yr
Wind risk 10/10 · Severe
- Chance of severe wind over 30 yrs
- 99.0%
Air-quality risk 2/10 · Minimal
- Unhealthy air days now
- 0 days/yr
- Unhealthy air days in 30 yrs
- 2 days/yr
Risk factors via First Street. Map © Google.
Why this score? — see what drove the C- grade
The composite is a weighted blend of 9 inputs, each scored 0–100. Each bar is that input's sub-score; the figure is the points it added to the 100-point composite (weight × sub-score).
- Cash flow +15.1/30.0
- 1% rule +10.0/10.0
- ARV discount +7.5/15.0
- DSCR +4.6/10.0
- Schools +4.3/10.0
- Livability +3.6/5.0
- Rent growth +3.5/5.0
- Condition / age +2.5/5.0
- Appreciation +0.0/10.0
$110,000
🖨 Deal sheet 📄 Offer letter ✓ Due diligence
Listing remarks MLS
Nice top floor unit with great views and nice breeze. Quiet neighborhood with no thru traffic. Nice swimming pool and at the clubhouse gym and saunas.
Key facts
- New a/c unit
- Elevator
- Prime location
Tags
Property features AI
Finance
- Other: Pets allowed with breed restrictions
- HOA & community: Has association; Monthly HOA fee; HOA amenities include parking and pool; HOA fee includes trash, water, common areas, elevator, pool service
Exterior
- Parking: Assigned parking; Guest parking; Open parking; 1 parking space total
- Utilities: Public water; Public sewer; Cable available; Water available
- Home design: Condominium; Resale condition; 4-story building; Faces northwest
- Construction: CBS construction
- Exterior features: No waterfront; None waterfront features; Shingle roof
Interior
- Kitchen: Dishwasher; Electric range; Microwave; Refrigerator
- Bedrooms: 3 main-level bedrooms
- Flooring: Laminate; Tile; Wood
- Bathrooms: 2 full bathrooms
- Heating & cooling: Central heating; Central air; Ceiling fans
- Interior features: Walk-in closets
- Laundry & utility: Laundry closet; Inside laundry; Laundry room; Outside laundry access
Neighborhood map
What this means for you Summary
Snapshot
- This is a 3-bed/2.0-bath condo listed at $110k.
Deal economics
- At list price, monthly cash flow is $36 ($438/yr) — positive.
- The deal already cash-flows at list — no discount required.
- Meets the 1% rule at list price ($2k rent vs $110k).
- Recommended offer: $103k (6.0% below list) — sets the bar for market timing.
Location & tenants
- Location reads 71/100 on livability (#390 in FL) — a middle-class / working-renter tenant base. Strengths: crime A+, employment A+, housing A+; Watch: amenities F, commute F, cost of living F.
- Palm Beach (suburban): math 46% / reading 53% proficiency, ranked #34 of 73 in FL (top 47%) — families likely to look elsewhere, expect single-tenant / working-renter base with shorter leases.
- Zoned schools: Starlight Cove Elementary School (math 40% / reading 31%, grade F, #1,684 of 2,144 statewide, top 79%, 737 students, 77% FRL); Santaluces Community High (math 22% / reading 39%, grade F, #434 of 667 statewide, top 66%, 2,675 students, 61% FRL) — zoned schools average 69% FRL vs 52% district-wide (17 pts higher); higher-poverty schools than district average — tighter screening recommended.
- Zoned-school proficiency averages 33% at this address vs 50% district-wide (-16 pts) — the specific schools serving this property underperform the Palm Beach average; the district grade overstates school quality for this exact location.
- Market conditions: Rents rising fast (+4.1%/yr); 383 active listings in the ZIP; 33 comparable units currently listed for rent nearby; rentals at typical pace (median 22d on market — plan ~3-4 weeks tenant-placement turnaround); 3,974 units permitted in Palm Beach County in 2024 (1,012 in 5+ unit buildings).
- This rent runs 40% of the median local income ($74k/yr) — at the standard rent-burdened threshold; future hikes will face affordability resistance.
Forward outlook
- Local home prices are declining (-3.0%/yr); year-one equity from $761 of loan paydown is wiped out by about $3k of value loss. Plan a longer hold.
- Palm Beach County population projected at +30% by 2050 — long-run rental-demand tailwind backs the buy-and-hold thesis.
Negotiation context
- It's been on market 66 days — a 6% lower offer ($103k) is reasonable based on typical stale-listing flexibility.
- 6 sale attempts since 26y ago; this cycle's ask has dropped $70k (39%) from the opening price — seller is motivated, your offer sets the floor, not the list.
Risks & watch-outs
- Watch-outs: property tax is 2.6% of price; HOA is 43% of rent.
- Climate carrying-cost: major flood risk; severe wind risk, 99% chance of damaging wind over 30y; extreme-heat days projected 7→26/yr by 2055 (HVAC capex compounding) — expect insurance premiums to compound above CPI over the hold.
Questions for the listing agent
- It's been on market 66 days. Have you received any prior offers? Is the seller open to a 6% concession, seller financing, or rate buy-down credit?
- Built in 1973 — when were the roof, HVAC, electrical panel, plumbing, and water heater last replaced?
- Property tax is high relative to price — has the assessment been appealed recently, and will the sale trigger a re-assessment?
- What does the HOA fee cover, when was the last increase, and are there any pending special assessments or reserve-fund shortfalls?
- Any open or pending special assessments — roof, HVAC, plumbing, elevator, façade? What's the per-unit balance and payoff schedule, and is the seller paying it off at close or rolling it to the buyer?
- Why hasn't it sold? Are there any deal-killer items the seller is aware of (foundation, flood, title, zoning, code violations)?
- Is there a deadline driving the sale (1031 exchange, divorce, estate, relocation)? That informs how much negotiation room exists.
- What's the average days-on-market for RENTAL listings here right now (not sales)? A rising rental-DOM trend means longer vacancies and softer asking-rent achievability than the comps imply.
- What's the recent tenant-quality profile in this submarket — average credit score on applications, eviction rate, late-payment / NSF rate, and stable-employment percentage? A property-management company in the area should have these aggregated.
- How much new apartment / multifamily construction is in the pipeline within 1–3 miles? Heavy new supply (>2% of stock underway) typically softens rents 12–24 months out; light construction supports rent growth.
Investment metrics
- 1% rule
- 2.26% ✓
- Cap rate
- 6.69%
- Cash-on-cash
- 1.42%
- DSCR
- 1.06
- GRM
- 3.7
CMA / ARV
No comps found within radius.
Projected returns pro-forma
-3.0% appreciation · 4.09% rent growth · sell at horizon
- IRR
- -10.4%
- Equity multiple
- 0.61×
- Total profit
- $-11,998
- Equity at exit
- $16,401
- IRR
- 2.8%
- Equity multiple
- 1.23×
- Total profit
- $7,140
- Equity at exit
- $9,511
Cash invested: $30,800 (down + closing). Projections, not guarantees.
Landlord ↔ Tenant lean methodology
- Overall (STATE)
- 87 Strongly Landlord-Friendly
- State Florida
- 87 Strongly Landlord-Friendly · R+3
- County
- — inherits STATE
- City
- — inherits STATE
ZIP-level market 33462
- Rents YoY
- 4.1%
- Active inventory
- 383
- Price-to-rent
- 3.7×
Monthly cashflow live
- Estimated rent
- $2,481 high interval (Pro) →
- Mortgage (P&I)
- −$577
- Tax from tax record
- −$235 /mo · $2,817/yr
- Insurance
- −$46
- HOA
- −$1,066
- Vacancy / Maint / Mgmt
- −$521
- Net cashflow
- $36
Break-even live
UW: 25.0% down · 7.5% · 30yr · 1.5% tax · 5.0% vac · 8.0% maint · 8.0% mgmt
Financing live
Cash to close
- Down payment
- $27,500
- Closing costs
- $3,300
- Reserves months
- —
- Total cash needed
- —
Loan-product check · same deal, 3 products live
Conventional
25% down · 7.5% · 30yr
- Down + closing
- —
- Monthly P&I
- —
- Monthly cashflow
- —
- DSCR
- —
- Eligible?
- —
Personal DTI + credit; lowest rate.
DSCR
20% down · 8.5% · 30yr
- Down + closing
- —
- Monthly P&I
- —
- Monthly cashflow
- —
- DSCR
- —
- Eligible?
- —
No personal income docs; deal must DSCR.
Hard money
10% down · 12.0% · 12mo
- Down + closing
- —
- Monthly P&I
- —
- Monthly cashflow
- —
- DSCR
- —
- Eligible?
- —
Short-term bridge; refi at stabilization.
Rent comps 33 comps
| Address | Beds | Baths | Sqft | Rent | $/sqft | DOM | Units | Dist |
|---|---|---|---|---|---|---|---|---|
| 6289 Lear Dr Lake Worth, FL | 1.0–3.0 | 1.0–2.0 | 792 | $2,200 | $2.78 | 15d | 2 | 0.02mi |
| 6289 Lear Dr #203 Lake Worth, FL | 3.0 | 2.0 | 1044 | $2,200 | $2.11 | 24d | 1 | 0.03mi |
| 2780 Norfolk Pine Ct Lake Worth, FL | 2.0 | 2.0 | 1175 | $2,400 | $2.04 | 24d | 1 | 0.15mi |
| 6175 Reflections Blvd Lake Worth, FL | 1.0–2.0 | 1.0–2.0 | 814 | $2,307 | $2.83 | 1d | 15 | 0.24mi |
| 5981 Via Vermilya #203 Lake Worth, FL | 2.0 | 2.0 | 1130 | $1,975 | $1.75 | 24d | 1 | 0.41mi |
| 3327 Sapphire Rd Lake Worth, FL | 4.0 | 3.0 | 1377 | $3,350 | $2.43 | 2d | 1 | 0.70mi |
| 3327 Sapphire Rd Lake Worth, FL | 4.0 | 3.0 | 1377 | $3,400 | $2.47 | 11d | 1 | 0.70mi |
| 712 Meadows Cir Boynton Beach, FL | 2.0 | 2.0 | 921 | $2,400 | $2.61 | 24d | 1 | 0.81mi |
| 6511 Seminole Dr Unit 2 Atlantis, FL | 2.0 | 1.0 | 845 | $2,150 | $2.54 | 5d | 1 | 0.84mi |
| 58 Paxford Ln Boynton Beach, FL | 2.0 | 2.0 | 1230 | $900 | $0.73 | 12d | 1 | 0.87mi |
| 88 Buxton Ln Boynton Beach, FL | 3.0 | 2.0 | 1448 | $3,100 | $2.14 | 24d | 1 | 0.89mi |
| 1106 Meadows Cir Boynton Beach, FL | 2.0 | 2.0 | 900 | $1,895 | $2.11 | 22d | 1 | 0.93mi |
| 1106 Meadows Cir Boynton Beach, FL | 2.0 | 2.0 | 900 | $1,850 | $2.06 | 3d | 1 | 0.93mi |
| 580 Tallulah Rd Lake Worth, FL | 2.0 | 1.0 | 750 | $2,500 | $3.33 | 22d | 1 | 0.99mi |
| 1120 Meadows Cir Unit 1120 Boynton Beach, FL | 2.0 | 2.0 | 900 | $1,980 | $2.20 | 24d | 1 | 0.99mi |
| 1205 Meadows Cir Boynton Beach, FL | 2.0 | 2.0 | 909 | $1,900 | $2.09 | 24d | 1 | 0.99mi |
| 316 Meadows Cir #316 Boynton Beach, FL | 2.0 | 2.0 | 921 | $2,100 | $2.28 | 2d | 1 | 0.99mi |
| 3883 Island Club Cir W Lake Worth, FL | 3.0 | 2.5 | 1308 | $2,400 | $1.83 | 17d | 1 | 1.03mi |
| 423 Pine Tree Ct #23 Lake Worth, FL | 2.0 | 2.0 | 1222 | $2,300 | $1.88 | 22d | 1 | 1.08mi |
| 7093 Middlebury Dr Unit 7093 Boynton Beach, FL | 4.0 | 2.0 | 1470 | $3,000 | $2.04 | 24d | 1 | 1.13mi |
| 6411 Birch Ln Lake Worth, FL | 3.0 | 2.0 | 1200 | $1,800 | $1.50 | 24d | 1 | 1.14mi |
| 5 Heather Trace Dr Boynton Beach, FL | 3.0 | 2.0 | 1454 | $3,100 | $2.13 | 22d | 1 | 1.20mi |
| 6 Hammond Pl Boynton Beach, FL | 3.0 | 2.0 | 1409 | $3,160 | $2.24 | 11d | 1 | 1.22mi |
| 2640 South Dr Unit 301 Lake Worth Beach, FL | 2.0 | 1.0 | 894 | $1,500 | $1.68 | 18d | 1 | 1.28mi |
| 2640 South Dr Unit 301 Lake Worth Beach, FL | 2.0 | 1.0 | 894 | $1,500 | $1.68 | 15d | 1 | 1.28mi |
| 3901 Medford Ct Boynton Beach, FL | 2.0 | 2.5 | 1374 | $2,650 | $1.93 | 24d | 1 | 1.31mi |
| 3901 Medford Ct Boynton Beach, FL | 2.0 | 2.5 | 1374 | $2,650 | $1.93 | 5d | 1 | 1.31mi |
| 9 Walcott Dr Boynton Beach, FL | 2.0 | 2.0 | 1222 | $2,550 | $2.09 | 24d | 1 | 1.35mi |
| 6040 Lace Wood Cir Lake Worth, FL | 3.0 | 2.0 | 1326 | $2,799 | $2.11 | 24d | 1 | 1.39mi |
| 1036 S 14th St Lantana, FL | 3.0 | 2.0 | 1362 | $3,500 | $2.57 | 24d | 1 | 1.40mi |
| 1821 Montague St Lake Worth Beach, FL | 4.0 | 2.0 | 1220 | $2,700 | $2.21 | 12d | 1 | 1.43mi |
| 1821 Montague St Lake Worth Beach, FL | 4.0 | 2.0 | 1220 | $2,700 | $2.21 | 20d | 1 | 1.43mi |
| 3 Afton Pl Boynton Beach, FL | 2.0 | 2.0 | 1196 | $2,645 | $2.21 | 18d | 1 | 1.44mi |
HOA detail condo
- Monthly dues
- $1,066 · $12,792/yr
- Likely covers
- poolgym
- Assessments
- None detected in remarks — confirm with the listing agent.
Listing history 37 events
-
2026-06-18days on market $110,000 Active 66 DOM
-
2026-06-17remarks 642-char remark
-
2026-06-17days on market $110,000 Active 65 DOM
-
2026-06-16days on market $110,000 Active 64 DOM
-
2026-06-16price $110,000 Active 63 DOM
-
2026-06-15days on market $160,000 Active 63 DOM
-
2026-06-13days on market $160,000 Active 61 DOM
-
2026-06-09days on market $160,000 Active 57 DOM
-
2026-06-08days on market $160,000 Active 56 DOM
-
2026-06-07days on market $160,000 Active 55 DOM
-
2026-06-04pricedays on market $160,000 Active 52 DOM
-
2026-06-03days on market $180,000 Active 51 DOM
-
2026-06-02days on market $180,000 Active 50 DOM
-
2026-06-01days on market $180,000 Active 49 DOM
-
2026-05-31days on market $180,000 Active 48 DOM
-
2026-04-10$180,000 Active
-
2024-09-11historical $2,250
-
2024-08-30price $2,250
-
2024-07-23price $2,350
-
2024-07-04price $2,450
-
2024-06-05price $2,500
-
2024-05-16$2,600
-
2018-04-11soldstatus $110,000
-
2018-04-09soldstatus $110,000 Closed 150-char remark
Show marketing remark (150 chars)
Nice top floor unit with great views and nice breeze. Quiet neighborhood with no thru traffic. Nice swimming pool and at the clubhouse gym and saunas.
-
2018-03-06status Pending 150-char remark
Show marketing remark (150 chars)
Nice top floor unit with great views and nice breeze. Quiet neighborhood with no thru traffic. Nice swimming pool and at the clubhouse gym and saunas.
-
2018-02-19$120,000 Active 150-char remark
Show marketing remark (150 chars)
Nice top floor unit with great views and nice breeze. Quiet neighborhood with no thru traffic. Nice swimming pool and at the clubhouse gym and saunas.
-
2017-09-18historical
-
2017-04-24price $124,900
-
2017-03-21$129,900 Active
-
2001-08-15soldstatus $72,000
-
2001-07-31soldstatus $72,000
-
2001-06-27historical
-
2001-02-16$75,000
-
2000-05-26soldstatus $57,000
-
2000-05-23soldstatus $57,000
-
2000-04-24historical
-
2000-02-18$59,900
ⓘ Source: listings_history table (triggers on properties + properties_extension) + one-shot
backfill from property_details.listing_events for pre-trigger history.
Tax reassessment forecast FL · Resets to sale price
- Current annual tax
- $2,817 · $235/mo
- Projected year-2 tax
- $2,817 · $235/mo
- Expected delta
- $0/yr ($0/mo · 0.0%)
ⓘ Screening estimate from a state-policy table — verify with the county assessor before closing.
Climate risk First Street
- Flood 6/10 Major FEMA zone X (unshaded) · 69% chance over 30 yrs
- Wildfire 1/10 Low
- Heat 9/10 Extreme 7 d/yr ≥105°F today · 26 d/yr by 30 yrs out
- Wind 10/10 Extreme 99% chance of damaging wind over 30 yrs
- Air quality 2/10 Low 0 unhealthy d/yr today · 2 by 30 yrs out
Nearby sold comps map
Loading sold comps map…
Walkable amenities ~0.75 mi
Loading nearby amenities…
Taxation est. · year 1
- Rental income
- $29,771
- − Mortgage interest
- −$6,162
- − Property taxes
- −$2,817
- − Insurance
- −$550
- − Repairs & maintenance
- −$2,382
- − Management
- −$2,382
- − HOA
- −$12,792
- − Depreciation
- −$3,200
- Taxable loss
- −$513
- Est. tax savings @ 24.0%
- +$123
- After-tax cash flow
- $561/yr
For passive investors: Depreciation is non-cash, so a rental often shows a tax loss while cash-flowing — sheltering income. Rental losses are passive: they offset passive income freely, and up to $25,000/yr can offset ordinary (W-2) income if you actively participate and your MAGI is under $100k (phasing out to $0 by $150k); unused losses carry forward. On sale, claimed depreciation is recaptured at up to 25%, and gains may owe capital-gains tax (a 1031 exchange can defer both). Figures are a year-1 estimate at your 24.0% rate — not tax advice; consult a CPA.
Schools (NCES district)
- District
- Palm Beach
- NCES district ID
- 1201500
- Math proficiency
- 46% ▼ -16.00%
- Reading proficiency
- 53% ▼ -4.00%
- Median HH income
- $53,943
- Composite
- 42.72/100
- National rank
- #3160
- State rank
- #34 of 73 in FL
Livability — Atlantis
- Score
- 71/100
- State rank
- #390
- US rank
- #6861
Category grades
Schools grade is shown separately in the Schools card above.
Census & demographics
- County
- Palm Beach County · 1,438,312 people
- Metro
- Miami-Fort Lauderdale-Pompano Beach, FL
- Population (ZIP)
- 33,371
- Household income
- $73,997
- Rent vs Own
- Severe rent burden
- 1852.0
Population outlook (Palm Beach County) Hauer SSP2
- Today (2025)
- 1,637,487 people
- By 2030
- 1,743,255 · +6.5%
- By 2040
- 1,948,712 · +19.0%
- By 2050
- 2,132,979 · +30.3%
- By 2075
- 2,530,027 · +54.5%
- By 2100
- 2,706,979 · +65.3%
Race, ethnicity, and origin ACS 2023
- Neighborhood character
- Diverse neighborhood (Simpson 0.68)
- Race & ethnicity
- White 44% Black 26% Hispanic / Latino 26% Two or more races 11% Asian 2%
- Hispanic origin (detail)
- Mexican 8% Puerto Rican 5% Cuban 3%
- Common ancestry
- Hispanic 14% Romanian 2% Scotch-Irish 2%
- Foreign-born
- 31% · Canada, Jamaica, Dominican Republic
- Languages at home
- 60% English-only · Spanish 20% French/Haitian/Cajun 16% Other Indo-European 1%
Political lean MEDSL · Palm Beach
- 2024 margin
- Toss-up / Even · D 50.0% · R 49.2%
- 2008→2024 swing
- -22.1pp toward R · 2008: 22.9pp · 2024: 0.8pp
- All cycles
- 2024: D+0.8 2020: D+12.8 2016: D+15.3 2012: D+17.0 2008: D+22.9
Not yet ingested
- Civics
- —
Market trends
- HPI YoY
- ▼ -295.48%
- Current HPI
- 361.5391
- Rent YoY
- ▲ 4.09%
- Metro
- Miami-Fort Lauderdale-Pompano Beach, FL
- State GDP YoY
- ▲ 3.28%
- F500 in state
- 36
Industry mix (Fortune 500 HQ in FL)
| Industry | F500 HQs | Revenue |
|---|---|---|
| Industrial Technology | 2 | $29B |
|
||
| Insurance | 2 | $17B |
|
||
| Retail | 1 | $60B |
|
||
| Technology Distribution | 1 | $58B |
|
||
| Homebuilding | 1 | $35B |
|
||
| Technology Manufacturing | 1 | $35B |
|
||
Price history
+200.5% since first listed22 events — show timeline
- 2026-04-10 Listed $180,000 Beaches MLS
- 2024-09-11 Rental Removed $2,250 GFLMLS
- 2024-08-30 Price Changed $2,250 GFLMLS
- 2024-07-23 Price Changed $2,350 GFLMLS
- 2024-07-04 Price Changed $2,450 GFLMLS
- 2024-06-05 Price Changed $2,500 GFLMLS
- 2024-05-16 Listed for Rent $2,600 GFLMLS
- 2018-04-11 Sold (Public Records) $110,000 Public Records
- 2018-04-09 Sold (MLS) $110,000 Beaches MLS
- 2018-03-06 Pending — Beaches MLS
- 2018-02-19 Listed $120,000 Beaches MLS
- 2017-09-18 Listing Removed — Beaches MLS
- 2017-04-24 Price Changed $124,900 Beaches MLS
- 2017-03-21 Listed $129,900 Beaches MLS
- 2001-08-15 Sold (Public Records) $72,000 Public Records
- 2001-07-31 Sold (MLS) $72,000 Beaches MLS
- 2001-06-27 Listing Removed — Beaches MLS
- 2001-02-16 Listed $75,000 Beaches MLS
- 2000-05-26 Sold (Public Records) $57,000 Public Records
- 2000-05-23 Sold (MLS) $57,000 Beaches MLS
- 2000-04-24 Listing Removed — Beaches MLS
- 2000-02-18 Listed $59,900 Beaches MLS
Property tax history
+10.6%/yrLatest (2025): $2,817 · +1.8% YoY. Source: county tax records.
Cash-flow waterfall
monthlySold comps — $/sqft
last 12 mo · ≤1 miLoading sold comps…