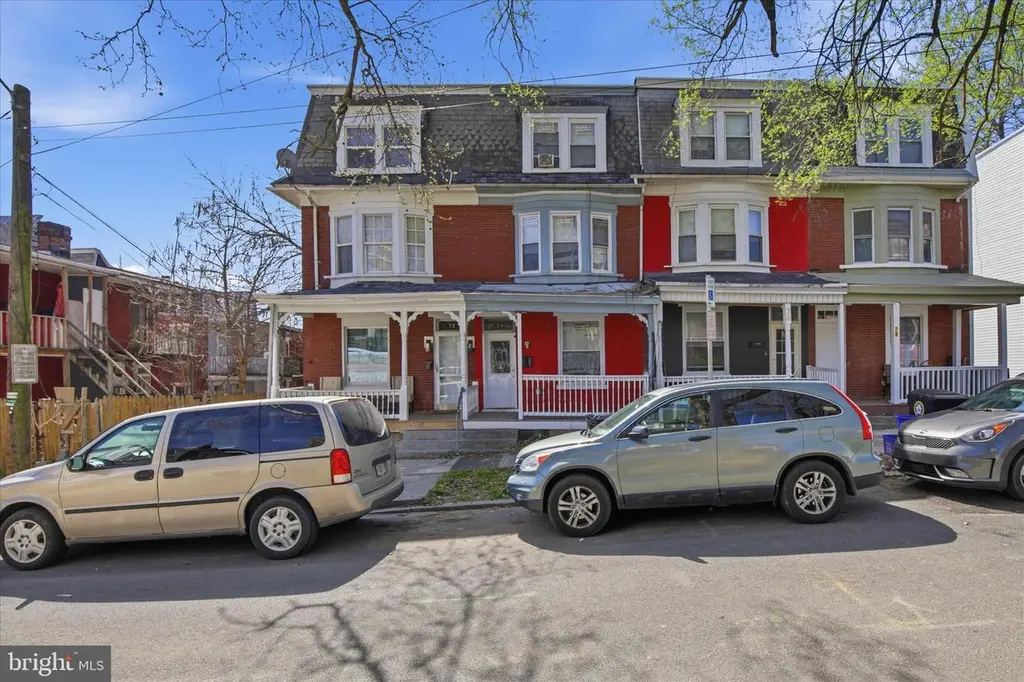
74 Reservoir St · Harrisburg, PA
Flood risk 1/10 · Minimal
- FEMA flood zone
- X (unshaded)
- Chance of flooding over 30 yrs
- 0.0%
- Est. flood insurance / yr
- $473 – $860
Fire risk 1/10 · Minimal
- Est. fire insurance / yr
- $511 – $949
Heat risk 5/10 · Moderate
- Hot days now (above 100°F)
- 7 days/yr
- Hot days in 30 yrs
- 15 days/yr
Wind risk 3/10 · Minor
- Chance of severe wind over 30 yrs
- 6.0%
Air-quality risk 2/10 · Minimal
- Unhealthy air days now
- 1 days/yr
- Unhealthy air days in 30 yrs
- 3 days/yr
Risk factors via First Street. Map © Google.
Why this score? — see what drove the B- grade
The composite is a weighted blend of 9 inputs, each scored 0–100. Each bar is that input's sub-score; the figure is the points it added to the 100-point composite (weight × sub-score).
- Cash flow +30.0/30.0
- 1% rule +10.0/10.0
- DSCR +10.0/10.0
- Rent growth +4.8/5.0
- Livability +4.2/5.0
- ARV discount +3.3/15.0
- Condition / age +2.5/5.0
- Schools +0.8/10.0
- Appreciation +0.0/10.0
$122,200
🖨 Deal sheet 📄 Offer letter ✓ Due diligence
Listing remarks MLS
Schedule your showing now! Great opportunity to own a versatile property in a prime location at 74 Reservoir St. Ideal for both owner-occupants and investors, this property offers strong potential for personal use, rental income, or a combination of both. Washed and Dryer are included in the purchase. Conveniently located just around the corner from Market St, you’ll enjoy easy access to shopping, dining, and everyday amenities. Offered at an attractive price, this is an excellent opportunity you won’t want to miss.
Key facts
- Built 1910
- Listed 70 days
Neighborhood map
What this means for you Summary
Snapshot
- This is a 5-bed/1.0-bath single-family listed at $122k.
Deal economics
- At list price, monthly cash flow is $695 ($8k/yr) — positive.
- The deal already cash-flows at list — no discount required.
- Meets the 1% rule at list price ($2k rent vs $122k).
- Recommended offer: $115k (6.0% below list) — sets the bar for market timing.
- Cap rate 13.1% vs local median 6.6% in Harrisburg — top-decile yield for the area; either an underpriced asset or a hidden risk that comps aren't pricing in. Stress-test before assuming the spread holds.
Location & tenants
- Location reads 84/100 on livability (#107 in PA, #826 nationally) — a professional / high-income tenant draw. Strengths: amenities A+, commute A+, cost of living A+; Watch: schools C-, employment D, crime F.
- Harrisburg City SD (urban): math 6% / reading 13% proficiency, ranked #535 of 539 in PA (top 99%) — low school quality limits family demand, transient renter base, plan for 1-2y turnover; 82% free/reduced lunch — lower-income household profile, screen leases tightly.
- Market conditions: Rents rising fast (+9.1%/yr); 66 active listings in the ZIP; 15 comparable units currently listed for rent nearby; rentals at typical pace (median 24d on market — plan ~3-4 weeks tenant-placement turnaround); lower-income renter base — watch delinquency; 540 units permitted in Dauphin County in 2024 (194 in 5+ unit buildings).
- At $1,901/mo this rent would consume 57% of the median local household income ($40k/yr) (locally 1014% of renters already pay >50% of income on rent) — very limited rent-growth headroom before tenants either downsize or default.
Forward outlook
- Local home prices are declining (-3.0%/yr); year-one equity from $845 of loan paydown is wiped out by about $4k of value loss. Plan a longer hold.
- At projected returns (-3.0% appreciation + 8.0% rent growth), your $34k cash investment doubles in ~5 years — after that, you're playing with house money.
Negotiation context
- It's been on market 70 days — a 6% lower offer ($115k) is reasonable based on typical stale-listing flexibility.
- Current owner paid $25k; list at $122k implies a 389% gain — meaningful room to come down on a strong offer.
Risks & watch-outs
- Watch-outs: built in 1910 — expect roof / HVAC / electrical / plumbing capex.
- Climate carrying-cost: extreme-heat days projected 7→15/yr by 2055 (HVAC capex compounding) — expect insurance premiums to compound above CPI over the hold.
Questions for the listing agent
- It's been on market 70 days. Have you received any prior offers? Is the seller open to a 6% concession, seller financing, or rate buy-down credit?
- Built in 1910 — when were the roof, HVAC, electrical panel, plumbing, and water heater last replaced?
- Why hasn't it sold? Are there any deal-killer items the seller is aware of (foundation, flood, title, zoning, code violations)?
- Is there a deadline driving the sale (1031 exchange, divorce, estate, relocation)? That informs how much negotiation room exists.
- Crime grade is F in this area — have there been break-ins, vandalism, or insurance claims at this property in the last 3 years? What carrier currently insures it and at what premium?
- What's the average days-on-market for RENTAL listings here right now (not sales)? A rising rental-DOM trend means longer vacancies and softer asking-rent achievability than the comps imply.
- What's the recent tenant-quality profile in this submarket — average credit score on applications, eviction rate, late-payment / NSF rate, and stable-employment percentage? A property-management company in the area should have these aggregated.
- How much new for-sale + rental construction is in the pipeline within 1–3 miles? Heavy new supply typically softens prices + rents 12–24 months out; constrained supply supports both.
Investment metrics
- 1% rule
- 1.56% ✓
- Cap rate
- 13.12%
- Cash-on-cash
- 24.37%
- DSCR
- 2.08
- GRM
- 5.4
CMA / ARV
- ARV (median comp)
- $111,697
- List price
- $122,200
- Delta
- 9.40%
- Verdict
- FAIR
- Comps
- 20 within 1.0 mi
Show comp detail 10 sales within ~0.75 mi
| Address | Dist | Beds/Ba | Sqft | Sold | Price | $/sf | Match |
|---|---|---|---|---|---|---|---|
| 2012 North St | 0.34mi | 6/— (+1) | 1,818 (+3%) | 1mo | $145,000 | $80 | 73 |
| 1714 Boas St | 0.43mi | 5/1.5 | 1,823 (+3%) | 11mo | $240,000 | $132 | 63 |
| 1925 Whitehall St | 0.15mi | 4/3.0 (-1) | 1,693 (-4%) | 13mo | $207,000 | $122 | 63 |
| 1902 Rudy Rd | 0.50mi | 4/2.0 (-1) | 1,708 (-3%) | 5mo | $248,000 | $145 | 58 |
| 2234 Boas St | 0.70mi | 4/2.0 (-1) | 1,748 (-1%) | 2mo | $270,000 | $154 | 55 |
| 1435 Vernon St | 0.44mi | 4/1.0 (-1) | 1,887 (+7%) | 15mo | $159,000 | $84 | 51 |
| 1923 Whitehall St | 0.14mi | 4/1.5 (-1) | 2,002 (+14%) | 19mo | $200,000 | $100 | 48 |
| 2301 Hoffer St | 0.59mi | 4/2.0 (-1) | 1,737 (-2%) | 23mo | $185,500 | $107 | 42 |
| 336 S 14th St | 0.63mi | 5/2.0 | 2,003 (+14%) | 15mo | $60,850 | $30 | 31 |
| 1939 Boas St | 0.44mi | 4/2.0 (-1) | 1,531 (-13%) | 22mo | $45,250 | $30 | 30 |
Match score weights: distance 35% · size 25% · config 20% · recency 20%. Top-matched comps best support the ARV.
Projected returns pro-forma
-3.0% appreciation · 8.0% rent growth · sell at horizon
- IRR
- 23.1%
- Equity multiple
- 2.01×
- Total profit
- $34,511
- Equity at exit
- $18,220
- IRR
- 34.1%
- Equity multiple
- 4.88×
- Total profit
- $132,787
- Equity at exit
- $10,566
Cash invested: $34,216 (down + closing). Projections, not guarantees.
Landlord ↔ Tenant lean methodology
- Overall (STATE)
- 62 Landlord-Friendly
- State Pennsylvania
- 62 Landlord-Friendly · EVEN
- County
- — inherits STATE
- City
- — inherits STATE
ZIP-level market 17103
- Rents YoY
- 9.1%
- Active inventory
- 66
- Price-to-rent
- 5.4×
Monthly cashflow live
- Estimated rent
- $1,901 high interval (Pro) →
- Mortgage (P&I)
- −$641
- Tax from tax record
- −$115 /mo · $1,379/yr
- Insurance
- −$51
- HOA
- −$0
- Vacancy / Maint / Mgmt
- −$399
- Net cashflow
- $695
Break-even live
UW: 25.0% down · 7.5% · 30yr · 1.5% tax · 5.0% vac · 8.0% maint · 8.0% mgmt
Financing live
Cash to close
- Down payment
- $30,550
- Closing costs
- $3,666
- Reserves months
- —
- Total cash needed
- —
Loan-product check · same deal, 3 products live
Conventional
25% down · 7.5% · 30yr
- Down + closing
- —
- Monthly P&I
- —
- Monthly cashflow
- —
- DSCR
- —
- Eligible?
- —
Personal DTI + credit; lowest rate.
DSCR
20% down · 8.5% · 30yr
- Down + closing
- —
- Monthly P&I
- —
- Monthly cashflow
- —
- DSCR
- —
- Eligible?
- —
No personal income docs; deal must DSCR.
Hard money
10% down · 12.0% · 12mo
- Down + closing
- —
- Monthly P&I
- —
- Monthly cashflow
- —
- DSCR
- —
- Eligible?
- —
Short-term bridge; refi at stabilization.
Rent comps 15 comps
| Address | Beds | Baths | Sqft | Rent | $/sqft | DOM | Units | Dist |
|---|---|---|---|---|---|---|---|---|
| 66 N 17th St Harrisburg, PA | 5.0 | 2.0 | 1845 | $2,195 | $1.19 | 44d | 1 | 0.11mi |
| 111 N 17th St Harrisburg, PA | 5.0 | 1.0 | 1800 | $1,850 | $1.03 | 14d | 1 | 0.13mi |
| 1708 State St Harrisburg, PA | 5.0 | 1.5 | 2320 | $1,745 | $0.75 | 21d | 1 | 0.18mi |
| 14 S 17th St Harrisburg, PA | 5.0 | 2.0 | 2136 | $1,695 | $0.79 | 14d | 1 | 0.22mi |
| 29 S 15th St Harrisburg, PA | 5.0 | 1.0 | 1285 | $1,895 | $1.47 | 23d | 1 | 0.32mi |
| 1207 Market St Harrisburg, PA | 4.0 | 1.5 | 1423 | $1,995 | $1.40 | 44d | 1 | 0.52mi |
| 1610 Hunter St Harrisburg, PA | 4.0 | 1.0 | 1776 | $1,450 | $0.82 | 23d | 1 | 0.62mi |
| 1414 Berryhill St Harrisburg, PA | 5.0 | 2.0 | 1786 | $1,700 | $0.95 | 23d | 1 | 0.71mi |
| 2368 Canby St Harrisburg, PA | 6.0 | 2.0 | 2142 | $2,300 | $1.07 | 21d | 1 | 0.84mi |
| 301 Chestnut St Harrisburg, PA | 1.0–4.0 | 1.0–2.5 | 1437 | $2,600 | $1.81 | 44d | 1 | 1.04mi |
| 301 Chestnut St Harrisburg, PA | 4.0 | 1.0–2.5 | 1437 | $3,000 | $2.09 | 14d | 10 | 1.04mi |
| 1716 N 6th St Unit NA Harrisburg, PA | 4.0 | 4.0 | 2400 | $2,000 | $0.83 | 23d | 1 | 1.36mi |
| 1716 N 6th St Harrisburg, PA | 4.0 | 3.5 | 2400 | $2,200 | $0.92 | 44d | 1 | 1.36mi |
| 1330 Susquehanna St Harrisburg, PA | 4.0 | 1.5 | 2280 | $1,895 | $0.83 | 23d | 1 | 1.39mi |
| 1202 Penn St Harrisburg, PA | 4.0 | 1.0 | 1706 | $1,495 | $0.88 | 44d | 1 | 1.41mi |
Listing history 20 events
-
2026-06-18days on market $122,200 Active 70 DOM
-
2026-06-17days on market $122,200 Active 69 DOM
-
2026-06-16days on market $122,200 Active 68 DOM
-
2026-06-15pricedays on market $122,200 Active 67 DOM
-
2026-06-14days on market $124,999 Active 65 DOM
-
2026-06-13days on market $124,999 Active 64 DOM
-
2026-06-10days on market $124,999 Active 62 DOM
-
2026-06-09days on market $124,999 Active 61 DOM
-
2026-06-08days on market $124,999 Active 60 DOM
-
2026-06-07days on market $124,999 Active 59 DOM
-
2026-06-03days on market $124,999 Active 55 DOM
-
2026-06-02days on market $124,999 Active 54 DOM
-
2026-06-01days on market $124,999 Active 53 DOM
-
2026-05-31days on market $124,999 Active 52 DOM
-
2026-05-31days on market $124,999 Active 51 DOM
-
2026-05-13price $129,999 533-char remark
Show marketing remark (533 chars)
Schedule your showing now! Great opportunity to own a versatile property in a prime location at 74 Reservoir St. Ideal for both owner-occupants and investors, this property offers strong potential for personal use, rental income, or a combination of both. Washed and Dryer are included in the purchase. Conveniently located just around the corner from Market St, you’ll enjoy easy access to shopping, dining, and everyday amenities. Offered at an attractive price, this is an excellent opportunity you won’t want to miss.
-
2026-04-11price $134,999 533-char remark
Show marketing remark (533 chars)
Schedule your showing now! Great opportunity to own a versatile property in a prime location at 74 Reservoir St. Ideal for both owner-occupants and investors, this property offers strong potential for personal use, rental income, or a combination of both. Washed and Dryer are included in the purchase. Conveniently located just around the corner from Market St, you’ll enjoy easy access to shopping, dining, and everyday amenities. Offered at an attractive price, this is an excellent opportunity you won’t want to miss.
-
2026-04-10$124,999 Active 533-char remark
Show marketing remark (533 chars)
Schedule your showing now! Great opportunity to own a versatile property in a prime location at 74 Reservoir St. Ideal for both owner-occupants and investors, this property offers strong potential for personal use, rental income, or a combination of both. Washed and Dryer are included in the purchase. Conveniently located just around the corner from Market St, you’ll enjoy easy access to shopping, dining, and everyday amenities. Offered at an attractive price, this is an excellent opportunity you won’t want to miss.
-
2026-04-08historical $124,999 533-char remark
Show marketing remark (533 chars)
Schedule your showing now! Great opportunity to own a versatile property in a prime location at 74 Reservoir St. Ideal for both owner-occupants and investors, this property offers strong potential for personal use, rental income, or a combination of both. Washed and Dryer are included in the purchase. Conveniently located just around the corner from Market St, you’ll enjoy easy access to shopping, dining, and everyday amenities. Offered at an attractive price, this is an excellent opportunity you won’t want to miss.
-
1989-02-16soldstatus $25,000
ⓘ Source: listings_history table (triggers on properties + properties_extension) + one-shot
backfill from property_details.listing_events for pre-trigger history.
Tax reassessment forecast PA · Partial reset (capped growth)
- Current annual tax
- $1,379 · $115/mo
- Projected year-2 tax
- $1,655 · $138/mo
- Expected delta
- +$276/yr (+$23/mo · 20.0%)
ⓘ Screening estimate from a state-policy table — verify with the county assessor before closing.
Climate risk First Street
- Flood 1/10 Low FEMA zone X (unshaded) · 0% chance over 30 yrs
- Wildfire 1/10 Low
- Heat 5/10 Major 7 d/yr ≥100°F today · 15 d/yr by 30 yrs out
- Wind 3/10 Moderate 6% chance of damaging wind over 30 yrs
- Air quality 2/10 Low 1 unhealthy d/yr today · 3 by 30 yrs out
Nearby sold comps map
Loading sold comps map…
Walkable amenities ~0.75 mi
Loading nearby amenities…
Taxation est. · year 1
- Rental income
- $22,809
- − Mortgage interest
- −$6,845
- − Property taxes
- −$1,379
- − Insurance
- −$611
- − Repairs & maintenance
- −$1,825
- − Management
- −$1,825
- − Depreciation
- −$3,555
- Taxable income
- $6,770
- Est. tax owed @ 24.0%
- −$1,625
- After-tax cash flow
- $6,715/yr
For passive investors: Depreciation is non-cash, so a rental often shows a tax loss while cash-flowing — sheltering income. Rental losses are passive: they offset passive income freely, and up to $25,000/yr can offset ordinary (W-2) income if you actively participate and your MAGI is under $100k (phasing out to $0 by $150k); unused losses carry forward. On sale, claimed depreciation is recaptured at up to 25%, and gains may owe capital-gains tax (a 1031 exchange can defer both). Figures are a year-1 estimate at your 24.0% rate — not tax advice; consult a CPA.
Schools (NCES district)
- District
- Harrisburg City SD
- NCES district ID
- 4211580
- Math proficiency
- 6% ▼ -6.00%
- Reading proficiency
- 13% ▼ -10.00%
- Median HH income
- $33,432
- Composite
- 7.6/100
- National rank
- #9945
- State rank
- #535 of 539 in PA
Livability — Harrisburg
- Score
- 84/100
- State rank
- #107
- US rank
- #826
Category grades
Schools grade is shown separately in the Schools card above.
Census & demographics
- Census place
- Harrisburg, PA
- County
- Dauphin County · 247,857 people
- City population
- 184,296
- Metro
- Harrisburg-Carlisle, PA
- Population (ZIP)
- 13,115
- Household income
- $39,825
- Rent vs Own
- Severe rent burden
- 1014.0
Population outlook (Dauphin County) Hauer SSP2
- Today (2025)
- 281,628 people
- By 2030
- 283,549 · +0.7%
- By 2040
- 285,385 · +1.3%
- By 2050
- 286,188 · +1.6%
- By 2075
- 291,053 · +3.3%
- By 2100
- 282,374 · +0.3%
Race, ethnicity, and origin ACS 2023
- Neighborhood character
- Diverse neighborhood (Simpson 0.66)
- Race & ethnicity
- Black 47% Hispanic / Latino 31% White 18% Two or more races 10%
- Hispanic origin (detail)
- Mexican 4% Puerto Rican 18% Dominican 5%
- Common ancestry
- Hispanic 1% Romanian 1% Italian 1%
- Foreign-born
- 9% · Canada
- Languages at home
- 83% English-only · Spanish 11% French/Haitian/Cajun 2% Tagalog/Filipino 1%
Political lean MEDSL · Dauphin
- 2024 margin
- Lean D (+5.9) · D 52.4% · R 46.5% · Other 1.1%
- 2008→2024 swing
- -3.1pp toward R · 2008: 9.1pp · 2024: 5.9pp
- All cycles
- 2024: D+5.9 2020: D+8.5 2016: D+2.8 2012: D+6.0 2008: D+9.1
Not yet ingested
- Civics
- —
Market trends
- HPI YoY
- ▼ -119.52%
- Current HPI
- 211.455
- Rent YoY
- ▲ 9.09%
- Metro
- Harrisburg-Carlisle, PA
- State GDP YoY
- ▲ 1.68%
- F500 in state
- 34
Industry mix (Fortune 500 HQ in PA)
| Industry | F500 HQs | Revenue |
|---|---|---|
| Healthcare | 2 | $309B |
|
||
| Insurance | 2 | $27B |
|
||
| Telecommunications / Media | 1 | $124B |
|
||
| Industrial Distribution | 1 | $22B |
|
||
| Financial Services | 1 | $20B |
|
||
| Chemicals / Materials | 1 | $18B |
|
||
Price history
+420.0% since first listed5 events — show timeline
- 2026-05-13 Price Changed $129,999 BRIGHT MLS
- 2026-04-11 Price Changed $134,999 BRIGHT MLS
- 2026-04-10 Listed $124,999 BRIGHT MLS
- 2026-04-08 Coming Soon $124,999 BRIGHT MLS
- 1989-02-16 Sold (Public Records) $25,000 Public Records
Property tax history
+0.9%/yrLatest (2026): $1,379 · +1.6% YoY. Source: county tax records.
Cash-flow waterfall
monthlySold comps — $/sqft
last 12 mo · ≤1 miLoading sold comps…