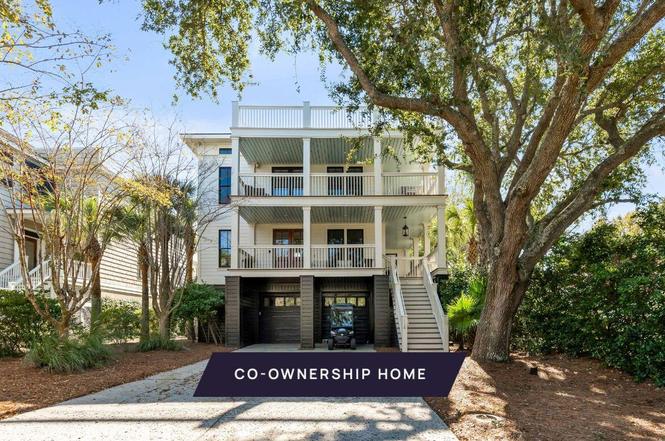
108 Carolina Blvd · Isle of Palms, SC
Flood risk 9/10 · Severe
- FEMA flood zone
- AE
- Chance of flooding over 30 yrs
- 0.99%
- Est. flood insurance / yr
- $2,026 – $9,024
Fire risk 1/10 · Minimal
- Est. fire insurance / yr
- $783 – $1,453
Heat risk 10/10 · Severe
- Hot days now (above 105°F)
- 7 days/yr
- Hot days in 30 yrs
- 19 days/yr
Wind risk 9/10 · Severe
- Chance of severe wind over 30 yrs
- 99.0%
Air-quality risk 3/10 · Minor
- Unhealthy air days now
- 3 days/yr
- Unhealthy air days in 30 yrs
- 3 days/yr
Risk factors via First Street. Map © Google.
Why this score? — see what drove the C+ grade
The composite is a weighted blend of 9 inputs, each scored 0–100. Each bar is that input's sub-score; the figure is the points it added to the 100-point composite (weight × sub-score).
- Cash flow +18.3/30.0
- Appreciation +8.4/10.0
- 1% rule +7.7/10.0
- ARV discount +7.5/15.0
- DSCR +5.8/10.0
- Schools +4.3/10.0
- Livability +3.1/5.0
- Rent growth +2.5/5.0
- Condition / age +2.5/5.0
$549,000
🖨 Deal sheet 📄 Offer letter ✓ Due diligence
Listing remarks
New co-ownership opportunity by Pacaso: Own one-eighth of Paradise Palms, a professionally managed, turnkey home. Located on Isle of Palms, this updated three-story home features multiple porches, a rooftop deck, pool and covered hot tub. A 3-stop elevator connects the levels, including the second-floor living area with Australian cypress floors, 12-foot ceilings, large windows, a gas fireplace and access to an expansive deck. The kitchen includes custom cabinetry, stone countertops, stainless steel appliances and a breakfast bar. The primary suite offers porch access and an en suite bath with soaking tub and double vanity. The first floor includes four bedrooms, three en suite baths, an of
Key facts
- Turnkey home
- Rooftop deck
- Multiple porches
Tags
Property features AI
Exterior
- Parking: Attached 2-car garage
- Utilities: Public sewer
- Home design: Residential fractional ownership; Two levels
- Exterior features: No other detached structures listed
Interior
- Bedrooms: 4 bedrooms
- Bathrooms: 6 bathrooms (5 full/total decimal listed as 5)
- Interior features: Elevator
Neighborhood map
What this means for you Summary
Snapshot
- This is a 4-bed/5.0-bath single-family listed at $549k.
Deal economics
- At list price, monthly cash flow is $44 ($525/yr) — positive.
- The deal already cash-flows at list — no discount required.
- Meets the 1% rule at list price ($7k rent vs $549k).
- Recommended offer: $500k (9.0% below list) — sets the bar for market timing.
Location & tenants
- Location reads 61/100 on livability (#217 in SC) — a middle-class / working-renter tenant base. Strengths: employment A+, crime A-; Watch: housing C-, amenities F, commute F.
- Charleston 01 (urban): math 48% / reading 53% proficiency, ranked #7 of 80 in SC (top 9%) — acceptable for families but not a draw, mixed tenant base, ~2y average lease.
- Zoned schools: Sullivan'S Island Elementary (math 88% / reading 81%, grade A+, #2 of 597 statewide, top 0%, 475 students, 9% FRL); Moultrie Middle (math 68% / reading 74%, grade A, #6 of 229 statewide, top 2%, 1,119 students, 22% FRL); Wando High (math 81% / reading 95%, grade A, #6 of 196 statewide, top 3%, 2,596 students, 19% FRL) — zoned schools average 17% FRL vs 44% district-wide (28 pts lower); this property's tenant base skews higher-income than the district average.
- Zoned-school proficiency averages 81% at this address vs 50% district-wide (+31 pts) — the actual schools serving this property are materially stronger than the Charleston 01 average implies; a family-tenant draw the district grade alone would hide.
- Market conditions: 121 active listings in the ZIP; high-income renter base; 4,156 units permitted in Charleston County in 2024 (857 in 5+ unit buildings).
Forward outlook
- In year one you build about $41k of equity ($4k loan paydown + $38k appreciation (6.8% local appreciation)).
- Charleston County population projected at +44% by 2050 — long-run rental-demand tailwind backs the buy-and-hold thesis.
- At projected returns (6.8% appreciation + 3.0% rent growth), your $154k cash investment doubles in ~4 years — after that, you're playing with house money.
- By year 2, paydown + projected appreciation supports a ~$66k cash-out refi (75% LTV) — recoverable capital for the next deal without selling this one.
Negotiation context
- It's been on market 106 days — a 9% lower offer ($500k) is reasonable based on typical stale-listing flexibility.
- 30 sale attempts since 25y ago; this cycle's ask has dropped $50k (8%) from the opening price — seller is motivated, your offer sets the floor, not the list.
Risks & watch-outs
- Watch-outs: property tax is 4.2% of price; flood insurance adds $460/mo.
- Climate carrying-cost: in FEMA flood zone AE (mandatory federal flood insurance); severe wind risk, 99% chance of damaging wind over 30y; extreme-heat days projected 7→19/yr by 2055 (HVAC capex compounding) — expect insurance premiums to compound above CPI over the hold.
Questions for the listing agent
- It's been on market 106 days. Have you received any prior offers? Is the seller open to a 9% concession, seller financing, or rate buy-down credit?
- Property tax is high relative to price — has the assessment been appealed recently, and will the sale trigger a re-assessment?
- What's the actual annual flood-insurance premium (NFIP or private), and is the property in a SFHA with mandatory coverage?
- Why hasn't it sold? Are there any deal-killer items the seller is aware of (foundation, flood, title, zoning, code violations)?
- Is there a deadline driving the sale (1031 exchange, divorce, estate, relocation)? That informs how much negotiation room exists.
- What's the average days-on-market for RENTAL listings here right now (not sales)? A rising rental-DOM trend means longer vacancies and softer asking-rent achievability than the comps imply.
- What's the recent tenant-quality profile in this submarket — average credit score on applications, eviction rate, late-payment / NSF rate, and stable-employment percentage? A property-management company in the area should have these aggregated.
- How much new for-sale + rental construction is in the pipeline within 1–3 miles? Heavy new supply typically softens prices + rents 12–24 months out; constrained supply supports both.
Investment metrics
- 1% rule
- 1.27% ✓
- Cap rate
- 7.39%
- Cash-on-cash
- 3.94%
- DSCR
- 1.18
- GRM
- 6.5
CMA / ARV
- ARV (on-the-fly)
- $5,127,300
- Comps found
- 6
Show comp detail 6 sales within ~0.75 mi
| Address | Dist | Beds/Ba | Sqft | Sold | Price | $/sf | Match |
|---|---|---|---|---|---|---|---|
| 122 Charleston Blvd | 0.07mi | 5/4.5 (+1) | 3,846 (-9%) | 12mo | $750,000 | $195 | 65 |
| 120 Charleston Blvd | 0.07mi | 5/5.5 (+1) | 4,544 (+8%) | 15mo | $4,950,000 | $1,089 | 65 |
| 3115 Ion Ave Unit D | 0.60mi | 5/6.0 (+1) | 4,502 (+7%) | 5mo | $800,000 | $178 | 48 |
| 3304 Jasper Blvd | 0.48mi | 5/5.0 (+1) | 3,708 (-12%) | 10mo | $12,500,000 | $3,371 | 44 |
| 601 Ocean Blvd | 0.60mi | 5/5.5 (+1) | 3,624 (-14%) | 8mo | $4,600,000 | $1,269 | 35 |
| 619 Carolina Blvd | 0.70mi | 5/5.5 (+1) | 3,598 (-15%) | 16mo | $4,370,000 | $1,215 | 22 |
Match score weights: distance 35% · size 25% · config 20% · recency 20%. Top-matched comps best support the ARV.
Projected returns pro-forma
6.84% appreciation · 3.0% rent growth · sell at horizon
- IRR
- 17.7%
- Equity multiple
- 2.24×
- Total profit
- $190,260
- Equity at exit
- $374,724
- IRR
- 17.2%
- Equity multiple
- 4.60×
- Total profit
- $553,845
- Equity at exit
- $706,686
Cash invested: $153,720 (down + closing). Projections, not guarantees.
Landlord ↔ Tenant lean methodology
- Overall (STATE)
- 90 Strongly Landlord-Friendly
- State South Carolina
- 90 Strongly Landlord-Friendly · R+6
- County
- — inherits STATE
- City
- — inherits STATE
ZIP-level market 29451
- Home prices YoY
- 2.0%
- Active inventory
- 121
- Price-to-rent
- 6.5×
Monthly cashflow live
- Estimated rent
- $6,993 medium interval (Pro) →
- Mortgage (P&I)
- −$2,879
- Tax from tax record
- −$1,913 /mo · $22,951/yr
- Insurance
- −$229
- Flood insurance flood zone
- −$460 /mo · $5,525/yr
- HOA
- −$0
- Vacancy / Maint / Mgmt
- −$1,469
- Net cashflow
- $44
Break-even live
UW: 25.0% down · 7.5% · 30yr · 1.5% tax · 5.0% vac · 8.0% maint · 8.0% mgmt
Financing live
Cash to close
- Down payment
- $137,250
- Closing costs
- $16,470
- Reserves months
- —
- Total cash needed
- —
Loan-product check · same deal, 3 products live
Conventional
25% down · 7.5% · 30yr
- Down + closing
- —
- Monthly P&I
- —
- Monthly cashflow
- —
- DSCR
- —
- Eligible?
- —
Personal DTI + credit; lowest rate.
DSCR
20% down · 8.5% · 30yr
- Down + closing
- —
- Monthly P&I
- —
- Monthly cashflow
- —
- DSCR
- —
- Eligible?
- —
No personal income docs; deal must DSCR.
Hard money
10% down · 12.0% · 12mo
- Down + closing
- —
- Monthly P&I
- —
- Monthly cashflow
- —
- DSCR
- —
- Eligible?
- —
Short-term bridge; refi at stabilization.
Listing history 50 events
-
2026-06-18days on market $549,000 Active 106 DOM
-
2026-06-17days on market $549,000 Active 105 DOM
-
2026-06-16days on market $549,000 Active 104 DOM
-
2026-06-15days on market $549,000 Active 103 DOM
-
2026-06-10days on market $549,000 Active 98 DOM
-
2026-06-09days on market $549,000 Active 97 DOM
-
2026-06-08days on market $549,000 Active 96 DOM
-
2026-06-07days on market $549,000 Active 95 DOM
-
2026-06-05days on market $549,000 Active 92 DOM
-
2026-06-03days on market $549,000 Active 91 DOM
-
2026-06-01days on market $549,000 Active 89 DOM
-
2026-05-31days on market $549,000 Active 88 DOM
-
2026-04-23price $549,000
-
2026-03-04$599,000 Active
-
2026-01-01historical
-
2026-01-01historical
-
2026-01-01historical
-
2025-12-17historical
-
2025-07-10$589,000 Active
-
2025-06-27price $599,000
-
2025-06-27price $599,000
-
2025-06-16price $559,000
-
2025-06-16price $559,000
-
2025-06-16price $589,000
-
2025-06-16$599,000 Active
-
2025-06-13$599,000 Active
-
2025-06-13historical
-
2025-04-28$599,000 Active
-
2025-04-28historical
-
2025-03-27$599,000 Active
-
2025-03-27historical
-
2024-10-22$599,000 Active
-
2024-07-10soldstatus $607,000 Closed
-
2024-06-25status Pending
-
2024-06-24$599,000 Active
-
2024-06-24$607,000 Active
-
2024-04-24historical
-
2023-11-02$607,000 Active
-
2023-01-20soldstatus $559,000 Closed
-
2023-01-16Active Under Contract
-
2023-01-16$559,000
-
2023-01-11soldstatus $559,000 Closed
-
2023-01-10soldstatus $559,000 Closed
-
2023-01-10$559,000 Active
-
2022-12-27soldstatus $559,000 Closed
-
2022-12-16historical Active Under Contract
-
2022-12-16$559,000 Active
-
2022-12-15soldstatus $559,000 Closed
-
2022-12-01historical Active Under Contract
-
2022-12-01$559,000 Active
ⓘ Source: listings_history table (triggers on properties + properties_extension) + one-shot
backfill from property_details.listing_events for pre-trigger history.
Tax reassessment forecast SC · Resets to sale price
- Current annual tax
- $22,951 · $1,913/mo
- Projected year-2 tax
- $22,951 · $1,913/mo
- Expected delta
- $0/yr ($0/mo · 0.0%)
ⓘ Screening estimate from a state-policy table — verify with the county assessor before closing.
Climate risk First Street
- Flood 9/10 Extreme FEMA zone AE · 99% chance over 30 yrs
- Wildfire 1/10 Low
- Heat 10/10 Extreme 7 d/yr ≥105°F today · 19 d/yr by 30 yrs out
- Wind 9/10 Extreme 99% chance of damaging wind over 30 yrs
- Air quality 3/10 Moderate 3 unhealthy d/yr today · 3 by 30 yrs out
Nearby sold comps map
Loading sold comps map…
Walkable amenities ~0.75 mi
Loading nearby amenities…
Taxation est. · year 1
- Rental income
- $83,916
- − Mortgage interest
- −$30,753
- − Property taxes
- −$22,951
- − Insurance
- −$8,270
- − Repairs & maintenance
- −$6,713
- − Management
- −$6,713
- − Depreciation
- −$15,971
- Taxable loss
- −$7,455
- Est. tax savings @ 24.0%
- +$1,789
- After-tax cash flow
- $2,314/yr
For passive investors: Depreciation is non-cash, so a rental often shows a tax loss while cash-flowing — sheltering income. Rental losses are passive: they offset passive income freely, and up to $25,000/yr can offset ordinary (W-2) income if you actively participate and your MAGI is under $100k (phasing out to $0 by $150k); unused losses carry forward. On sale, claimed depreciation is recaptured at up to 25%, and gains may owe capital-gains tax (a 1031 exchange can defer both). Figures are a year-1 estimate at your 24.0% rate — not tax advice; consult a CPA.
Schools (NCES district)
- District
- Charleston 01
- NCES district ID
- 4501440
- Math proficiency
- 48% ▼ -2.00%
- Reading proficiency
- 53% ▬ 0.00%
- Median HH income
- $52,376
- Composite
- 43.41/100
- National rank
- #3018
- State rank
- #7 of 80 in SC
Livability — Isle of Palms
- Score
- 61/100
- State rank
- #217
- US rank
- #18296
Category grades
Schools grade is shown separately in the Schools card above.
Census & demographics
- Census place
- Isle of Palms, SC
- County
- Charleston County · 366,793 people
- City population
- 4,362
- Metro
- Charleston-North Charleston, SC
- Population (ZIP)
- 4,362
- Household income
- $156,979
- Rent vs Own
- Severe rent burden
- 20.0
Population outlook (Charleston County) Hauer SSP2
- Today (2025)
- 480,562 people
- By 2030
- 525,921 · +9.4%
- By 2040
- 612,189 · +27.4%
- By 2050
- 691,627 · +43.9%
- By 2075
- 847,979 · +76.5%
- By 2100
- 926,482 · +92.8%
Race, ethnicity, and origin ACS 2023
- Neighborhood character
- Predominantly White (97%)
- Race & ethnicity
- White 97% Asian 2%
- Common ancestry
- Lithuanian 5% Slovak 4% Scotch-Irish 2%
- Foreign-born
- 7% · China, Canada
- Languages at home
- 92% English-only · French/Haitian/Cajun 3% Other Asian/Pacific 3% Spanish 1%
Political lean MEDSL · Charleston
- 2024 margin
- Lean D (+5.7) · D 51.9% · R 46.3% · Other 1.8%
- 2008→2024 swing
- -2.7pp toward R · 2008: 8.3pp · 2024: 5.7pp
- All cycles
- 2024: D+5.7 2020: D+12.9 2016: D+7.9 2012: D+2.4 2008: D+8.3
Not yet ingested
- Civics
- —
Market trends
- HPI YoY
- ▲ 6.84%
- Current HPI
- 348.8655
- Rent YoY
- —
- Metro
- Charleston-North Charleston, SC
- State GDP YoY
- ▲ 4.51%
- F500 in state
- 2
Industry mix (Fortune 500 HQ in SC)
| Industry | F500 HQs | Revenue |
|---|---|---|
| Packaging | 1 | $7B |
|
||
Price history
+0.0% since first listed74 events — show timeline
- 2026-04-23 Price Changed $549,000 Charleston Trident MLS
- 2026-03-04 Listed $599,000 Charleston Trident MLS
- 2026-01-01 Listing Removed — Charleston Trident MLS
- 2026-01-01 Listing Removed — Charleston Trident MLS
- 2026-01-01 Listing Removed — Charleston Trident MLS
- 2025-12-17 Listing Removed — Charleston Trident MLS
- 2025-07-10 Listed $589,000 Charleston Trident MLS
- 2025-06-27 Price Changed $599,000 Charleston Trident MLS
- 2025-06-27 Price Changed $599,000 Charleston Trident MLS
- 2025-06-16 Price Changed $559,000 Charleston Trident MLS
- 2025-06-16 Price Changed $559,000 Charleston Trident MLS
- 2025-06-16 Price Changed $589,000 Charleston Trident MLS
- 2025-06-16 Listed $599,000 Charleston Trident MLS
- 2025-06-13 Listing Removed — Charleston Trident MLS
- 2025-06-13 Listed $599,000 Charleston Trident MLS
- 2025-04-28 Listing Removed — Charleston Trident MLS
- 2025-04-28 Listed $599,000 Charleston Trident MLS
- 2025-03-27 Listing Removed — Charleston Trident MLS
- 2025-03-27 Listed $599,000 Charleston Trident MLS
- 2024-10-22 Listed $599,000 Charleston Trident MLS
- 2024-07-10 Sold (MLS) $607,000 Charleston Trident MLS
- 2024-06-25 Pending — Charleston Trident MLS
- 2024-06-24 Listed $607,000 Charleston Trident MLS
- 2024-06-24 Listed $599,000 Charleston Trident MLS
- 2024-04-24 Listing Removed — Charleston Trident MLS
- 2023-11-02 Listed $607,000 Charleston Trident MLS
- 2023-01-20 Sold (MLS) $559,000 Charleston Trident MLS
- 2023-01-16 Listed — Charleston Trident MLS
- 2023-01-16 Listed $559,000 Charleston Trident MLS
- 2023-01-11 Sold (MLS) $559,000 Charleston Trident MLS
- 2023-01-10 Listed $559,000 Charleston Trident MLS
- 2023-01-10 Sold (MLS) $559,000 Charleston Trident MLS
- 2022-12-27 Sold (MLS) $559,000 Charleston Trident MLS
- 2022-12-16 Contingent — Charleston Trident MLS
- 2022-12-16 Listed $559,000 Charleston Trident MLS
- 2022-12-15 Sold (MLS) $559,000 Charleston Trident MLS
- 2022-12-01 Contingent — Charleston Trident MLS
- 2022-12-01 Listed $559,000 Charleston Trident MLS
- 2022-11-17 Listed $559,000 Charleston Trident MLS
- 2022-11-15 Listing Removed — Charleston Trident MLS
- 2022-11-15 Listing Removed — Charleston Trident MLS
- 2022-11-15 Listing Removed — Charleston Trident MLS
- 2022-11-15 Listing Removed — Charleston Trident MLS
- 2022-11-15 Listing Removed — Charleston Trident MLS
- 2022-09-06 Listed $559,000 Charleston Trident MLS
- 2022-09-06 Listed $559,000 Charleston Trident MLS
- 2022-09-06 Listed $559,000 Charleston Trident MLS
- 2022-09-06 Listed $559,000 Charleston Trident MLS
- 2022-09-06 Listed $559,000 Charleston Trident MLS
- 2022-03-08 Sold (Public Records) $3,575,000 Public Records
- 2022-03-08 Sold (MLS) $3,575,000 Charleston Trident MLS
- 2022-02-15 Contingent — Charleston Trident MLS
- 2022-02-08 Relisted — Charleston Trident MLS
- 2022-02-01 Contingent — Charleston Trident MLS
- 2022-01-13 Listed $3,700,000 Charleston Trident MLS
- 2013-03-29 Sold (Public Records) $1,531,500 Public Records
- 2013-03-26 Sold (MLS) $1,531,500 Charleston Trident MLS
- 2012-02-27 Listed $1,599,000 Charleston Trident MLS
- 2008-01-28 Sold (Public Records) $1,450,000 Public Records
- 2008-01-28 Sold (Public Records) $1,925,000 Public Records
- 2008-01-25 Sold (MLS) $1,450,000 Charleston Trident MLS
- 2007-02-27 Listed $1,850,000 Charleston Trident MLS
- 2003-07-24 Sold (Public Records) $1,300,000 Public Records
- 2003-07-23 Sold (MLS) $1,300,000 Charleston Trident MLS
- 2003-01-31 Listed $1,450,000 Charleston Trident MLS
- 2003-01-22 Listing Removed — Charleston Trident MLS
- 2002-12-10 Listed $1,450,000 Charleston Trident MLS
- 2002-11-13 Sold (MLS) $350,000 Charleston Trident MLS
- 2002-09-12 Listing Removed — Charleston Trident MLS
- 2002-02-18 Listed $369,000 Charleston Trident MLS
- 2002-02-18 Listed $995,000 Charleston Trident MLS
- 2001-09-18 Sold (Public Records) $525,000 Public Records
- 2001-09-17 Sold (MLS) $525,000 Charleston Trident MLS
- 2001-05-09 Listed $549,000 Charleston Trident MLS
Property tax history
+23.7%/yrLatest (2022): $22,951 · +1.2% YoY. Source: county tax records.
Cash-flow waterfall
monthlySold comps — $/sqft
last 12 mo · ≤1 miLoading sold comps…