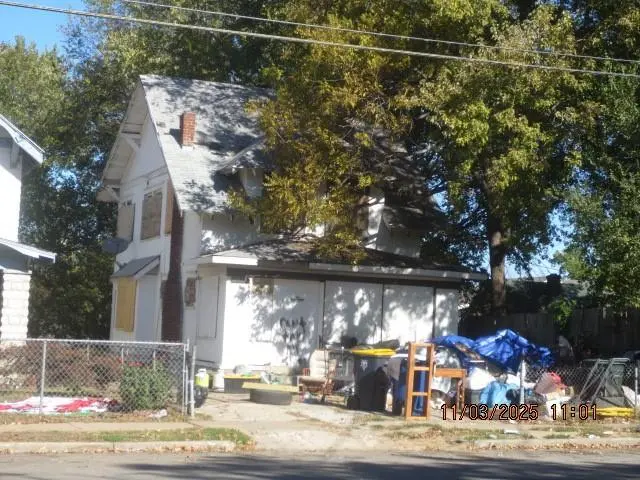
5838 E 12th St · Kansas City, MO
Flood risk 1/10 · Minimal
- FEMA flood zone
- X (unshaded)
- Chance of flooding over 30 yrs
- 0.0%
- Est. flood insurance / yr
- $473 – $860
Fire risk 1/10 · Minimal
- Est. fire insurance / yr
- $1,054 – $1,958
Heat risk 4/10 · Minor
- Hot days now (above 106°F)
- 7 days/yr
- Hot days in 30 yrs
- 17 days/yr
Wind risk 2/10 · Minimal
- Chance of severe wind over 30 yrs
- —
Air-quality risk 3/10 · Minor
- Unhealthy air days now
- 2 days/yr
- Unhealthy air days in 30 yrs
- 3 days/yr
Risk factors via First Street. Map © Google.
Why this score? — see what drove the C- grade
The composite is a weighted blend of 9 inputs, each scored 0–100. Each bar is that input's sub-score; the figure is the points it added to the 100-point composite (weight × sub-score).
- Cash flow +15.0/30.0
- Appreciation +10.0/10.0
- ARV discount +7.5/15.0
- 1% rule +5.0/10.0
- DSCR +5.0/10.0
- Livability +3.9/5.0
- Rent growth +2.5/5.0
- Condition / age +2.5/5.0
- Schools +1.5/10.0
$26,600
🖨 Deal sheet (PDF) 📄 Offer letter ✓ Due diligence
Listing remarks MLS
4 bedroom 1.5 bath fixer home, nice lot, easy access to Truman Road and down town. Property being sold as is where is in current condition.
Key facts
- 4,972 sq ft lot
- Built 1915
- Listed 214 days
Neighborhood map
What this means for you Summary
Snapshot
- This is a 3-bed/1.0-bath single-family listed at $27k.
Deal economics
- At list price, monthly cash flow is $817 ($10k/yr) — positive.
- The deal already cash-flows at list — no discount required.
- Meets the 1% rule at list price ($1k rent vs $27k).
- Recommended offer: $23k (12.0% below list) — sets the bar for market timing.
- Cap rate 43.2% vs local median 3.9% in Kansas City — top-decile yield for the area; either an underpriced asset or a hidden risk that comps aren't pricing in. Stress-test before assuming the spread holds.
Location & tenants
- Location reads 78/100 on livability (#28 in MO, #2,671 nationally) — a middle-class / working-renter tenant base. Strengths: amenities A+, commute A+, cost of living A+; Watch: schools C-, crime F.
- Kansas City 33 (urban): math 12% / reading 24% proficiency, ranked #308 of 324 in MO (top 95%) — low school quality limits family demand, transient renter base, plan for 1-2y turnover; 75% free/reduced lunch — lower-income household profile, screen leases tightly.
- Market conditions: 21 active listings in the ZIP; 15 comparable units currently listed for rent nearby; rentals at typical pace (median 17d on market — plan ~3-4 weeks tenant-placement turnaround); 4,002 units permitted in Jackson County in 2024 (2,271 in 5+ unit buildings).
Forward outlook
- In year one you build about $3k of equity ($184 loan paydown + $3k appreciation (10.0% local appreciation)).
- Jackson County population projected at +4% by 2050 — modest demand growth; plan on rents tracking national, not racing it.
- At projected returns (10.0% appreciation + 3.0% rent growth), your $7k cash investment doubles in ~1 year — after that, you're playing with house money.
- By year 10, paydown + projected appreciation supports a ~$34k cash-out refi (75% LTV) — recoverable capital for the next deal without selling this one.
Negotiation context
- It's been on market 214 days — a 12% lower offer ($23k) is reasonable based on typical stale-listing flexibility.
- 3 sale attempts since 24y ago; this cycle's ask has dropped $15k (37%) from the opening price — seller is motivated, your offer sets the floor, not the list.
Risks & watch-outs
- Watch-outs: built in 1915 — expect roof / HVAC / electrical / plumbing capex.
Questions for the listing agent
- It's been on market 214 days. Have you received any prior offers? Is the seller open to a 12% concession, seller financing, or rate buy-down credit?
- Built in 1915 — when were the roof, HVAC, electrical panel, plumbing, and water heater last replaced?
- Why hasn't it sold? Are there any deal-killer items the seller is aware of (foundation, flood, title, zoning, code violations)?
- Is there a deadline driving the sale (1031 exchange, divorce, estate, relocation)? That informs how much negotiation room exists.
- Crime grade is F in this area — have there been break-ins, vandalism, or insurance claims at this property in the last 3 years? What carrier currently insures it and at what premium?
- What's the average days-on-market for RENTAL listings here right now (not sales)? A rising rental-DOM trend means longer vacancies and softer asking-rent achievability than the comps imply.
- What's the recent tenant-quality profile in this submarket — average credit score on applications, eviction rate, late-payment / NSF rate, and stable-employment percentage? A property-management company in the area should have these aggregated.
- How much new for-sale + rental construction is in the pipeline within 1–3 miles? Heavy new supply typically softens prices + rents 12–24 months out; constrained supply supports both.
Investment metrics
- 1% rule
- 4.76% ✓
- Cap rate
- 43.16%
- Cash-on-cash
- 131.67%
- DSCR
- 6.86
- GRM
- 1.7
CMA / ARV
- ARV (median comp)
- $94,204
- List price
- $26,600
- Delta
- -71.76%
- Verdict
- UNDERPRICED
- Comps
- 20 within 1.0 mi
Show comp detail 12 sales within ~0.75 mi
| Address | Dist | Beds/Ba | Sqft | Sold | Price | $/sf | Match |
|---|---|---|---|---|---|---|---|
| 6216 E 11th St | 0.21mi | 3/1.0 | 1,440 (+8%) | 7mo | $75,000 | $52 | 71 |
| 6011 E 8th St | 0.32mi | 3/1.5 | 1,250 (-6%) | 6mo | $175,000 | $140 | 68 |
| 5825 E 13th St | 0.17mi | 3/1.0 | 1,471 (+10%) | 9mo | $140,000 | $95 | 67 |
| 812 Beacon Ave | 0.33mi | 4/1.0 (+1) | 1,400 (+5%) | 5mo | $52,000 | $37 | 67 |
| 6031 E 14th St | 0.23mi | 3/2.0 | 1,236 (-7%) | 8mo | $79,000 | $64 | 66 |
| 730 Bennington Ave | 0.48mi | 3/1.0 | 1,408 (+6%) | 6mo | $105,000 | $75 | 63 |
| 1617 Belmont Ave | 0.45mi | 3/1.5 | 1,240 (-7%) | 7mo | $85,000 | $69 | 59 |
| 1301 Bennington Ave | 0.40mi | 4/2.0 (+1) | 1,460 (+10%) | 8mo | $165,000 | $113 | 50 |
| 714 Fuller Ave | 0.46mi | 2/2.0 (-1) | 1,449 (+9%) | 9mo | $115,000 | $79 | 47 |
| 6625 E 16th St | 0.58mi | 4/1.0 (+1) | 1,492 (+12%) | 1mo | $160,000 | $107 | 47 |
| 6325 E 18th Ter | 0.70mi | 4/2.5 (+1) | 1,247 (-6%) | 10mo | $250,000 | $200 | 38 |
| 529 Colorado Ave | 0.71mi | 3/2.0 | 1,501 (+13%) | 11mo | $170,000 | $113 | 32 |
Match score weights: distance 35% · size 25% · config 20% · recency 20%. Top-matched comps best support the ARV.
Projected returns pro-forma
10.0% appreciation · 3.0% rent growth · sell at horizon
- IRR
- —
- Equity multiple
- 9.94×
- Total profit
- $66,555
- Equity at exit
- $23,963
- IRR
- —
- Equity multiple
- 21.82×
- Total profit
- $155,102
- Equity at exit
- $51,678
Cash invested: $7,448 (down + closing). Projections, not guarantees.
Landlord ↔ Tenant lean methodology
- Overall (STATE)
- 81 Strongly Landlord-Friendly
- State Missouri
- 81 Strongly Landlord-Friendly · R+10
- County
- — inherits STATE
- City
- — inherits STATE
ZIP-level market 64126
- Active inventory
- 21
- Price-to-rent
- 1.7×
Monthly cashflow live
- Estimated rent
- $1,267 high interval (Pro) →
- Mortgage (P&I)
- −$139
- Tax est. 1.5%
- −$33 /mo · $399/yr
- Insurance
- −$11
- HOA
- −$0
- Vacancy / Maint / Mgmt
- −$266
- Net cashflow
- $817
Break-even live
Sensitivity live
| Price | -10% $836 | -5% $826 | +0% $817 | +5% $808 | +10% $799 |
|---|---|---|---|---|---|
| Rent | -10% $717 | -5% $767 | +0% $817 | +5% $867 | +10% $917 |
| Rate | -1.0pp $831 | -0.5pp $824 | base $817 | +0.5pp $810 | +1.0pp $803 |
UW: 25.0% down · 7.5% · 30yr · 1.5% tax · 5.0% vac · 8.0% maint · 8.0% mgmt
Financing live
Cash to close
- Down payment
- $6,650
- Closing costs
- $798
- Reserves months
- —
- Total cash needed
- —
Loan-product check · same deal, 3 products live
Conventional
25% down · 7.5% · 30yr
- Down + closing
- —
- Monthly P&I
- —
- Monthly cashflow
- —
- DSCR
- —
- Eligible?
- —
Personal DTI + credit; lowest rate.
DSCR
20% down · 8.5% · 30yr
- Down + closing
- —
- Monthly P&I
- —
- Monthly cashflow
- —
- DSCR
- —
- Eligible?
- —
No personal income docs; deal must DSCR.
Hard money
10% down · 12.0% · 12mo
- Down + closing
- —
- Monthly P&I
- —
- Monthly cashflow
- —
- DSCR
- —
- Eligible?
- —
Short-term bridge; refi at stabilization.
Rent comps 15 comps
| Address | Beds | Baths | Sqft | Rent | $/sqft | DOM | Units | Dist |
|---|---|---|---|---|---|---|---|---|
| 6011 E 11th St Kansas City, MO | 3.0 | 1.0 | 900 | $1,200 | $1.33 | 17d | 1 | 0.11mi |
| 6237 E 12th St Kansas City, MO | 2.0 | 1.0 | 1580 | $1,150 | $0.73 | 44d | 1 | 0.21mi |
| 5852 E 20th St Unit TOP-1724 Kansas City, MO | 3.0 | 1.5 | 1482 | $1,075 | $0.73 | 3d | 1 | 0.78mi |
| 303 White Ave Unit 2 Kansas City, MO | 2.0 | 1.0 | 1060 | $950 | $0.90 | 11d | 1 | 0.84mi |
| 815 Elmwood Ave Kansas City, MO | 3.0 | 1.5 | 1302 | $1,600 | $1.23 | 15d | 1 | 0.90mi |
| 135 Lawndale Ave Kansas City, MO | 3.0 | 2.0 | 920 | $1,500 | $1.63 | 8d | 1 | 0.91mi |
| 1603 Elmwood Ave Kansas City, MO | 2.0 | 1.0 | 1064 | $1,031 | $0.97 | 13d | 1 | 0.98mi |
| 216 N Wheeling Ave Kansas City, MO | 3.0 | 2.0 | 1474 | $1,495 | $1.01 | 20d | 1 | 1.08mi |
| 216 N Wheeling Ave Kansas City, MO | 3.0 | 2.0 | 1474 | $1,495 | $1.01 | 17d | 1 | 1.08mi |
| 1812 Elmwood Ave Kansas City, MO | 3.0 | 1.0 | 1650 | $1,600 | $0.97 | 17d | 1 | 1.10mi |
| 5213 Wilburn Ct Kansas City, MO | 3.0 | 1.0 | 1274 | $1,375 | $1.08 | 22d | 1 | 1.22mi |
| 1905 Kensington Ave Kansas City, MO | 3.0 | 2.0 | 1285 | $1,325 | $1.03 | 24d | 1 | 1.22mi |
| 1805 Jackson Ave Kansas City, MO | 4.0 | 2.0 | 1250 | $1,250 | $1.00 | 44d | 1 | 1.27mi |
| 441 N Hardesty Ave Kansas City, MO | 4.0 | 1.0 | 1511 | $1,550 | $1.03 | 24d | 1 | 1.38mi |
| 218 N Elmwood Ave Kansas City, MO | 4.0 | 2.0 | 1184 | $1,500 | $1.27 | 44d | 1 | 1.43mi |
Listing history 21 events
-
2026-06-18days on market $26,600 Active 214 DOM
-
2026-06-17days on market $26,600 Active 213 DOM
-
2026-06-16days on market $26,600 Active 212 DOM
-
2026-06-15days on market $26,600 Active 211 DOM
-
2026-06-13days on market $26,600 Active 209 DOM
-
2026-06-09days on market $26,600 Active 205 DOM
-
2026-06-08days on market $26,600 Active 204 DOM
-
2026-06-07days on market $26,600 Active 203 DOM
-
2026-06-05pricedays on market $26,600 Active 200 DOM
-
2026-05-07price $28,900 139-char remark
Show marketing remark (139 chars)
4 bedroom 1.5 bath fixer home, nice lot, easy access to Truman Road and down town. Property being sold as is where is in current condition.
-
2026-03-09price $31,380 139-char remark
Show marketing remark (139 chars)
4 bedroom 1.5 bath fixer home, nice lot, easy access to Truman Road and down town. Property being sold as is where is in current condition.
-
2026-02-07status Active 139-char remark
Show marketing remark (139 chars)
4 bedroom 1.5 bath fixer home, nice lot, easy access to Truman Road and down town. Property being sold as is where is in current condition.
-
2026-02-07price $34,100 139-char remark
Show marketing remark (139 chars)
4 bedroom 1.5 bath fixer home, nice lot, easy access to Truman Road and down town. Property being sold as is where is in current condition.
-
2026-02-01historical 139-char remark
Show marketing remark (139 chars)
4 bedroom 1.5 bath fixer home, nice lot, easy access to Truman Road and down town. Property being sold as is where is in current condition.
-
2025-12-13price $37,000 139-char remark
Show marketing remark (139 chars)
4 bedroom 1.5 bath fixer home, nice lot, easy access to Truman Road and down town. Property being sold as is where is in current condition.
-
2025-11-03$42,000 Active 139-char remark
Show marketing remark (139 chars)
4 bedroom 1.5 bath fixer home, nice lot, easy access to Truman Road and down town. Property being sold as is where is in current condition.
-
2006-03-07soldstatus
-
2002-09-03soldstatus
-
2002-08-23soldstatus 178-char remark
Show marketing remark (178 chars)
Nicely remodeled! New roof, updated plumbing partly updated electric. All hardwood floors. Old charm, wood trim. Very well maintained, bright, open. Ready to move in. Shows well.
-
2002-04-07$55,000 178-char remark
Show marketing remark (178 chars)
Nicely remodeled! New roof, updated plumbing partly updated electric. All hardwood floors. Old charm, wood trim. Very well maintained, bright, open. Ready to move in. Shows well.
-
1996-09-06soldstatus
ⓘ Source: listings_history table (triggers on properties + properties_extension) + one-shot
backfill from property_details.listing_events for pre-trigger history.
Climate risk First Street
- Flood 1/10 Low FEMA zone X (unshaded) · 0% chance over 30 yrs
- Wildfire 1/10 Low
- Heat 4/10 Moderate 7 d/yr ≥106°F today · 17 d/yr by 30 yrs out
- Wind 2/10 Low
- Air quality 3/10 Moderate 2 unhealthy d/yr today · 3 by 30 yrs out
Nearby sold comps map
Loading sold comps map…
Walkable amenities ~0.75 mi
Loading nearby amenities…
Taxation est. · year 1
- Rental income
- $15,206
- − Mortgage interest
- −$1,490
- − Property taxes
- −$399
- − Insurance
- −$133
- − Repairs & maintenance
- −$1,216
- − Management
- −$1,216
- − Depreciation
- −$774
- Taxable income
- $9,977
- Est. tax owed @ 24.0%
- −$2,394
- After-tax cash flow
- $7,412/yr
For passive investors: Depreciation is non-cash, so a rental often shows a tax loss while cash-flowing — sheltering income. Rental losses are passive: they offset passive income freely, and up to $25,000/yr can offset ordinary (W-2) income if you actively participate and your MAGI is under $100k (phasing out to $0 by $150k); unused losses carry forward. On sale, claimed depreciation is recaptured at up to 25%, and gains may owe capital-gains tax (a 1031 exchange can defer both). Figures are a year-1 estimate at your 24.0% rate — not tax advice; consult a CPA.
Schools (NCES district)
- District
- Kansas City 33
- NCES district ID
- 2916400
- Math proficiency
- 12% ▼ -8.00%
- Reading proficiency
- 24% ▬ 0.00%
- Median HH income
- $35,227
- Composite
- 14.8/100
- National rank
- #9387
- State rank
- #308 of 324 in MO
Livability — Kansas City
- Score
- 78/100
- State rank
- #28
- US rank
- #2671
Category grades
Schools grade is shown separately in the Schools card above.
Census & demographics
- Census place
- Kansas City, MO
- City population
- 439,467
- Population (ZIP)
- 6,433
Population outlook (Jackson County) Hauer SSP2
- Today (2025)
- 719,589 people
- By 2030
- 731,456 · +1.6%
- By 2040
- 746,689 · +3.8%
- By 2050
- 749,289 · +4.1%
- By 2075
- 736,227 · +2.3%
- By 2100
- 668,210 · -7.1%
Race, ethnicity, and origin ACS 2023
- Neighborhood character
- Diverse neighborhood (Simpson 0.62)
- Race & ethnicity
- Hispanic / Latino 57% Two or more races 29% White 19% Black 14% Asian 3% Native American 2%
- Hispanic origin (detail)
- Mexican 38% Cuban 4%
- Common ancestry
- Slovak 2% Iranian 1% Lithuanian 1%
- Foreign-born
- 36% · Canada
- Languages at home
- 44% English-only · Spanish 50% Vietnamese 1%
Political lean MEDSL · Jackson
- 2024 margin
- D (+19.3) · D 58.9% · R 39.5% · Other 1.6%
- 2008→2024 swing
- -6.1pp toward R · 2008: 25.4pp · 2024: 19.3pp
- All cycles
- 2024: D+19.3 2020: D+22.0 2016: D+16.6 2012: D+19.0 2008: D+25.4
Not yet ingested
- Civics
- —
Market trends
- HPI YoY
- ▲ 100.10%
- Current HPI
- 369.8782
- Rent YoY
- —
- Metro
- —
- State GDP YoY
- ▲ 1.84%
- F500 in state
- 20
Industry mix (Fortune 500 HQ in MO)
| Industry | F500 HQs | Revenue |
|---|---|---|
| Healthcare | 1 | $163B |
|
||
| Insurance | 1 | $21B |
|
||
| Industrial Technology | 1 | $17B |
|
||
| Retail | 1 | $16B |
|
||
| Industrial Distribution | 1 | $10B |
|
||
| Utilities | 1 | $9B |
|
||
Price history
-47.5% since first listed12 events — show timeline
- 2026-05-07 Price Changed $28,900 Heartland MLS as Distributed by MLS Grid
- 2026-03-09 Price Changed $31,380 Heartland MLS as Distributed by MLS Grid
- 2026-02-07 Relisted — Heartland MLS as Distributed by MLS Grid
- 2026-02-07 Price Changed $34,100 Heartland MLS as Distributed by MLS Grid
- 2026-02-01 Listing Removed — Heartland MLS as Distributed by MLS Grid
- 2025-12-13 Price Changed $37,000 Heartland MLS as Distributed by MLS Grid
- 2025-11-03 Listed $42,000 Heartland MLS as Distributed by MLS Grid
- 2006-03-07 Sold (Public Records) — Public Records
- 2002-09-03 Sold (Public Records) — Public Records
- 2002-08-23 Sold (MLS) — Heartland MLS as Distributed by MLS Grid
- 2002-04-07 Listed $55,000 Heartland MLS as Distributed by MLS Grid
- 1996-09-06 Sold (Public Records) — Public Records
Property tax history
+27.8%/yrLatest (2025): $5,903 · +427.0% YoY. Source: county tax records.
Cash-flow waterfall
monthlySold comps — $/sqft
last 12 mo · ≤1 miLoading sold comps…