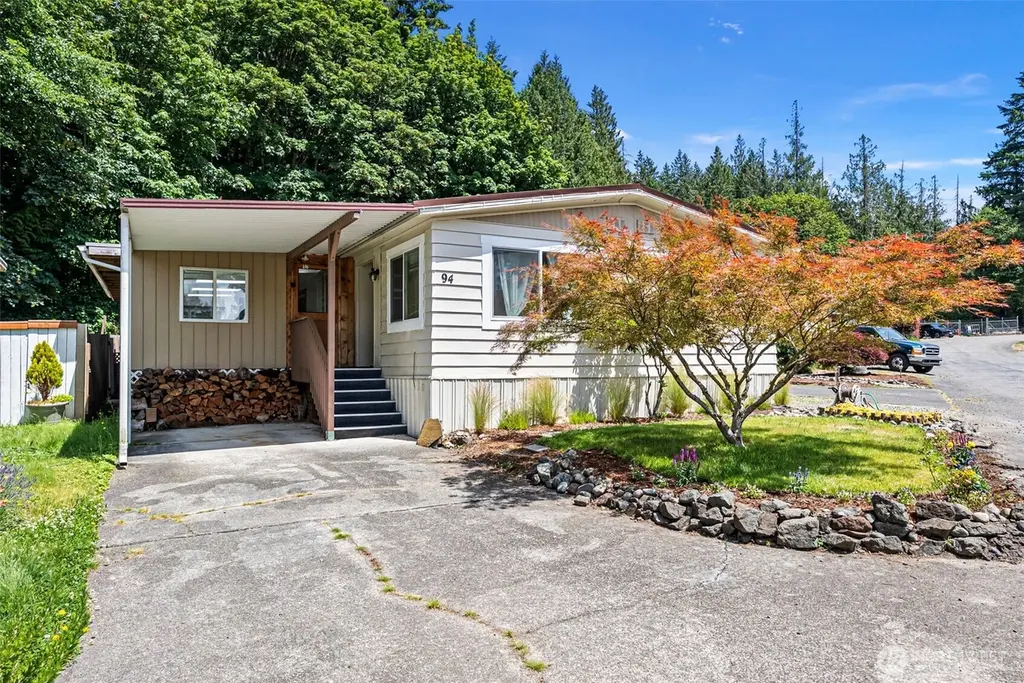
16300 State Highway 305 NE #94 · Suquamish, WA
Flood risk 1/10 · Minimal
- FEMA flood zone
- X (unshaded)
- Chance of flooding over 30 yrs
- 0.0%
- Est. flood insurance / yr
- $507 – $1,088
Fire risk 3/10 · Minor
- Est. fire insurance / yr
- $604 – $1,122
Heat risk 3/10 · Minor
- Hot days now (above 86°F)
- 7 days/yr
- Hot days in 30 yrs
- 15 days/yr
Wind risk 1/10 · Minimal
- Chance of severe wind over 30 yrs
- —
Air-quality risk 6/10 · Moderate
- Unhealthy air days now
- 9 days/yr
- Unhealthy air days in 30 yrs
- 9 days/yr
Risk factors via First Street. Map © Google.
Why this score? — see what drove the B- grade
The composite is a weighted blend of 9 inputs, each scored 0–100. Each bar is that input's sub-score; the figure is the points it added to the 100-point composite (weight × sub-score).
- Cash flow +30.0/30.0
- 1% rule +10.0/10.0
- DSCR +10.0/10.0
- Schools +5.4/10.0
- Condition / age +4.0/5.0
- Livability +3.5/5.0
- Rent growth +2.7/5.0
- ARV discount +0.0/15.0
- Appreciation +0.0/10.0
$135,000
🖨 Deal sheet (PDF) 📄 Offer letter ✓ Due diligence
Listing remarks
Beautifully maintained 3-bedroom, 1.5 baths home in the sought-after 55+ Cedar Glen community. With 1,584 square feet, the layout lives comfortably with open, light-filled living spaces and thoughtful updates throughout. The remodeled kitchen features updated cabinetry and modern finishes, flowing easily into the main living areas—ideal for both everyday living and entertaining visitors. The spacious primary suite offers privacy and its own ensuite bath, while recent improvements—including fresh interior paint, newer windows, updated plumbing, and durable laminate flooring—provide peace of mind and a move-in ready experience. Outside, enjoy an enclosed sun porch that exten
Key facts
- Garden area
- Covered parking
- Clubhouse
Tags
Neighborhood map
What this means for you Summary
Snapshot
- This is a 3-bed/2.0-bath manufactured listed at $135k. Condition is rated good.
Deal economics
- At list price, monthly cash flow is $2k ($21k/yr) — positive.
- The deal already cash-flows at list — no discount required.
- Meets the 1% rule at list price ($3k rent vs $135k).
- Recommended offer: $127k (6.0% below list) — sets the bar for market timing.
Location & tenants
- Location reads 69/100 on livability (#262 in WA) — a middle-class / working-renter tenant base. Strengths: housing A+, employment A-, schools B+; Watch: cost of living C-, amenities F, commute F.
- North Kitsap School District (suburban): math 53% / reading 65% proficiency, ranked #54 of 291 in WA (top 19%) — acceptable for families but not a draw, mixed tenant base, ~2y average lease.
- Market conditions: Rents flat; 265 active listings in the ZIP; 2 comparable units currently listed for rent nearby; high-income renter base; 1,294 units permitted in Kitsap County in 2024 (302 in 5+ unit buildings).
- This rent runs 35% of the median local income ($117k/yr) — at the standard rent-burdened threshold; future hikes will face affordability resistance.
Forward outlook
- Local home prices are declining (-3.0%/yr); year-one equity from $933 of loan paydown is wiped out by about $4k of value loss. Plan a longer hold.
- Kitsap County population projected at +8% by 2050 — modest demand growth; plan on rents tracking national, not racing it.
- At projected returns (-3.0% appreciation + 0.7% rent growth), your $38k cash investment doubles in ~3 years — after that, you're playing with house money.
Negotiation context
- It's been on market 62 days — a 6% lower offer ($127k) is reasonable based on typical stale-listing flexibility.
- 4 sale attempts since 8y ago with the ask held roughly flat each time — persistent listings suggest the price (not the market) is what's stuck; bring a comps-based counter.
- Current owner paid $110k; 23% above their basis — modest negotiation headroom, anchor on the comps not their cost.
Questions for the listing agent
- It's been on market 62 days. Have you received any prior offers? Is the seller open to a 6% concession, seller financing, or rate buy-down credit?
- Built in 1977 — when were the roof, HVAC, electrical panel, plumbing, and water heater last replaced?
- Why hasn't it sold? Are there any deal-killer items the seller is aware of (foundation, flood, title, zoning, code violations)?
- Is there a deadline driving the sale (1031 exchange, divorce, estate, relocation)? That informs how much negotiation room exists.
- Schools are B-rated — typically a magnet for longer-tenancy family renters. What's the average tenant stay here, and is there a school-zone premium baked into asking?
- What's the average days-on-market for RENTAL listings here right now (not sales)? A rising rental-DOM trend means longer vacancies and softer asking-rent achievability than the comps imply.
- What's the recent tenant-quality profile in this submarket — average credit score on applications, eviction rate, late-payment / NSF rate, and stable-employment percentage? A property-management company in the area should have these aggregated.
- How much new for-sale + rental construction is in the pipeline within 1–3 miles? Heavy new supply typically softens prices + rents 12–24 months out; constrained supply supports both.
Investment metrics
- 1% rule
- 2.50% ✓
- Cap rate
- 21.66%
- Cash-on-cash
- 54.90%
- DSCR
- 3.44
- GRM
- 3.3
CMA / ARV
- ARV (median comp)
- $106,210
- List price
- $135,000
- Delta
- 27.11%
- Verdict
- OVERPRICED
- Comps
- 20 within 1.0 mi
Show comp detail 3 sales within ~0.75 mi
| Address | Dist | Beds/Ba | Sqft | Sold | Price | $/sf | Match |
|---|---|---|---|---|---|---|---|
| 16300 State Highway 305 NE #77 | 0.09mi | 3/2.0 | 1,560 (-2%) | 20mo | $75,000 | $48 | 77 |
| 16300 NE State Highway 305 #10 | 0.07mi | 2/2.0 (-1) | 1,368 (-14%) | 2mo | $170,000 | $124 | 68 |
| 16300 NE State Highway 305 #52 | 0.07mi | 2/2.0 (-1) | 1,400 (-12%) | 21mo | $189,000 | $135 | 54 |
Match score weights: distance 35% · size 25% · config 20% · recency 20%. Top-matched comps best support the ARV.
Projected returns pro-forma
-3.0% appreciation · 0.71% rent growth · sell at horizon
- IRR
- 50.5%
- Equity multiple
- 3.14×
- Total profit
- $80,720
- Equity at exit
- $20,129
- IRR
- 55.0%
- Equity multiple
- 5.83×
- Total profit
- $182,561
- Equity at exit
- $11,672
Cash invested: $37,800 (down + closing). Projections, not guarantees.
Landlord ↔ Tenant lean methodology
- Overall (STATE)
- 28 Tenant-Leaning
- State Washington
- 28 Tenant-Leaning · D+8
- County
- — inherits STATE
- City
- — inherits STATE
ZIP-level market 98370
- Rents YoY
- 0.7%
- Active inventory
- 265
- Price-to-rent
- 3.3×
Monthly cashflow live
- Estimated rent
- $3,370 medium interval (Pro) →
- Mortgage (P&I)
- −$708
- Tax est. 1.5%
- −$169 /mo · $2,025/yr
- Insurance
- −$56
- HOA
- −$0
- Vacancy / Maint / Mgmt
- −$708
- Net cashflow
- $1,729
Break-even live
Sensitivity live
| Price | -10% $1,823 | -5% $1,776 | +0% $1,729 | +5% $1,683 | +10% $1,636 |
|---|---|---|---|---|---|
| Rent | -10% $1,463 | -5% $1,596 | +0% $1,729 | +5% $1,862 | +10% $1,995 |
| Rate | -1.0pp $1,797 | -0.5pp $1,764 | base $1,729 | +0.5pp $1,694 | +1.0pp $1,659 |
UW: 25.0% down · 7.5% · 30yr · 1.5% tax · 5.0% vac · 8.0% maint · 8.0% mgmt
Financing live
Cash to close
- Down payment
- $33,750
- Closing costs
- $4,050
- Reserves months
- —
- Total cash needed
- —
Loan-product check · same deal, 3 products live
Conventional
25% down · 7.5% · 30yr
- Down + closing
- —
- Monthly P&I
- —
- Monthly cashflow
- —
- DSCR
- —
- Eligible?
- —
Personal DTI + credit; lowest rate.
DSCR
20% down · 8.5% · 30yr
- Down + closing
- —
- Monthly P&I
- —
- Monthly cashflow
- —
- DSCR
- —
- Eligible?
- —
No personal income docs; deal must DSCR.
Hard money
10% down · 12.0% · 12mo
- Down + closing
- —
- Monthly P&I
- —
- Monthly cashflow
- —
- DSCR
- —
- Eligible?
- —
Short-term bridge; refi at stabilization.
Rent comps 2 comps
| Address | Beds | Baths | Sqft | Rent | $/sqft | DOM | Units | Dist |
|---|---|---|---|---|---|---|---|---|
| 4005 NE Kedros Dr Poulsbo, WA | 3.0 | 2.0 | 1200 | $2,850 | $2.38 | 14d | 1 | 1.33mi |
| 16725 Brauer Rd NE Poulsbo, WA | 4.0 | 2.5 | 2000 | $4,500 | $2.25 | 44d | 1 | 1.49mi |
Listing history 25 events
-
2026-06-18days on market $135,000 Active 62 DOM
-
2026-06-17days on market $135,000 Active 61 DOM
-
2026-06-16days on market $135,000 Active 60 DOM
-
2026-06-15days on market $135,000 Active 59 DOM
-
2026-06-14days on market $135,000 Active 57 DOM
-
2026-06-13days on market $135,000 Active 56 DOM
-
2026-06-10days on market $135,000 Active 54 DOM
-
2026-06-09days on market $135,000 Active 53 DOM
-
2026-06-08days on market $135,000 Active 52 DOM
-
2026-06-07days on market $135,000 Active 51 DOM
-
2026-06-02days on market $135,000 Active 46 DOM
-
2026-06-01days on market $135,000 Active 45 DOM
-
2026-05-31days on market $135,000 Active 44 DOM
-
2026-05-30days on market $135,000 Active 43 DOM
-
2026-04-20status Active
-
2026-04-18status Pending
-
2026-04-15$135,000 Active
-
2022-09-28soldstatus $110,000 Closed
-
2022-09-09status Pending
-
2022-09-01$115,000 Active
-
2018-12-13soldstatus $79,950 Sold
-
2018-12-09status Pending
-
2018-11-29status Pending Inspection
-
2018-11-22price $79,950
-
2018-10-17$85,000 Active
ⓘ Source: listings_history table (triggers on properties + properties_extension) + one-shot
backfill from property_details.listing_events for pre-trigger history.
Climate risk First Street
- Flood 1/10 Low FEMA zone X (unshaded) · 0% chance over 30 yrs
- Wildfire 3/10 Moderate
- Heat 3/10 Moderate 7 d/yr ≥86°F today · 15 d/yr by 30 yrs out
- Wind 1/10 Low
- Air quality 6/10 Major 9 unhealthy d/yr today · 9 by 30 yrs out
Nearby sold comps map
Loading sold comps map…
Walkable amenities ~0.75 mi
Loading nearby amenities…
Taxation est. · year 1
- Rental income
- $40,438
- − Mortgage interest
- −$7,562
- − Property taxes
- −$2,025
- − Insurance
- −$675
- − Repairs & maintenance
- −$3,235
- − Management
- −$3,235
- − Depreciation
- −$3,927
- Taxable income
- $19,779
- Est. tax owed @ 24.0%
- −$4,747
- After-tax cash flow
- $16,004/yr
For passive investors: Depreciation is non-cash, so a rental often shows a tax loss while cash-flowing — sheltering income. Rental losses are passive: they offset passive income freely, and up to $25,000/yr can offset ordinary (W-2) income if you actively participate and your MAGI is under $100k (phasing out to $0 by $150k); unused losses carry forward. On sale, claimed depreciation is recaptured at up to 25%, and gains may owe capital-gains tax (a 1031 exchange can defer both). Figures are a year-1 estimate at your 24.0% rate — not tax advice; consult a CPA.
Condition & rehab AI · 12 photos
This 3-bedroom, 1.5 baths home in the Cedar Glen community is in excellent condition with recent updates and a move-in ready experience.
Value-add opportunities
- Both landscaping — enhances curb appeal and adds value
- Both interior paint touch-up — fresh paint improves aesthetics
- Both window treatments — completes the look and adds value
Renovation cost estimate screening
Value-add ROI direction
- Both landscaping — enhances curb appeal and adds value ↑
- Both interior paint touch-up — fresh paint improves aesthetics ↑
- Both window treatments — completes the look and adds value ↑
ⓘ Cost ranges are severity-bucket heuristics (US national rule-of-thumb). Get contractor quotes + a written scope before underwriting a rehab budget.
Schools (NCES district)
- District
- North Kitsap School District
- NCES district ID
- 5305760
- Math proficiency
- 53% ▼ -1.00%
- Reading proficiency
- 65% ▲ 1.00%
- Median HH income
- $68,919
- Composite
- 53.68/100
- National rank
- #3092
- State rank
- #54 of 291 in WA
Livability — Suquamish
- Score
- 69/100
- State rank
- #262
- US rank
- #9023
Category grades
Schools grade is shown separately in the Schools card above.
Census & demographics
- Census place
- Suquamish, WA
- County
- Kitsap County · 243,099 people
- City population
- 3,412
- Metro
- Bremerton-Silverdale-Port Orchard, WA
- Population (ZIP)
- 33,655
- Household income
- $116,756
- Rent vs Own
- Severe rent burden
- 904.0
Population outlook (Kitsap County) Hauer SSP2
- Today (2025)
- 277,525 people
- By 2030
- 285,040 · +2.7%
- By 2040
- 294,957 · +6.3%
- By 2050
- 300,622 · +8.3%
- By 2075
- 315,580 · +13.7%
- By 2100
- 304,340 · +9.7%
Race, ethnicity, and origin ACS 2023
- Neighborhood character
- Predominantly White (79%)
- Race & ethnicity
- White 79% Two or more races 11% Hispanic / Latino 9% Asian 3% Black 1%
- Hispanic origin (detail)
- Mexican 5%
- Common ancestry
- Portuguese 7% Italian 4% Slovak 3%
- Foreign-born
- 6% · Canada, South Korea
- Languages at home
- 93% English-only · Spanish 4% Other Indo-European 1% Other Asian/Pacific 1%
Political lean MEDSL · Kitsap
- 2024 margin
- Strong D (+20.9) · D 58.8% · R 37.9% · Other 3.3%
- 2008→2024 swing
- +8.6pp toward D · 2008: 12.3pp · 2024: 20.9pp
- All cycles
- 2024: D+20.9 2020: D+18.1 2016: D+11.6 2012: D+11.1 2008: D+12.3
Not yet ingested
- Civics
- —
Market trends
- HPI YoY
- ▼ -342.47%
- Current HPI
- 347.3427
- Rent YoY
- ▲ 0.71%
- Metro
- Bremerton-Silverdale-Port Orchard, WA
- State GDP YoY
- ▲ 4.65%
- F500 in state
- 22
Industry mix (Fortune 500 HQ in WA)
| Industry | F500 HQs | Revenue |
|---|---|---|
| Retail | 2 | $269B |
|
||
| Technology / Retail | 1 | $638B |
|
||
| Technology | 1 | $245B |
|
||
| Telecommunications | 1 | $38B |
|
||
| Food / Beverage | 1 | $36B |
|
||
| Automotive / Trucks | 1 | $34B |
|
||
Price history
+58.8% since first listed11 events — show timeline
- 2026-04-20 Relisted — NWMLS as Distributed by MLS Grid
- 2026-04-18 Pending — NWMLS as Distributed by MLS Grid
- 2026-04-15 Listed $135,000 NWMLS as Distributed by MLS Grid
- 2022-09-28 Sold (MLS) $110,000 NWMLS as Distributed by MLS Grid
- 2022-09-09 Pending — NWMLS as Distributed by MLS Grid
- 2022-09-01 Listed $115,000 NWMLS as Distributed by MLS Grid
- 2018-12-13 Sold (MLS) $79,950 NWMLS as Distributed by MLS Grid
- 2018-12-09 Pending — NWMLS as Distributed by MLS Grid
- 2018-11-29 Pending — NWMLS as Distributed by MLS Grid
- 2018-11-22 Price Changed $79,950 NWMLS as Distributed by MLS Grid
- 2018-10-17 Listed $85,000 NWMLS as Distributed by MLS Grid
Cash-flow waterfall
monthlySold comps — $/sqft
last 12 mo · ≤1 miLoading sold comps…