 🌊 Lakefront
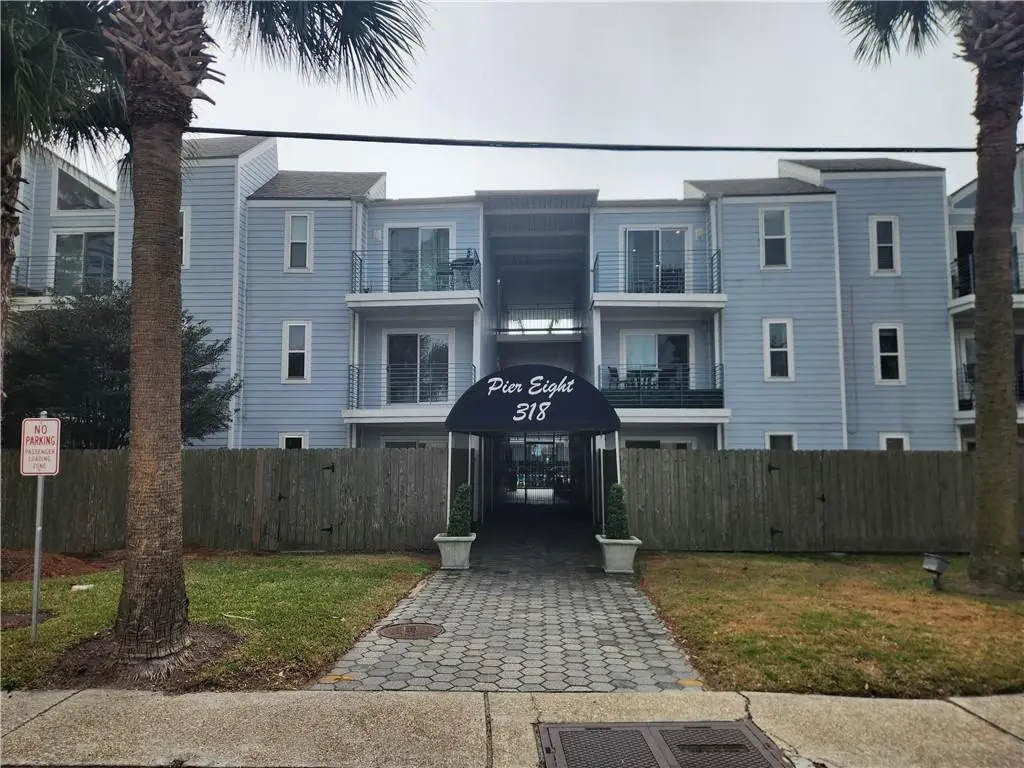
318 Lake Marina Ave #111 · New Orleans, LA
Flood risk 8/10 · Major
- FEMA flood zone
- X (shaded)
- Chance of flooding over 30 yrs
- 0.6%
- Est. flood insurance / yr
- $507 – $1,088
Fire risk 1/10 · Minimal
- Est. fire insurance / yr
- $1,269 – $2,357
Heat risk 10/10 · Severe
- Hot days now (above 108°F)
- 7 days/yr
- Hot days in 30 yrs
- 21 days/yr
Wind risk 10/10 · Severe
- Chance of severe wind over 30 yrs
- 99.0%
Air-quality risk 4/10 · Minor
- Unhealthy air days now
- 4 days/yr
- Unhealthy air days in 30 yrs
- 4 days/yr
Risk factors via First Street. Map © Google.
Why this score? — see what drove the C grade
The composite is a weighted blend of 9 inputs, each scored 0–100. Each bar is that input's sub-score; the figure is the points it added to the 100-point composite (weight × sub-score).
- Cash flow +18.6/30.0
- ARV discount +15.0/15.0
- 1% rule +9.8/10.0
- DSCR +5.8/10.0
- Livability +4.0/5.0
- Condition / age +2.5/5.0
- Rent growth +2.4/5.0
- Schools +1.6/10.0
- Appreciation +0.0/10.0
$110,000
🖨 Deal sheet 📄 Offer letter ✓ Due diligence
Listing remarks MLS
Rare opportunity to build out your dream home in a fantastic lakefront condo complex. Completely gutted & ready for final renovations this unit features a spacious floor plan including large rooms, primary bedroom with ensuite bathroom & walk-in closet, and in-unit washer/dryer hookups for added convenience. Established complex with a recently updated roof, well maintained common elements including the large pool & grilling area that's only a few feet from the unit entrance, laundry facilities, & private/assigned, covered parking behind a security gate. Highly desired location in West End by the lake with quick access to countless surrounding amenities including schools, shopping, restaurants, lakefront recreation areas, marinas, and much more.
Key facts
- Large pool
- Spacious floor plan
- Grilling area
Tags
Neighborhood map
What this means for you Summary
Snapshot
- This is a 1-bed/1.0-bath condo listed at $110k.
Deal economics
- At list price, monthly cash flow is $40 ($475/yr) — positive.
- The deal already cash-flows at list — no discount required.
- Meets the 1% rule at list price ($2k rent vs $110k).
- Recommended offer: $97k (12.0% below list) — sets the bar for market timing.
- Cap rate 7.4% vs local median 4.4% in New Orleans — top-decile yield for the area; either an underpriced asset or a hidden risk that comps aren't pricing in. Stress-test before assuming the spread holds.
Location & tenants
- Location reads 81/100 on livability (#3 in LA, #1,383 nationally) — a professional / high-income tenant draw. Strengths: amenities A+, commute A+, health & safety A+; Watch: crime C-, employment D.
- Orleans Parish (urban): math 11% / reading 27% proficiency, ranked #69 of 98 in LA (top 70%) — low school quality limits family demand, transient renter base, plan for 1-2y turnover; 68% free/reduced lunch — lower-income household profile, screen leases tightly.
- Market conditions: Rents soft (-0.4%/yr); 220 active listings in the ZIP; 40 comparable units currently listed for rent nearby; rentals at typical pace (median 24d on market — plan ~3-4 weeks tenant-placement turnaround); high-income renter base; 710 units permitted in Orleans Parish in 2024 (244 in 5+ unit buildings).
- This rent is only 16% of the median local income ($121k/yr) — well below the 30% rent-burden line; pricing power to push rent on renewal without tenant pushback.
Forward outlook
- Local home prices are declining (-3.0%/yr); year-one equity from $761 of loan paydown is wiped out by about $3k of value loss. Plan a longer hold.
- Orleans County population projected at +61% by 2050 — long-run rental-demand tailwind backs the buy-and-hold thesis.
Negotiation context
- It's been on market 122 days — a 12% lower offer ($97k) is reasonable based on typical stale-listing flexibility.
- 3 sale attempts since 27y ago with the ask held roughly flat each time — persistent listings suggest the price (not the market) is what's stuck; bring a comps-based counter.
- Current owner paid $70k; list at $110k implies a 57% gain — meaningful room to come down on a strong offer.
Risks & watch-outs
- Watch-outs: flood insurance adds $66/mo; HOA is 24% of rent.
- Climate carrying-cost: severe flood risk; severe wind risk, 99% chance of damaging wind over 30y; extreme-heat days projected 7→21/yr by 2055 (HVAC capex compounding) — expect insurance premiums to compound above CPI over the hold.
Questions for the listing agent
- It's been on market 122 days. Have you received any prior offers? Is the seller open to a 12% concession, seller financing, or rate buy-down credit?
- Built in 1978 — when were the roof, HVAC, electrical panel, plumbing, and water heater last replaced?
- What's the actual annual flood-insurance premium (NFIP or private), and is the property in a SFHA with mandatory coverage?
- What does the HOA fee cover, when was the last increase, and are there any pending special assessments or reserve-fund shortfalls?
- Any open or pending special assessments — roof, HVAC, plumbing, elevator, façade? What's the per-unit balance and payoff schedule, and is the seller paying it off at close or rolling it to the buyer?
- Why hasn't it sold? Are there any deal-killer items the seller is aware of (foundation, flood, title, zoning, code violations)?
- Is there a deadline driving the sale (1031 exchange, divorce, estate, relocation)? That informs how much negotiation room exists.
- This sits on a lake — are riparian / water-frontage rights deeded with the parcel? Any dock permits, shoreline easements, or HOA water-use restrictions?
- What's the documented flood / surge / shoreline-erosion history here (FEMA AND non-FEMA — e.g., storm surge, creek backup, septic-field saturation)?
- Any water-quality or seasonal algae-bloom issues that affect tenant satisfaction or short-term-rental demand?
- What's the average days-on-market for RENTAL listings here right now (not sales)? A rising rental-DOM trend means longer vacancies and softer asking-rent achievability than the comps imply.
- What's the recent tenant-quality profile in this submarket — average credit score on applications, eviction rate, late-payment / NSF rate, and stable-employment percentage? A property-management company in the area should have these aggregated.
- How much new apartment / multifamily construction is in the pipeline within 1–3 miles? Heavy new supply (>2% of stock underway) typically softens rents 12–24 months out; light construction supports rent growth.
Investment metrics
- 1% rule
- 1.48% ✓
- Cap rate
- 7.45%
- Cash-on-cash
- 4.13%
- DSCR
- 1.18
- GRM
- 5.6
CMA / ARV
- ARV (median comp)
- $172,568
- List price
- $110,000
- Delta
- -36.26%
- Verdict
- UNDERPRICED
- Comps
- 20 within 1.0 mi
Projected returns pro-forma
-3.0% appreciation · 0.0% rent growth · sell at horizon
- IRR
- -19.1%
- Equity multiple
- 0.36×
- Total profit
- $-19,760
- Equity at exit
- $16,401
- IRR
- -28.1%
- Equity multiple
- -0.01×
- Total profit
- $-31,117
- Equity at exit
- $9,511
Cash invested: $30,800 (down + closing). Projections, not guarantees.
Landlord ↔ Tenant lean methodology
- Overall (STATE)
- 90 Strongly Landlord-Friendly
- State Louisiana
- 90 Strongly Landlord-Friendly · R+12
- County
- — inherits STATE
- City
- — inherits STATE
ZIP-level market 70124
- Rents YoY
- -0.4%
- Active inventory
- 220
- Price-to-rent
- 5.6×
Monthly cashflow live
- Estimated rent
- $1,632 high interval (Pro) →
- Mortgage (P&I)
- −$577
- Tax from tax record
- −$170 /mo · $2,042/yr
- Insurance
- −$46
- Flood insurance flood zone
- −$66 /mo · $798/yr
- HOA
- −$390
- Vacancy / Maint / Mgmt
- −$343
- Net cashflow
- $40
Break-even live
UW: 25.0% down · 7.5% · 30yr · 1.5% tax · 5.0% vac · 8.0% maint · 8.0% mgmt
Financing live
Cash to close
- Down payment
- $27,500
- Closing costs
- $3,300
- Reserves months
- —
- Total cash needed
- —
Loan-product check · same deal, 3 products live
Conventional
25% down · 7.5% · 30yr
- Down + closing
- —
- Monthly P&I
- —
- Monthly cashflow
- —
- DSCR
- —
- Eligible?
- —
Personal DTI + credit; lowest rate.
DSCR
20% down · 8.5% · 30yr
- Down + closing
- —
- Monthly P&I
- —
- Monthly cashflow
- —
- DSCR
- —
- Eligible?
- —
No personal income docs; deal must DSCR.
Hard money
10% down · 12.0% · 12mo
- Down + closing
- —
- Monthly P&I
- —
- Monthly cashflow
- —
- DSCR
- —
- Eligible?
- —
Short-term bridge; refi at stabilization.
Rent comps 40 comps
| Address | Beds | Baths | Sqft | Rent | $/sqft | DOM | Units | Dist |
|---|---|---|---|---|---|---|---|---|
| 318 Lake Marina Ave #305 New Orleans, LA | 2.0 | 2.0 | 980 | $1,800 | $1.84 | 3d | 1 | 0.02mi |
| 318 Lake Marina Ave New Orleans, LA | 1.0–2.0 | 1.5–2.0 | 953 | $1,200 | $1.26 | 14d | 2 | 0.03mi |
| 500 Lake Marina Ave #212 New Orleans, LA | 1.0 | 1.0 | 676 | $1,800 | $2.66 | 3d | 1 | 0.07mi |
| 6821 Fleur De Lis Dr New Orleans, LA | 2.0 | 1.0 | 1000 | $2,000 | $2.00 | 23d | 1 | 0.31mi |
| 7301 West End Blvd Unit C New Orleans, LA | 2.0 | 1.5 | 1070 | $3,300 | $3.08 | 43d | 1 | 0.33mi |
| 215 Opal St Unit A New Orleans, LA | 2.0 | 1.0 | 1100 | $1,500 | $1.36 | 20d | 1 | 0.35mi |
| 322 40th St New Orleans, LA | 2.0 | 1.0 | 862 | $1,500 | $1.74 | 23d | 1 | 0.36mi |
| 1639 Lake Ave Unit 6 Metairie, LA | 2.0 | 1.0 | 1000 | $1,200 | $1.20 | 43d | 1 | 0.37mi |
| 309 Opal St New Orleans, LA | 1.0–2.0 | 1.0–2.0 | 1243 | $1,500 | $1.21 | 3d | 3 | 0.41mi |
| 6842 Catina St New Orleans, LA | 2.0 | 1.0 | 1100 | $1,500 | $1.36 | 2d | 1 | 0.46mi |
| 6840 Catina St New Orleans, LA | 2.0 | 1.0 | 1100 | $1,500 | $1.36 | 3d | 1 | 0.46mi |
| 6720 Pontchartrain Blvd New Orleans, LA | 2.0 | 1.0 | 875 | $1,550 | $1.77 | 3d | 1 | 0.47mi |
| 1554 Orpheum Ave Unit 2 Metairie, LA | 1.0 | 1.5 | 700 | $1,050 | $1.50 | 43d | 1 | 0.47mi |
| 6722 Pontchartrain Blvd New Orleans, LA | 2.0 | 1.0 | 850 | $1,550 | $1.82 | 3d | 1 | 0.47mi |
| 1508 Seminole Ave Unit 207 Metairie, LA | 1.0 | 1.0 | 550 | $905 | $1.65 | 14d | 1 | 0.51mi |
| 6945 Milne Blvd New Orleans, LA | 2.0 | 1.0 | 800 | $2,300 | $2.88 | 2d | 1 | 0.51mi |
| 6945 Milne Blvd New Orleans, LA | 2.0 | 1.0 | 800 | $2,300 | $2.88 | 3d | 1 | 0.51mi |
| 112 Glenn St Unit G Metairie, LA | 2.0 | 1.0 | 750 | $1,275 | $1.70 | 23d | 1 | 0.52mi |
| 420 Metairie Hammond Hwy Metairie, LA | 1.0–2.0 | 1.0 | 808 | $2,000 | $2.48 | 21d | 4 | 0.54mi |
| 420 Metairie Hammond Hwy Metairie, LA | 1.0–2.0 | 1.0 | 808 | $2,000 | $2.48 | 23d | 4 | 0.54mi |
| 6650 Fleur De Lis Dr #5 New Orleans, LA | 1.0 | 1.0 | 600 | $1,100 | $1.83 | 23d | 1 | 0.54mi |
| 6629 Fleur De Lis Dr Apt 6 New Orleans, LA | 1.0 | 1.0 | 750 | $1,150 | $1.53 | 11d | 1 | 0.55mi |
| 420 Metairie Hammond Hwy #215 Metairie, LA | 2.0 | 1.0 | 944 | $2,700 | $2.86 | 20d | 1 | 0.56mi |
| 301 Seattle St New Orleans, LA | 2.0 | 1.0 | 660 | $1,475 | $2.23 | 21d | 3 | 0.56mi |
| 6622 Fleur De Lis Dr Unit 2 New Orleans, LA | 2.0 | 1.0 | 950 | $1,400 | $1.47 | 23d | 1 | 0.58mi |
| 6616 Bellaire Dr New Orleans, LA | 2.0 | 1.0 | 850 | $1,500 | $1.76 | 23d | 1 | 0.59mi |
| 101 36th St New Orleans, LA | 1.0 | 1.0 | 1000 | $1,455 | $1.46 | 23d | 1 | 0.61mi |
| 213 W Esplanade Ave #213 Metairie, LA | 2.0 | 1.5 | 1021 | $1,400 | $1.37 | 43d | 1 | 0.63mi |
| 6564 Fleur de Lis Dr New Orleans, LA | 1.0 | 1.0 | 600 | $1,050 | $1.75 | 23d | 1 | 0.65mi |
| 6537 Bellaire Dr New Orleans, LA | 2.0 | 2.0 | 1100 | $1,750 | $1.59 | 23d | 1 | 0.71mi |
| 325 Filmore Ave New Orleans, LA | 2.0 | 1.0 | 738 | $1,350 | $1.83 | 23d | 1 | 0.72mi |
| 1401 Lake Ave Unit C6 Metairie, LA | 2.0 | 1.5 | 1040 | $1,625 | $1.56 | 43d | 1 | 0.73mi |
| 6800 Louis XIV St Unit B New Orleans, LA | 2.0 | 1.0 | 1000 | $1,500 | $1.50 | 17d | 1 | 0.73mi |
| 801 Live Oak St Unit B Metairie, LA | 2.0 | 1.0 | 840 | $1,350 | $1.61 | 23d | 1 | 0.79mi |
| 1518 Sylvia Ave Metairie, LA | 1.0 | 1.0 | 1009 | $1,650 | $1.64 | 23d | 1 | 0.97mi |
| 6870 Argonne Blvd New Orleans, LA | 2.0 | 1.0 | 850 | $1,800 | $2.12 | 21d | 1 | 1.05mi |
| 1161 Lake Ave #222 Metairie, LA | 2.0 | 1.0 | 770 | $1,250 | $1.62 | 43d | 1 | 1.07mi |
| 1161 Lake Ave #120 Metairie, LA | 1.0 | 1.0 | 750 | $1,400 | $1.87 | 43d | 1 | 1.07mi |
| 1161 Lake Ave #205 Metairie, LA | 1.0 | 1.0 | 775 | $1,430 | $1.85 | 43d | 1 | 1.07mi |
| 6539 Vicksburg St New Orleans, LA | 2.0 | 1.5 | 1100 | $2,200 | $2.00 | 23d | 1 | 1.08mi |
HOA detail condo
- Monthly dues
- $390 · $4,680/yr
- Likely covers
- poolsecurity
- Assessments
- None detected in remarks — confirm with the listing agent.
Listing history 19 events
-
2026-06-18days on market $110,000 Active 122 DOM
-
2026-06-17days on market $110,000 Active 121 DOM
-
2026-06-16days on market $110,000 Active 120 DOM
-
2026-06-15days on market $110,000 Active 119 DOM
-
2026-06-13days on market $110,000 Active 117 DOM
-
2026-06-10days on market $110,000 Active 114 DOM
-
2026-06-09days on market $110,000 Active 113 DOM
-
2026-06-08days on market $110,000 Active 112 DOM
-
2026-06-07days on market $110,000 Active 111 DOM
-
2026-06-05days on market $110,000 Active 108 DOM
-
2026-06-03days on market $110,000 Active 107 DOM
-
2026-06-02days on market $110,000 Active 106 DOM
-
2026-06-01days on market $110,000 Active 105 DOM
-
2026-05-31days on market $110,000 Active 104 DOM
-
2026-02-16$110,000 Active 777-char remark
Show marketing remark (770 chars)
Rare opportunity to build out your dream home in a fantastic lakefront condo complex. Completely gutted & ready for final renovations this unit features a spacious floor plan including large rooms, primary bedroom with ensuite bathroom & walk-in closet, and in-unit washer/dryer hookups for added convenience. Established complex with a recently updated roof, well maintained common elements including the large pool & grilling area that's only a few feet from the unit entrance, laundry facilities, & private/assigned, covered parking behind a security gate. Highly desired location in West End by the lake with quick access to countless surrounding amenities including schools, shopping, restaurants, lakefront recreation areas, marinas, and much more.
-
2026-02-16$110,000 Active 770-char remark
Show marketing remark (770 chars)
Rare opportunity to build out your dream home in a fantastic lakefront condo complex. Completely gutted & ready for final renovations this unit features a spacious floor plan including large rooms, primary bedroom with ensuite bathroom & walk-in closet, and in-unit washer/dryer hookups for added convenience. Established complex with a recently updated roof, well maintained common elements including the large pool & grilling area that's only a few feet from the unit entrance, laundry facilities, & private/assigned, covered parking behind a security gate. Highly desired location in West End by the lake with quick access to countless surrounding amenities including schools, shopping, restaurants, lakefront recreation areas, marinas, and much more.
-
1999-12-17soldstatus $70,000
-
1999-09-15$73,500
-
1987-09-17soldstatus $58,000
ⓘ Source: listings_history table (triggers on properties + properties_extension) + one-shot
backfill from property_details.listing_events for pre-trigger history.
Tax reassessment forecast LA · Resets to sale price
- Current annual tax
- $2,042 · $170/mo
- Projected year-2 tax
- $2,042 · $170/mo
- Expected delta
- $0/yr ($0/mo · 0.0%)
ⓘ Screening estimate from a state-policy table — verify with the county assessor before closing.
Climate risk First Street
- Flood 8/10 Severe FEMA zone X (shaded) · 60% chance over 30 yrs
- Wildfire 1/10 Low
- Heat 10/10 Extreme 7 d/yr ≥108°F today · 21 d/yr by 30 yrs out
- Wind 10/10 Extreme 99% chance of damaging wind over 30 yrs
- Air quality 4/10 Moderate 4 unhealthy d/yr today · 4 by 30 yrs out
Nearby sold comps map
Loading sold comps map…
Walkable amenities ~0.75 mi
Loading nearby amenities…
Taxation est. · year 1
- Rental income
- $19,578
- − Mortgage interest
- −$6,162
- − Property taxes
- −$2,042
- − Insurance
- −$1,348
- − Repairs & maintenance
- −$1,566
- − Management
- −$1,566
- − HOA
- −$4,680
- − Depreciation
- −$3,200
- Taxable loss
- −$986
- Est. tax savings @ 24.0%
- +$237
- After-tax cash flow
- $712/yr
For passive investors: Depreciation is non-cash, so a rental often shows a tax loss while cash-flowing — sheltering income. Rental losses are passive: they offset passive income freely, and up to $25,000/yr can offset ordinary (W-2) income if you actively participate and your MAGI is under $100k (phasing out to $0 by $150k); unused losses carry forward. On sale, claimed depreciation is recaptured at up to 25%, and gains may owe capital-gains tax (a 1031 exchange can defer both). Figures are a year-1 estimate at your 24.0% rate — not tax advice; consult a CPA.
Schools (NCES district)
- District
- Orleans Parish
- NCES district ID
- 2201170
- Math proficiency
- 11% ▼ -52.00%
- Reading proficiency
- 27% ▼ -46.00%
- Median HH income
- $37,011
- Composite
- 15.78/100
- National rank
- #9271
- State rank
- #69 of 98 in LA
Livability — New Orleans
- Score
- 81/100
- State rank
- #3
- US rank
- #1383
Category grades
Schools grade is shown separately in the Schools card above.
Census & demographics
- Census place
- New Orleans, LA
- County
- Orleans Parish · 338,817 people
- City population
- 338,817
- Metro
- New Orleans-Metairie, LA
- Population (ZIP)
- 21,778
- Household income
- $121,228
- Rent vs Own
- Severe rent burden
- 332.0
Population outlook (Orleans County) Hauer SSP2
- Today (2025)
- 513,025 people
- By 2030
- 575,781 · +12.2%
- By 2040
- 700,174 · +36.5%
- By 2050
- 826,541 · +61.1%
- By 2075
- 1,123,374 · +119.0%
- By 2100
- 1,355,609 · +164.2%
Race, ethnicity, and origin ACS 2023
- Neighborhood character
- Predominantly White (75%)
- Race & ethnicity
- White 75% Hispanic / Latino 14% Two or more races 13% Black 5% Asian 2%
- Hispanic origin (detail)
- Mexican 2% Cuban 4%
- Common ancestry
- Lithuanian 18% Slovak 2% Italian 2%
- Foreign-born
- 4% · Canada, South Korea, China
- Languages at home
- 91% English-only · Spanish 4% French/Haitian/Cajun 1% Other Indo-European 1%
Political lean MEDSL · Orleans
- 2024 margin
- Solid D (+67.0) · D 82.2% · R 15.2% · Other 2.7%
- 2008→2024 swing
- +6.7pp toward D · 2008: 60.3pp · 2024: 67.0pp
- All cycles
- 2024: D+67.0 2020: D+68.2 2016: D+66.2 2012: D+62.5 2008: D+60.3
Not yet ingested
- Civics
- —
Market trends
- HPI YoY
- ▼ -227.84%
- Current HPI
- 181.5835
- Rent YoY
- ▼ -0.37%
- Metro
- New Orleans-Metairie, LA
- State GDP YoY
- ▲ 3.29%
- F500 in state
- 10
Industry mix (Fortune 500 HQ in LA)
| Industry | F500 HQs | Revenue |
|---|---|---|
| Telecommunications | 2 | $23B |
|
||
| Utilities | 1 | $12B |
|
||
| Wholesale / Distribution | 1 | $5B |
|
||
| Advertising | 1 | $2B |
|
||
Price history
+89.7% since first listed5 events — show timeline
- 2026-02-16 Listed $110,000 AcadianaMLS
- 2026-02-16 Listed $110,000 GSREIN
- 1999-12-17 Sold (Public Records) $70,000 Public Records
- 1999-09-15 Listed $73,500 AcadianaMLS
- 1987-09-17 Sold (Public Records) $58,000 Public Records
Property tax history
+8.5%/yrLatest (2026): $2,042 · +281.7% YoY. Source: county tax records.
Cash-flow waterfall
monthlySold comps — $/sqft
last 12 mo · ≤1 miLoading sold comps…