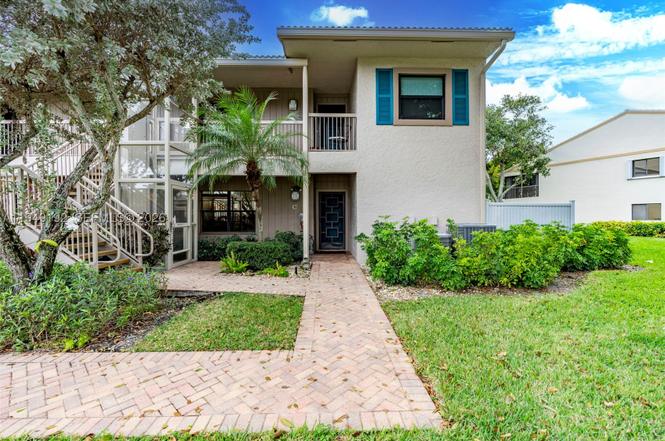
2 Eastgate Dr Unit C · Boynton Beach, FL
Flood risk 1/10 · Minimal
- FEMA flood zone
- X (unshaded)
- Chance of flooding over 30 yrs
- 0.0%
- Est. flood insurance / yr
- $507 – $1,088
Fire risk 1/10 · Minimal
- Est. fire insurance / yr
- $947 – $1,759
Heat risk 9/10 · Severe
- Hot days now (above 105°F)
- 5 days/yr
- Hot days in 30 yrs
- 18 days/yr
Wind risk 10/10 · Severe
- Chance of severe wind over 30 yrs
- 99.0%
Air-quality risk 2/10 · Minimal
- Unhealthy air days now
- 1 days/yr
- Unhealthy air days in 30 yrs
- 2 days/yr
Risk factors via First Street. Map © Google.
Why this score? — see what drove the B- grade
The composite is a weighted blend of 9 inputs, each scored 0–100. Each bar is that input's sub-score; the figure is the points it added to the 100-point composite (weight × sub-score).
- Cash flow +27.9/30.0
- 1% rule +10.0/10.0
- DSCR +9.9/10.0
- ARV discount +7.5/15.0
- Schools +4.3/10.0
- Livability +3.6/5.0
- Condition / age +2.5/5.0
- Rent growth +2.4/5.0
- Appreciation +0.0/10.0
$95,000
🖨 Deal sheet 📄 Offer letter ✓ Due diligence
Listing remarks
Beautiful, bright first-floor corner unit with an open floor plan and panoramic lake and golf course views from a huge screened-in lanai. Lovingly maintained by its original owner — Mrs. Clean lived here — this home is in impeccable condition for its age, reflecting pride of ownership throughout. Offered as-is at an exceptional value, this residence also presents a rare opportunity to update and customize finishes to your taste, transforming a true blank canvas into your own personal masterpiece. The layout features 2 bedrooms, 2 baths, plus a den/convertible 3rd bedroom, with sweeping vistas from nearly every room. The screened-in lanai is the perfect setting for morning coffee
Key facts
- Community pool
- Eat in kitchen
- Panoramic lake views
Tags
Neighborhood map
What this means for you Summary
Snapshot
- This is a 3-bed/2.0-bath condo listed at $95k.
Deal economics
- At list price, monthly cash flow is $294 ($4k/yr) — positive.
- The deal already cash-flows at list — no discount required.
- Meets the 1% rule at list price ($4k rent vs $95k).
- Recommended offer: $94k (1.5% below list) — sets the bar for market timing.
- Cap rate 10.0% vs local median 4.3% in Boynton Beach — top-decile yield for the area; either an underpriced asset or a hidden risk that comps aren't pricing in. Stress-test before assuming the spread holds.
Location & tenants
- Location reads 72/100 on livability (#351 in FL) — a middle-class / working-renter tenant base. Strengths: housing A+, health & safety B+, cost of living B; Watch: amenities D+, crime D-, commute F.
- Palm Beach (suburban): math 46% / reading 53% proficiency, ranked #34 of 73 in FL (top 47%) — families likely to look elsewhere, expect single-tenant / working-renter base with shorter leases.
- Market conditions: Rents soft (-0.6%/yr); 445 active listings in the ZIP; 40 comparable units currently listed for rent nearby; rentals at typical pace (median 22d on market — plan ~3-4 weeks tenant-placement turnaround); solid renter incomes; 3,974 units permitted in Palm Beach County in 2024 (1,012 in 5+ unit buildings).
- At $3,585/mo this rent would consume 57% of the median local household income ($76k/yr) (locally 1813% of renters already pay >50% of income on rent) — very limited rent-growth headroom before tenants either downsize or default.
Forward outlook
- Local home prices are declining (-3.0%/yr); year-one equity from $657 of loan paydown is wiped out by about $3k of value loss. Plan a longer hold.
- Palm Beach County population projected at +30% by 2050 — long-run rental-demand tailwind backs the buy-and-hold thesis.
Negotiation context
- It's been on market 15 days — a 2% lower offer ($94k) is reasonable based on typical stale-listing flexibility.
Risks & watch-outs
- Watch-outs: HOA is 51% of rent.
- Climate carrying-cost: severe wind risk, 99% chance of damaging wind over 30y; extreme-heat days projected 5→18/yr by 2055 (HVAC capex compounding) — expect insurance premiums to compound above CPI over the hold.
Questions for the listing agent
- What does the HOA fee cover, when was the last increase, and are there any pending special assessments or reserve-fund shortfalls?
- Any open or pending special assessments — roof, HVAC, plumbing, elevator, façade? What's the per-unit balance and payoff schedule, and is the seller paying it off at close or rolling it to the buyer?
- Is there a deadline driving the sale (1031 exchange, divorce, estate, relocation)? That informs how much negotiation room exists.
- Crime grade is D in this area — have there been break-ins, vandalism, or insurance claims at this property in the last 3 years? What carrier currently insures it and at what premium?
- What's the average days-on-market for RENTAL listings here right now (not sales)? A rising rental-DOM trend means longer vacancies and softer asking-rent achievability than the comps imply.
- What's the recent tenant-quality profile in this submarket — average credit score on applications, eviction rate, late-payment / NSF rate, and stable-employment percentage? A property-management company in the area should have these aggregated.
- How much new apartment / multifamily construction is in the pipeline within 1–3 miles? Heavy new supply (>2% of stock underway) typically softens rents 12–24 months out; light construction supports rent growth.
Investment metrics
- 1% rule
- 3.77% ✓
- Cap rate
- 10.00%
- Cash-on-cash
- 13.25%
- DSCR
- 1.59
- GRM
- 2.2
CMA / ARV
No comps found within radius.
Projected returns pro-forma
-3.0% appreciation · 0.0% rent growth · sell at horizon
- IRR
- -6.7%
- Equity multiple
- 0.78×
- Total profit
- $-5,979
- Equity at exit
- $14,165
- IRR
- -38.0%
- Equity multiple
- 0.37×
- Total profit
- $-16,798
- Equity at exit
- $8,214
Cash invested: $26,600 (down + closing). Projections, not guarantees.
Landlord ↔ Tenant lean methodology
- Overall (STATE)
- 87 Strongly Landlord-Friendly
- State Florida
- 87 Strongly Landlord-Friendly · R+3
- County
- — inherits STATE
- City
- — inherits STATE
ZIP-level market 33436
- Home prices YoY
- -26.0%
- Rents YoY
- -0.6%
- Active inventory
- 445
- Price-to-rent
- 2.2×
Monthly cashflow live
- Estimated rent
- $3,585 high interval (Pro) →
- Mortgage (P&I)
- −$498
- Tax from tax record
- −$158 /mo · $1,890/yr
- Insurance
- −$40
- HOA
- −$1,843
- Vacancy / Maint / Mgmt
- −$753
- Net cashflow
- $294
Break-even live
UW: 25.0% down · 7.5% · 30yr · 1.5% tax · 5.0% vac · 8.0% maint · 8.0% mgmt
Financing live
Cash to close
- Down payment
- $23,750
- Closing costs
- $2,850
- Reserves months
- —
- Total cash needed
- —
Loan-product check · same deal, 3 products live
Conventional
25% down · 7.5% · 30yr
- Down + closing
- —
- Monthly P&I
- —
- Monthly cashflow
- —
- DSCR
- —
- Eligible?
- —
Personal DTI + credit; lowest rate.
DSCR
20% down · 8.5% · 30yr
- Down + closing
- —
- Monthly P&I
- —
- Monthly cashflow
- —
- DSCR
- —
- Eligible?
- —
No personal income docs; deal must DSCR.
Hard money
10% down · 12.0% · 12mo
- Down + closing
- —
- Monthly P&I
- —
- Monthly cashflow
- —
- DSCR
- —
- Eligible?
- —
Short-term bridge; refi at stabilization.
Rent comps 40 comps
| Address | Beds | Baths | Sqft | Rent | $/sqft | DOM | Units | Dist |
|---|---|---|---|---|---|---|---|---|
| 61 Eastgate Dr Unit A Boynton Beach, FL | 2.0 | 2.0 | 1572 | $7,000 | $4.45 | 24d | 1 | 0.21mi |
| 1770 NW 22nd Ave Delray Beach, FL | 3.0 | 2.0 | 1850 | $7,000 | $3.78 | 16d | 1 | 0.21mi |
| 1630 NW 22nd Ave Delray Beach, FL | 3.0 | 2.0 | 1560 | $4,200 | $2.69 | 24d | 1 | 0.33mi |
| 1440 NW 20th Ave #104 Delray Beach, FL | 2.0 | 2.0 | 1335 | $2,650 | $1.99 | 13d | 1 | 0.40mi |
| 1860 NW 13th St #201 Delray Beach, FL | 2.0 | 2.0 | 1335 | $2,800 | $2.10 | 24d | 1 | 0.43mi |
| 1520 NW 19th Ter #203 Delray Beach, FL | 2.0 | 2.0 | 1335 | $2,200 | $1.65 | 24d | 1 | 0.43mi |
| 169 Monterey Bay Dr Boynton Beach, FL | 3.0 | 2.5 | 1389 | $2,800 | $2.02 | 14d | 1 | 0.45mi |
| 169 Monterey Bay Dr Boynton Beach, FL | 3.0 | 2.5 | 1389 | $2,800 | $2.02 | 24d | 1 | 0.45mi |
| 138 Monterey Bay Dr Boynton Beach, FL | 3.0 | 2.5 | 1551 | $2,800 | $1.81 | 1d | 1 | 0.47mi |
| 101 Lake Monterey Cir Boynton Beach, FL | 3.0 | 3.0 | 1584 | $2,999 | $1.89 | 20d | 1 | 0.50mi |
| 2583 NW 13th St Delray Beach, FL | 2.0 | 2.0 | 1466 | $2,600 | $1.77 | 17d | 1 | 0.58mi |
| 81 Nottingham Pl Boynton Beach, FL | 3.0 | 2.5 | 2209 | $3,500 | $1.58 | 17d | 1 | 0.60mi |
| 81 Nottingham Pl Boynton Beach, FL | 3.0 | 2.5 | 2209 | $3,500 | $1.58 | 22d | 1 | 0.60mi |
| 183 Lake Monterey Cir Boynton Beach, FL | 3.0 | 3.0 | 1584 | $2,800 | $1.77 | 24d | 1 | 0.60mi |
| 182 Lake Monterey Cir Boynton Beach, FL | 2.0 | 2.5 | 1423 | $2,500 | $1.76 | 22d | 1 | 0.60mi |
| 182 Lake Monterey Cir Boynton Beach, FL | 2.0 | 2.5 | 1423 | $2,500 | $1.76 | 24d | 1 | 0.60mi |
| 2915 NW 12th St Unit D Delray Beach, FL | 2.0 | 2.0 | 1499 | $3,200 | $2.13 | 7d | 1 | 0.72mi |
| 30 Beechdale Ln Boynton Beach, FL | 3.0 | 2.5 | 2226 | $3,300 | $1.48 | 22d | 1 | 0.73mi |
| 2622 NW 7th Ct Delray Beach, FL | 2.0 | 2.5 | 1384 | $2,750 | $1.99 | 24d | 1 | 0.92mi |
| 4020 Sabal Lakes Rd Delray Beach, FL | 4.0 | 2.5 | 2310 | $4,050 | $1.75 | 24d | 1 | 0.96mi |
| 797 NW 32nd Ave Delray Beach, FL | 2.0 | 2.0 | 1480 | $2,800 | $1.89 | 17d | 1 | 0.97mi |
| 797 NW 32nd Ave Delray Beach, FL | 2.0 | 2.0 | 1480 | $2,800 | $1.89 | 24d | 1 | 0.97mi |
| 2712 Lake Ida Rd Delray Beach, FL | 3.0 | 2.0 | 1604 | $4,000 | $2.49 | 7d | 1 | 0.99mi |
| 17 Country Lake Cir Boynton Beach, FL | 3.0 | 2.5 | 2312 | $4,250 | $1.84 | 22d | 1 | 1.02mi |
| 17 Country Lake Cir Boynton Beach, FL | 3.0 | 2.5 | 2312 | $4,250 | $1.84 | 24d | 1 | 1.02mi |
| 2941 Angler Dr Delray Beach, FL | 3.0 | 2.0 | 1578 | $5,000 | $3.17 | 24d | 1 | 1.04mi |
| 945 Sunflower Ave Delray Beach, FL | 3.0 | 2.0 | 1755 | $4,500 | $2.56 | 7d | 1 | 1.09mi |
| 20 Westgate Ln Unit 20G Boynton Beach, FL | 2.0 | 2.0 | 1712 | $7,990 | $4.67 | 10d | 1 | 1.10mi |
| 1105 Anchor Pt Delray Beach, FL | 3.0 | 2.0 | 1641 | $5,700 | $3.47 | 18d | 1 | 1.13mi |
| 494 Enfield Ct Unit Na Delray Beach, FL | 3.0 | 2.0 | 1641 | $6,500 | $3.96 | 24d | 1 | 1.14mi |
| 1590 Verawood Ln Delray Beach, FL | 3.0 | 2.5 | 2295 | $4,400 | $1.92 | 11d | 1 | 1.15mi |
| 1225 E Magnolia Cir Delray Beach, FL | 3.0 | 2.0 | 1705 | $3,700 | $2.17 | 24d | 1 | 1.15mi |
| 514 NW 13th St Delray Beach, FL | 4.0 | 2.5 | 2563 | $25,000 | $9.75 | 24d | 1 | 1.16mi |
| 4311 N Magnolia Cir Delray Beach, FL | 3.0 | 2.0 | 1705 | $3,100 | $1.82 | 24d | 1 | 1.17mi |
| 4110 NW 10th St Delray Beach, FL | 3.0 | 2.5 | 1839 | $4,500 | $2.45 | 24d | 1 | 1.18mi |
| 1502 NW 4th Ave Delray Beach, FL | 3.0 | 2.0 | 1468 | $6,800 | $4.63 | 16d | 1 | 1.19mi |
| 1201 SW 28th Ave Boynton Beach, FL | 3.0 | 2.0 | 1558 | $4,500 | $2.89 | 5d | 1 | 1.21mi |
| 3996 NW 7th Ct Delray Beach, FL | 3.0 | 2.0 | 1480 | $5,000 | $3.38 | 24d | 1 | 1.21mi |
| 302 NW 16th St Delray Beach, FL | 4.0 | 3.0 | 2304 | $15,500 | $6.73 | 24d | 1 | 1.25mi |
| 328 W Coral Trace Cir Delray Beach, FL | 3.0 | 2.5 | 1632 | $3,500 | $2.14 | 22d | 1 | 1.28mi |
HOA detail condo
- Monthly dues
- $1,843 · $22,116/yr
- Likely covers
- cable
- Assessments
- None detected in remarks — confirm with the listing agent.
Listing history 5 events
-
2026-03-16soldstatus $90,000
-
2026-02-07status Pending
-
2026-01-20$95,000 Active
-
2004-12-15soldstatus $195,000
-
1986-11-01soldstatus $165,000
ⓘ Source: listings_history table (triggers on properties + properties_extension) + one-shot
backfill from property_details.listing_events for pre-trigger history.
Tax reassessment forecast FL · Resets to sale price
- Current annual tax
- $1,890 · $158/mo
- Projected year-2 tax
- $1,890 · $158/mo
- Expected delta
- $0/yr ($0/mo · 0.0%)
ⓘ Screening estimate from a state-policy table — verify with the county assessor before closing.
Climate risk First Street
- Flood 1/10 Low FEMA zone X (unshaded) · 0% chance over 30 yrs
- Wildfire 1/10 Low
- Heat 9/10 Extreme 5 d/yr ≥105°F today · 18 d/yr by 30 yrs out
- Wind 10/10 Extreme 99% chance of damaging wind over 30 yrs
- Air quality 2/10 Low 1 unhealthy d/yr today · 2 by 30 yrs out
Nearby sold comps map
Loading sold comps map…
Walkable amenities ~0.75 mi
Loading nearby amenities…
Taxation est. · year 1
- Rental income
- $43,019
- − Mortgage interest
- −$5,321
- − Property taxes
- −$1,890
- − Insurance
- −$475
- − Repairs & maintenance
- −$3,442
- − Management
- −$3,442
- − HOA
- −$22,116
- − Depreciation
- −$2,764
- Taxable income
- $3,569
- Est. tax owed @ 24.0%
- −$857
- After-tax cash flow
- $2,669/yr
For passive investors: Depreciation is non-cash, so a rental often shows a tax loss while cash-flowing — sheltering income. Rental losses are passive: they offset passive income freely, and up to $25,000/yr can offset ordinary (W-2) income if you actively participate and your MAGI is under $100k (phasing out to $0 by $150k); unused losses carry forward. On sale, claimed depreciation is recaptured at up to 25%, and gains may owe capital-gains tax (a 1031 exchange can defer both). Figures are a year-1 estimate at your 24.0% rate — not tax advice; consult a CPA.
Schools (NCES district)
- District
- Palm Beach
- NCES district ID
- 1201500
- Math proficiency
- 46% ▼ -16.00%
- Reading proficiency
- 53% ▼ -4.00%
- Median HH income
- $53,943
- Composite
- 42.72/100
- National rank
- #3160
- State rank
- #34 of 73 in FL
Livability — Boynton Beach
- Score
- 72/100
- State rank
- #351
- US rank
- #6098
Category grades
Schools grade is shown separately in the Schools card above.
Census & demographics
- Census place
- Boynton Beach, FL
- County
- Palm Beach County · 1,438,312 people
- Metro
- Miami-Fort Lauderdale-Pompano Beach, FL
- Population (ZIP)
- 48,743
- Household income
- $75,789
- Rent vs Own
- Severe rent burden
- 1813.0
Population outlook (Palm Beach County) Hauer SSP2
- Today (2025)
- 1,637,487 people
- By 2030
- 1,743,255 · +6.5%
- By 2040
- 1,948,712 · +19.0%
- By 2050
- 2,132,979 · +30.3%
- By 2075
- 2,530,027 · +54.5%
- By 2100
- 2,706,979 · +65.3%
Race, ethnicity, and origin ACS 2023
- Neighborhood character
- Diverse neighborhood (Simpson 0.64)
- Race & ethnicity
- White 52% Black 24% Hispanic / Latino 19% Two or more races 10% Asian 2%
- Hispanic origin (detail)
- Mexican 2% Puerto Rican 4% Cuban 3% Dominican 1%
- Common ancestry
- Hispanic 12% Romanian 3% Scotch-Irish 2%
- Foreign-born
- 27% · Canada, Jamaica, Vietnam
- Languages at home
- 64% English-only · Spanish 14% French/Haitian/Cajun 13% Other Indo-European 2%
Political lean MEDSL · Palm Beach
- 2024 margin
- Toss-up / Even · D 50.0% · R 49.2%
- 2008→2024 swing
- -22.1pp toward R · 2008: 22.9pp · 2024: 0.8pp
- All cycles
- 2024: D+0.8 2020: D+12.8 2016: D+15.3 2012: D+17.0 2008: D+22.9
Not yet ingested
- Civics
- —
Market trends
- HPI YoY
- ▼ -109.59%
- Current HPI
- 311.7742
- Rent YoY
- ▼ -0.57%
- Metro
- Miami-Fort Lauderdale-Pompano Beach, FL
- State GDP YoY
- ▲ 3.28%
- F500 in state
- 36
Industry mix (Fortune 500 HQ in FL)
| Industry | F500 HQs | Revenue |
|---|---|---|
| Industrial Technology | 2 | $29B |
|
||
| Insurance | 2 | $17B |
|
||
| Retail | 1 | $60B |
|
||
| Technology Distribution | 1 | $58B |
|
||
| Homebuilding | 1 | $35B |
|
||
| Technology Manufacturing | 1 | $35B |
|
||
Price history
-45.5% since first listed5 events — show timeline
- 2026-03-16 Sold (Public Records) $90,000 Public Records
- 2026-02-07 Pending — MARMLS
- 2026-01-20 Listed $95,000 MARMLS
- 2004-12-15 Sold (Public Records) $195,000 Public Records
- 1986-11-01 Sold (Public Records) $165,000 Public Records
Property tax history
-1.6%/yrLatest (2025): $1,890 · +3.4% YoY. Source: county tax records.
Cash-flow waterfall
monthlySold comps — $/sqft
last 12 mo · ≤1 miLoading sold comps…