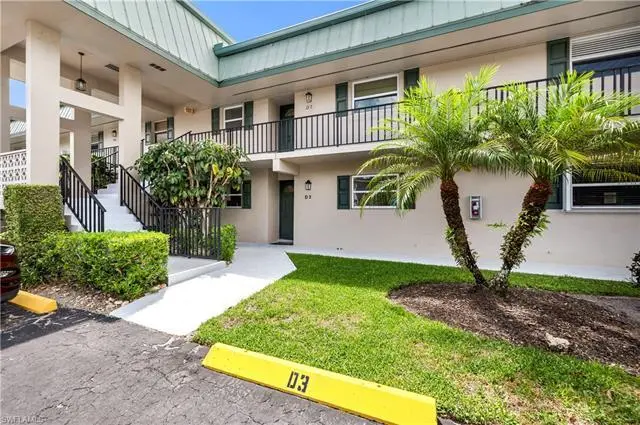
600 Valley Stream Dr Unit D3 · Lely, FL
Flood risk 9/10 · Severe
- FEMA flood zone
- AE
- Chance of flooding over 30 yrs
- 0.99%
- Est. flood insurance / yr
- $1,737 – $8,500
Fire risk 2/10 · Minimal
- Est. fire insurance / yr
- $947 – $1,759
Heat risk 10/10 · Severe
- Hot days now (above 107°F)
- 7 days/yr
- Hot days in 30 yrs
- 27 days/yr
Wind risk 10/10 · Severe
- Chance of severe wind over 30 yrs
- 99.0%
Air-quality risk 2/10 · Minimal
- Unhealthy air days now
- 2 days/yr
- Unhealthy air days in 30 yrs
- 2 days/yr
Risk factors via First Street. Map © Google.
Why this score? — see what drove the C grade
The composite is a weighted blend of 9 inputs, each scored 0–100. Each bar is that input's sub-score; the figure is the points it added to the 100-point composite (weight × sub-score).
- Cash flow +19.4/30.0
- 1% rule +10.0/10.0
- ARV discount +7.5/15.0
- DSCR +6.1/10.0
- Schools +5.0/10.0
- Rent growth +3.9/5.0
- Livability +3.3/5.0
- Condition / age +2.5/5.0
- Appreciation +0.0/10.0
$200,000
🖨 Deal sheet (PDF) 📄 Offer letter ✓ Due diligence
Listing remarks MLS
PARADISE $ BEST BUY $ Terrific LOCATION! Terrific $ Value$ Over 1,400 square feet of living area in this spacious first floor garden condo with canal and golf course views (without the golf fees!). Lovingly well maintained 2 bedroom, 2 bath unit is ready for you to move in. Newer appliances, air conditioner (4yrs), hot water heater (3yrs). Lanai has been opened to provide additional living area. Manual hurricane shutters. Unbeatable closet and storage space for this size condo. Located on a private street. Convenient to all of Naples and Marco Island shopping, dining and the white sandy beaches. Very friendly, and well managed 55 plus community.
Key facts
- Tile flooring
- Fresh interior paint
- Lake and canal views
Tags
Property features AI
Finance
- Other: Building contains 10 units; this listing is one unit per floor in a building with one floor of units; Canal width approximately 31–80 feet
- HOA & community: Mandatory HOA with professional management; HOA covers cable, insurance, irrigation water, lawn/land maintenance, manager, pest control (exterior), recreation facilities, repairs, reserves, street maintenance, trash removal, and water; Community pool; Sidewalks; Total one-time fees of $200; Non-gated community
Exterior
- Parking: 1 assigned parking space
- Security: Underground utilities (community feature)
- Utilities: Central water; Central sewer; Cable available
- Home design: Residential property in VALLEY STREAM TOWNHOUSE; Low-rise (1-3) building; 2-story garden-style apartment; Zero lot line; Rear exposure facing east
- Construction: Built in 1973; Concrete block construction; Stucco exterior finish; Metal and rolled roofing
- Exterior features: Automatic sprinkler system; Shutters (manual); Canal and lake waterfront; Water view; Irrigation from lake/canal
Interior
- Kitchen: Range; Microwave; Dishwasher; Disposal; Refrigerator/freezer; Refrigerator with icemaker; Pantry
- Bedrooms: 2 bedrooms; First-floor bedroom; Master bedroom on ground level; Split bedroom floor plan
- Flooring: Laminate floors; Tile floors
- Bathrooms: 2 full bathrooms; Master bathroom with shower only
- Heating & cooling: Central electric heat; Central electric air conditioning; Ceiling fans
- Interior features: Cable prewire; Custom mirrors; High-speed internet available; Pantry; Walk-in closet; Window coverings; Dining area in living room; Glass porch; Great room
- Laundry & utility: Washer; Dryer; Laundry in residence
Neighborhood map
What this means for you Summary
Snapshot
- This is a 2-bed/2.0-bath condo listed at $200k.
Deal economics
- At list price, monthly cash flow is $-203 ($-2k/yr) — negative.
- To cash-flow at today's rent, offer at most $164k (17.9% below list).
- Meets the 1% rule at list price ($3k rent vs $200k).
- Recommended offer: $164k (17.9% below list) — sets the bar for cash-flow.
Location & tenants
- Location reads 66/100 on livability (#586 in FL) — a middle-class / working-renter tenant base. Strengths: crime A+, housing A+; Watch: health & safety D, amenities F, commute F.
- Collier (suburban): math 60% / reading 56% proficiency, ranked #16 of 73 in FL (top 22%) — acceptable for families but not a draw, mixed tenant base, ~2y average lease.
- Zoned schools: Lely Elementary School (math 45% / reading 46%, grade D-, #1,247 of 2,144 statewide, top 59%, 499 students, 62% FRL); Manatee Middle School (math 61% / reading 43%, grade C+, #217 of 571 statewide, top 40%, 749 students, 64% FRL); Lely High School (math 40% / reading 39%, grade F, #304 of 667 statewide, top 47%, 1,504 students, 54% FRL).
- Zoned-school proficiency averages 46% at this address vs 58% district-wide (-12 pts) — the specific schools serving this property underperform the Collier average; the district grade overstates school quality for this exact location.
- Market conditions: Rents rising fast (+5.6%/yr); 599 active listings in the ZIP; 40 comparable units currently listed for rent nearby; rentals at typical pace (median 26d on market — plan ~3-4 weeks tenant-placement turnaround); solid renter incomes; 3,520 units permitted in Collier County in 2024 (959 in 5+ unit buildings).
- This rent runs 44% of the median local income ($82k/yr) — at the standard rent-burdened threshold; future hikes will face affordability resistance.
Forward outlook
- Local home prices are declining (-3.0%/yr); year-one equity from $1k of loan paydown is wiped out by about $6k of value loss. Plan a longer hold.
- Collier County population projected at +30% by 2050 — long-run rental-demand tailwind backs the buy-and-hold thesis.
Negotiation context
- It's been on market 21 days — a 2% lower offer ($197k) is reasonable based on typical stale-listing flexibility.
- 2 sale attempts since 12y ago with the ask held roughly flat each time — persistent listings suggest the price (not the market) is what's stuck; bring a comps-based counter.
- Current owner paid $92k; list at $200k implies a 117% gain — meaningful room to come down on a strong offer.
Risks & watch-outs
- Watch-outs: flood insurance adds $427/mo; HOA is 28% of rent.
- Climate carrying-cost: in FEMA flood zone AE (mandatory federal flood insurance); severe wind risk, 99% chance of damaging wind over 30y; extreme-heat days projected 7→27/yr by 2055 (HVAC capex compounding) — expect insurance premiums to compound above CPI over the hold.
Questions for the listing agent
- What do current leases actually rent for vs. the listed asking? Can we see a recent rent roll and the last 12 months of T-12 income?
- Built in 1973 — when were the roof, HVAC, electrical panel, plumbing, and water heater last replaced?
- What's the actual annual flood-insurance premium (NFIP or private), and is the property in a SFHA with mandatory coverage?
- What does the HOA fee cover, when was the last increase, and are there any pending special assessments or reserve-fund shortfalls?
- Any open or pending special assessments — roof, HVAC, plumbing, elevator, façade? What's the per-unit balance and payoff schedule, and is the seller paying it off at close or rolling it to the buyer?
- Is there a deadline driving the sale (1031 exchange, divorce, estate, relocation)? That informs how much negotiation room exists.
- Schools are D-rated, which usually means shorter tenancies and higher turnover. Who's the typical renter profile here, and what's been the actual vacancy rate?
- What's the average days-on-market for RENTAL listings here right now (not sales)? A rising rental-DOM trend means longer vacancies and softer asking-rent achievability than the comps imply.
- What's the recent tenant-quality profile in this submarket — average credit score on applications, eviction rate, late-payment / NSF rate, and stable-employment percentage? A property-management company in the area should have these aggregated.
- How much new apartment / multifamily construction is in the pipeline within 1–3 miles? Heavy new supply (>2% of stock underway) typically softens rents 12–24 months out; light construction supports rent growth.
Investment metrics
- 1% rule
- 1.50% ✓
- Cap rate
- 7.63%
- Cash-on-cash
- 4.79%
- DSCR
- 1.21
- GRM
- 5.6
CMA / ARV
No comps found within radius.
Projected returns pro-forma
-3.0% appreciation · 5.59% rent growth · sell at horizon
- IRR
- -17.7%
- Equity multiple
- 0.35×
- Total profit
- $-36,537
- Equity at exit
- $29,821
- IRR
- -2.3%
- Equity multiple
- 0.81×
- Total profit
- $-10,583
- Equity at exit
- $17,292
Cash invested: $56,000 (down + closing). Projections, not guarantees.
Landlord ↔ Tenant lean methodology
- Overall (STATE)
- 87 Strongly Landlord-Friendly
- State Florida
- 87 Strongly Landlord-Friendly · R+3
- County
- — inherits STATE
- City
- — inherits STATE
ZIP-level market 34113
- Rents YoY
- 5.6%
- Active inventory
- 599
- Price-to-rent
- 5.6×
Monthly cashflow live
- Estimated rent
- $3,001 high interval (Pro) →
- Mortgage (P&I)
- −$1,049
- Tax from tax record
- −$162 /mo · $1,950/yr
- Insurance
- −$83
- Flood insurance flood zone
- −$427 /mo · $5,118/yr
- HOA
- −$853
- Lot rent
- −$0
- Vacancy / Maint / Mgmt
- −$630
- Net cashflow
- $-203
Break-even live
Sensitivity live
| Price | -10% $-90 | -5% $-146 | +0% $-203 | +5% $-260 | +10% $-316 |
|---|---|---|---|---|---|
| Rent | -10% $-440 | -5% $-322 | +0% $-203 | +5% $-84 | +10% $34 |
| Rate | -1.0pp $-102 | -0.5pp $-152 | base $-203 | +0.5pp $-255 | +1.0pp $-308 |
UW: 25.0% down · 7.5% · 30yr · 1.5% tax · 5.0% vac · 8.0% maint · 8.0% mgmt
Financing live
Cash to close
- Down payment
- $50,000
- Closing costs
- $6,000
- Reserves months
- —
- Total cash needed
- —
Loan-product check · same deal, 3 products live
Conventional
25% down · 7.5% · 30yr
- Down + closing
- —
- Monthly P&I
- —
- Monthly cashflow
- —
- DSCR
- —
- Eligible?
- —
Personal DTI + credit; lowest rate.
DSCR
20% down · 8.5% · 30yr
- Down + closing
- —
- Monthly P&I
- —
- Monthly cashflow
- —
- DSCR
- —
- Eligible?
- —
No personal income docs; deal must DSCR.
Hard money
10% down · 12.0% · 12mo
- Down + closing
- —
- Monthly P&I
- —
- Monthly cashflow
- —
- DSCR
- —
- Eligible?
- —
Short-term bridge; refi at stabilization.
Rent comps 40 comps
| Address | Beds | Baths | Sqft | Rent | $/sqft | DOM | Units | Dist |
|---|---|---|---|---|---|---|---|---|
| 4977 Pepper Cir #205 Naples, FL | 2.0 | 2.0 | 1250 | $2,250 | $1.80 | 24d | 1 | 0.08mi |
| 300 Valley Stream Dr Unit 3D Naples, FL | 2.0 | 2.0 | 979 | $1,795 | $1.83 | 24d | 1 | 0.12mi |
| 300 Valley Stream Dr Unit 3D Naples, FL | 2.0 | 2.0 | 979 | $1,795 | $1.83 | 26d | 1 | 0.12mi |
| 200 Valley Stream Dr Unit 8B Naples, FL | 2.0 | 2.0 | 979 | $1,750 | $1.79 | 26d | 1 | 0.16mi |
| 5483 Rattlesnake Hammock Rd Unit 201B Naples, FL | 2.0 | 2.0 | 1071 | $1,800 | $1.68 | 16d | 1 | 0.24mi |
| 4900 Biscayne Dr #22 Naples, FL | 2.0 | 2.0 | 1108 | $1,800 | $1.62 | 24d | 1 | 0.27mi |
| 4830 Cortez Cir Naples, FL | 3.0 | 2.0 | 1218 | $3,100 | $2.55 | 26d | 1 | 0.37mi |
| 4907 Catalina Dr Unit 45 Naples, FL | 3.0 | 2.0 | 1270 | $1,900 | $1.50 | 16d | 1 | 0.38mi |
| 4911 Catalina Dr Unit 22 Naples, FL | 3.0 | 1.5 | 1200 | $1,950 | $1.62 | 16d | 1 | 0.38mi |
| 4360 Petal Dr Naples, FL | 3.0 | 1.0–2.0 | 1018 | $2,566 | $2.52 | 16d | 37 | 0.44mi |
| 232 Pebble Beach Blvd #104 Naples, FL | 3.0 | 2.0 | 1298 | $1,975 | $1.52 | 26d | 1 | 0.47mi |
| 30 Maui Cir #30 Naples, FL | 3.0 | 2.0 | 1552 | $2,795 | $1.80 | 26d | 1 | 0.49mi |
| 190 Pebble Beach Blvd #301 Naples, FL | 2.0 | 2.0 | 954 | $1,700 | $1.78 | 26d | 1 | 0.51mi |
| 4300 Gulfstream Dr Unit 2D Naples, FL | 2.0 | 2.0 | 1115 | $1,295 | $1.16 | 26d | 1 | 0.57mi |
| 6875 Saona Ct Naples, FL | 2.0 | 2.0 | 1565 | $8,000 | $5.11 | 26d | 1 | 0.57mi |
| 240 Pebble Beach Blvd #702 Naples, FL | 2.0 | 2.0 | 1090 | $4,000 | $3.67 | 26d | 1 | 0.57mi |
| 4261 Pearl Harbor Dr Unit 1546170P Naples, FL | 3.0 | 2.0 | 1797 | $3,387 | $1.88 | 16d | 1 | 0.58mi |
| 5419 Rattlesnake Hammock Rd Unit 307F Naples, FL | 2.0 | 2.0 | 1071 | $1,950 | $1.82 | 16d | 1 | 0.59mi |
| 4290 Gulfstream Dr #5 Naples, FL | 2.0 | 2.0 | 956 | $1,600 | $1.67 | 26d | 1 | 0.60mi |
| 4231 Gulfstream Dr Apt 102 Naples, FL | 3.0 | 2.0 | 1178 | $1,995 | $1.69 | 16d | 1 | 0.64mi |
| 332 Charlemagne Blvd Unit H103 Naples, FL | 2.0 | 2.0 | 1082 | $3,495 | $3.23 | 26d | 1 | 0.65mi |
| 332 Charlemagne Blvd Unit H101 Naples, FL | 2.0 | 2.0 | 1082 | $3,500 | $3.23 | 26d | 1 | 0.65mi |
| 213 Bay Meadows Dr Naples, FL | 3.0 | 2.0 | 1650 | $5,500 | $3.33 | 26d | 1 | 0.68mi |
| 3625 Boca Ciega Dr Naples, FL | 2.0 | 2.0 | 930 | $2,400 | $2.58 | 26d | 2 | 0.68mi |
| 5499 Rattlesnake Hammock Rd Naples, FL | 2.0 | 2.0 | 1071 | $1,775 | $1.66 | 16d | 2 | 0.68mi |
| 360 Charlemagne Blvd Unit D105 Naples, FL | 2.0 | 2.0 | 1082 | $3,200 | $2.96 | 26d | 1 | 0.72mi |
| 6984 Saona Ct Naples, FL | 2.0 | 2.0 | 1472 | $7,500 | $5.10 | 26d | 1 | 0.75mi |
| 7259 Cayo Coco Ln Naples, FL | 2.0 | 2.0 | 1411 | $6,500 | $4.61 | 26d | 1 | 0.75mi |
| 2093 Pine Isle Ln #2093 Naples, FL | 2.0 | 2.0 | 927 | $1,695 | $1.83 | 26d | 1 | 0.75mi |
| 7263 Cayo Coco Ln Naples, FL | 2.0 | 2.0 | 1321 | $6,500 | $4.92 | 26d | 1 | 0.75mi |
| 4410 Chantelle Dr Unit H-205 Naples, FL | 2.0 | 2.0 | 1349 | $3,500 | $2.59 | 16d | 1 | 0.77mi |
| 7096 Dominica Dr Naples, FL | 2.0 | 2.0 | 1563 | $7,500 | $4.80 | 26d | 1 | 0.77mi |
| 3655 Boca Ciega Dr #202 Naples, FL | 2.0 | 2.0 | 966 | $1,800 | $1.86 | 26d | 1 | 0.77mi |
| 7299 Cayo Coco Ln Naples, FL | 2.0 | 2.0 | 1476 | $6,500 | $4.40 | 26d | 1 | 0.77mi |
| 5595 Greenwood Cir #92 Naples, FL | 3.0 | 2.0 | 1450 | $5,000 | $3.45 | 26d | 1 | 0.78mi |
| 148 Lake Point Ln Naples, FL | 2.0 | 2.5 | 1530 | $2,100 | $1.37 | 26d | 1 | 0.78mi |
| 7142 Cayo Coco Ln Naples, FL | 2.0 | 2.0 | 1490 | $10,000 | $6.71 | 26d | 1 | 0.78mi |
| 7204 Cayo Coco Ln Naples, FL | 2.0 | 2.0 | 1308 | $7,500 | $5.73 | 26d | 1 | 0.78mi |
| 7110 Cayo Coco Ln Naples, FL | 2.0 | 2.0 | 1387 | $9,250 | $6.67 | 26d | 1 | 0.78mi |
| 7138 Cayo Coco Ln Naples, FL | 2.0 | 2.0 | 1205 | $6,500 | $5.39 | 26d | 1 | 0.78mi |
HOA detail condo
- Monthly dues
- $853 · $10,236/yr
- Likely covers
- water
- Assessments
- None detected in remarks — confirm with the listing agent.
Listing history 14 events
-
2026-06-23days on market $200,000 Active 21 DOM
-
2026-06-21days on market $200,000 Active 20 DOM
-
2026-06-18days on market $200,000 Active 17 DOM
-
2026-06-17days on market $200,000 Active 16 DOM
-
2026-06-16days on market $200,000 Active 15 DOM
-
2026-06-15days on market $200,000 Active 14 DOM
-
2026-06-14days on market $200,000 Active 12 DOM
-
2026-06-10days on market $200,000 Active 9 DOM
-
2026-06-09days on market $200,000 Active 8 DOM
-
2026-06-08days on market $200,000 Active 7 DOM
-
2026-06-07days on market $200,000 Active 6 DOM
-
2026-06-03days on market $200,000 Active 2 DOM
-
2026-06-01remarks 693-char remark
-
2026-06-01$200,000 Active 1 DOM
ⓘ Source: listings_history table (triggers on properties + properties_extension) + one-shot
backfill from property_details.listing_events for pre-trigger history.
Tax reassessment forecast FL · Resets to sale price
- Current annual tax
- $1,950 · $162/mo
- Projected year-2 tax
- $1,950 · $162/mo
- Expected delta
- $0/yr ($0/mo · 0.0%)
ⓘ Screening estimate from a state-policy table — verify with the county assessor before closing.
Climate risk First Street
- Flood 9/10 Extreme FEMA zone AE · 99% chance over 30 yrs
- Wildfire 2/10 Low
- Heat 10/10 Extreme 7 d/yr ≥107°F today · 27 d/yr by 30 yrs out
- Wind 10/10 Extreme 99% chance of damaging wind over 30 yrs
- Air quality 2/10 Low 2 unhealthy d/yr today · 2 by 30 yrs out
Nearby sold comps map
Loading sold comps map…
Walkable amenities ~0.75 mi
Loading nearby amenities…
Taxation est. · year 1
- Rental income
- $36,018
- − Mortgage interest
- −$11,203
- − Property taxes
- −$1,950
- − Insurance
- −$6,118
- − Repairs & maintenance
- −$2,881
- − Management
- −$2,881
- − HOA
- −$10,236
- − Depreciation
- −$5,818
- Taxable loss
- −$5,071
- Est. tax savings @ 24.0%
- +$1,217
- After-tax cash flow
- $-1,219/yr
For passive investors: Depreciation is non-cash, so a rental often shows a tax loss while cash-flowing — sheltering income. Rental losses are passive: they offset passive income freely, and up to $25,000/yr can offset ordinary (W-2) income if you actively participate and your MAGI is under $100k (phasing out to $0 by $150k); unused losses carry forward. On sale, claimed depreciation is recaptured at up to 25%, and gains may owe capital-gains tax (a 1031 exchange can defer both). Figures are a year-1 estimate at your 24.0% rate — not tax advice; consult a CPA.
Schools (NCES district)
- District
- Collier
- NCES district ID
- 1200330
- Math proficiency
- 60% ▼ -4.00%
- Reading proficiency
- 56% ▼ -2.00%
- Median HH income
- $58,275
- Composite
- 50.23/100
- National rank
- #1892
- State rank
- #16 of 73 in FL
Livability — Lely
- Score
- 66/100
- State rank
- #586
- US rank
- #11224
Category grades
Schools grade is shown separately in the Schools card above.
Census & demographics
- County
- Collier County · 396,295 people
- Metro
- Naples-Marco Island, FL
- Population (ZIP)
- 26,056
- Household income
- $81,674
- Rent vs Own
- Severe rent burden
- 954.0
Population outlook (Collier County) Hauer SSP2
- Today (2025)
- 420,858 people
- By 2030
- 450,054 · +6.9%
- By 2040
- 502,232 · +19.3%
- By 2050
- 544,932 · +29.5%
- By 2075
- 627,203 · +49.0%
- By 2100
- 659,015 · +56.6%
Race, ethnicity, and origin ACS 2023
- Neighborhood character
- Diverse neighborhood (Simpson 0.59)
- Race & ethnicity
- White 56% Hispanic / Latino 28% Black 12% Two or more races 11% Asian 2%
- Hispanic origin (detail)
- Mexican 17% Puerto Rican 3% Cuban 2%
- Common ancestry
- Hispanic 10% Romanian 3% Lithuanian 2%
- Foreign-born
- 26% · Canada, Jamaica, Vietnam
- Languages at home
- 63% English-only · Spanish 24% French/Haitian/Cajun 9% Other Indo-European 2%
Political lean MEDSL · Collier
- 2024 margin
- Solid R (+33.1) · D 33.1% · R 66.2%
- 2008→2024 swing
- -10.6pp toward R · 2008: -22.5pp · 2024: -33.1pp
- All cycles
- 2024: R+33.1 2020: R+24.7 2016: R+26.0 2012: R+30.1 2008: R+22.5
Not yet ingested
- Civics
- —
Market trends
- HPI YoY
- ▼ -194.86%
- Current HPI
- 279.4232
- Rent YoY
- ▲ 5.59%
- Metro
- Naples-Marco Island, FL
- State GDP YoY
- ▲ 3.28%
- F500 in state
- 36
Industry mix (Fortune 500 HQ in FL)
| Industry | F500 HQs | Revenue |
|---|---|---|
| Industrial Technology | 2 | $29B |
|
||
| Insurance | 2 | $17B |
|
||
| Retail | 1 | $60B |
|
||
| Technology Distribution | 1 | $58B |
|
||
| Homebuilding | 1 | $35B |
|
||
| Technology Manufacturing | 1 | $35B |
|
||
Price history
+117.4% since first listed5 events — show timeline
- 2026-06-01 Listed $200,000 NAPLESMLS
- 2014-11-24 Sold (Public Records) $92,000 Public Records
- 2014-11-21 Price Changed $97,500 NAPLESMLS
- 2014-11-21 Sold (MLS) $92,000 NAPLESMLS
- 2014-09-24 Listed $92,000 NAPLESMLS
Property tax history
+17.1%/yrLatest (2025): $1,950 · +417.8% YoY. Source: county tax records.
Cash-flow waterfall
monthlySold comps — $/sqft
last 12 mo · ≤1 miLoading sold comps…