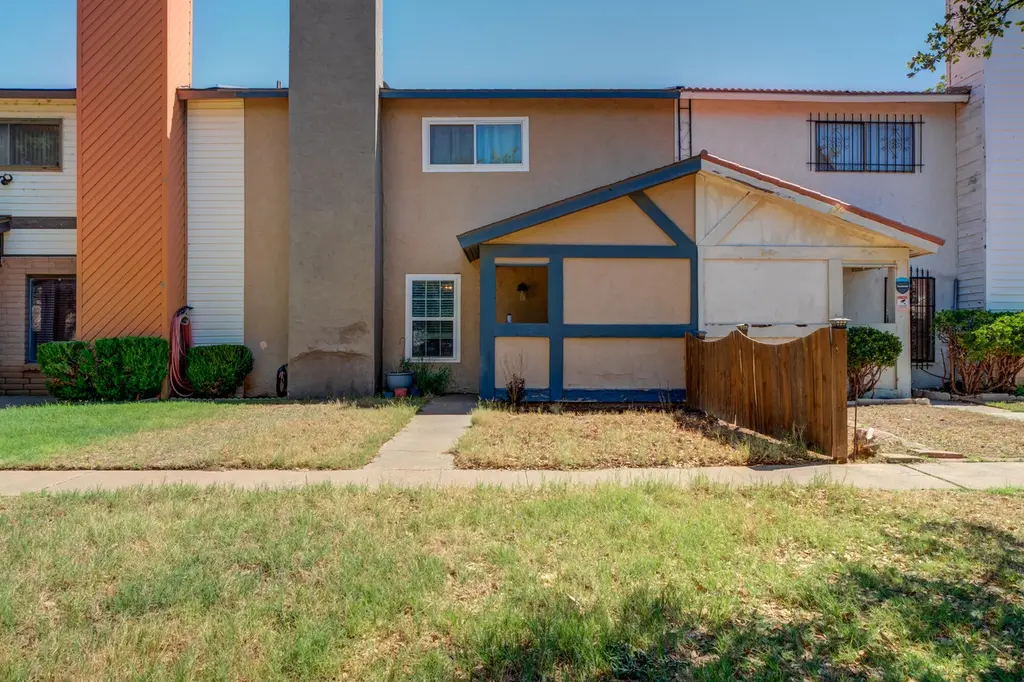
8633 Knoxville Dr Unit C-31 · Lubbock, TX
Flood risk 7/10 · Major
- FEMA flood zone
- X (unshaded)
- Chance of flooding over 30 yrs
- 0.76%
- Est. flood insurance / yr
- $507 – $1,088
Fire risk 1/10 · Minimal
- Est. fire insurance / yr
- $1,222 – $2,270
Heat risk 5/10 · Moderate
- Hot days now (above 99°F)
- 7 days/yr
- Hot days in 30 yrs
- 21 days/yr
Wind risk 2/10 · Minimal
- Chance of severe wind over 30 yrs
- —
Air-quality risk 2/10 · Minimal
- Unhealthy air days now
- 1 days/yr
- Unhealthy air days in 30 yrs
- 1 days/yr
Risk factors via First Street. Map © Google.
Why this score? — see what drove the D+ grade
The composite is a weighted blend of 9 inputs, each scored 0–100. Each bar is that input's sub-score; the figure is the points it added to the 100-point composite (weight × sub-score).
- Cash flow +16.1/30.0
- ARV discount +7.5/15.0
- DSCR +5.0/10.0
- 1% rule +4.4/10.0
- Livability +4.0/5.0
- Schools +3.1/10.0
- Rent growth +3.0/5.0
- Condition / age +2.2/5.0
- Appreciation +0.0/10.0
$151,900
🖨 Deal sheet (PDF) 📄 Offer letter ✓ Due diligence
Listing remarks MLS
This stunning 2-story townhome offers the perfect blend of comfort, convenience, and style. With 2 bedrooms, 2.5 baths, and a 2-car rear entry garage, this residence is designed to meet all your needs. The living area, perfect for relaxing or entertaining guests around a warm fireplace. The modern kitchen boasts sleek countertops, ample cabinet space, and contemporary appliances, making meal preparation a breeze. Upstairs, are two generously sized bedrooms, each with its own private bath. Outside, you'll love the convenience of the 2-car rear entry garage, providing secure parking and additional storage space, and private outdoor living. Located in Southwest Lubbock, this townhome offers easy access to shopping, dining, entertainment, and parks. Plus, with a price tag under $200,000, it's an incredible opportunity to own a piece of luxury without breaking the bank. This townhouse IS NOT in an HOA.
Key facts
- 2 story townhome
- No hoa
- 2 garage spots
Tags
Property features AI
Exterior
- Parking: Attached garage with 2 spaces; Driveway; Garage with garage door opener
- Security: Owned security system; Smoke and carbon monoxide detectors; Firewall(s)
- Utilities: Public water; Public sewer; Electric water heater
- Home design: Townhouse (attached); 2 stories; Updated/remodeled; 2+ common walls
- Construction: Stucco construction; Composition roof; Slab foundation; Built/finished as a townhouse
- Exterior features: Balcony; Covered patio
Interior
- Kitchen: Dishwasher; Electric cooktop; Electric oven; Microwave; Range hood; Eat-in layout; Pantry
- Bedrooms: Total of 5 rooms (bedroom count not specified)
- Flooring: Hardwood floors; Tile floors
- Bathrooms: 2 full bathrooms; 1 half bathroom
- Heating & cooling: Central heating; Central air; Ceiling fans; Smart thermostat
- Interior features: Beamed ceilings; Ceiling fans; Eat-in kitchen; Natural woodwork; Open floorplan; Pantry; Smart thermostat; Wood-burning fireplace in family room
- Laundry & utility: Laundry room; Washer/Dryer included; Electric water heater
Neighborhood map
What this means for you Summary
Snapshot
- This is a 2-bed/2.5-bath condo listed at $152k. Condition is rated fair.
Deal economics
- At list price, monthly cash flow is $12 ($149/yr) — positive.
- The deal already cash-flows at list — no discount required.
- To meet the 1% rule (rent ≥ 1% of price), the offer needs to be $143k (5.9% below list).
- Recommended offer: $143k (5.9% below list) — sets the bar for 1% rule.
Location & tenants
- Location reads 80/100 on livability (#37 in TX, #1,749 nationally) — a professional / high-income tenant draw. Strengths: commute A+, cost of living A+, housing A+; Watch: employment C-, crime F.
- Lubbock ISD (urban): math 36% / reading 39% proficiency, ranked #481 of 826 in TX (top 58%) — families likely to look elsewhere, expect single-tenant / working-renter base with shorter leases; 60% free/reduced lunch — lower-income household profile, screen leases tightly.
- Zoned schools: Honey El (math 67% / reading 62%, grade B, #257 of 4,322 statewide, top 6%, 420 students, 48% FRL); Evans Middle (math 34% / reading 43%, grade F, #704 of 1,662 statewide, top 43%, 799 students, 58% FRL); Monterey H S (math 28% / reading 37%, grade F, #1,029 of 1,632 statewide, top 64%, 2,114 students, 72% FRL) — zoned schools at 59% FRL track the district average.
- Market conditions: Rents rising (+2.1%/yr); 673 active listings in the ZIP; 27 comparable units currently listed for rent nearby; rentals lingering (median 46d on market — plan ~5-8 weeks vacancy on turnover, expect pricing pressure); 63% of comp listings sitting > 30 days — soft ceiling on asking rent; solid renter incomes; 2,219 units permitted in Lubbock County in 2024 (252 in 5+ unit buildings).
Forward outlook
- Local home prices are declining (-3.0%/yr); year-one equity from $1k of loan paydown is wiped out by about $5k of value loss. Plan a longer hold.
- Lubbock County population projected at +39% by 2050 — long-run rental-demand tailwind backs the buy-and-hold thesis.
Negotiation context
- It's been on market 16 days — a 2% lower offer ($150k) is reasonable based on typical stale-listing flexibility.
- 4 sale attempts since 3y ago with the ask held roughly flat each time — persistent listings suggest the price (not the market) is what's stuck; bring a comps-based counter.
Risks & watch-outs
- Watch-outs: flood insurance adds $66/mo.
- Climate carrying-cost: major flood risk; extreme-heat days projected 7→21/yr by 2055 (HVAC capex compounding) — expect insurance premiums to compound above CPI over the hold.
Questions for the listing agent
- Have any recent inspections been done? Can we get a copy of the seller's disclosures and any deferred-maintenance estimates?
- Built in 1979 — when were the roof, HVAC, electrical panel, plumbing, and water heater last replaced?
- What's the actual annual flood-insurance premium (NFIP or private), and is the property in a SFHA with mandatory coverage?
- Any open or pending special assessments — roof, HVAC, plumbing, elevator, façade? What's the per-unit balance and payoff schedule, and is the seller paying it off at close or rolling it to the buyer?
- Is there a deadline driving the sale (1031 exchange, divorce, estate, relocation)? That informs how much negotiation room exists.
- Schools are D-rated, which usually means shorter tenancies and higher turnover. Who's the typical renter profile here, and what's been the actual vacancy rate?
- Crime grade is F in this area — have there been break-ins, vandalism, or insurance claims at this property in the last 3 years? What carrier currently insures it and at what premium?
- The area grade is low — what's the realistic commute time and amenity access for the typical tenant pool here? Any planned neighborhood developments (good or bad) we should know about?
- What's the average days-on-market for RENTAL listings here right now (not sales)? A rising rental-DOM trend means longer vacancies and softer asking-rent achievability than the comps imply.
- What's the recent tenant-quality profile in this submarket — average credit score on applications, eviction rate, late-payment / NSF rate, and stable-employment percentage? A property-management company in the area should have these aggregated.
- How much new apartment / multifamily construction is in the pipeline within 1–3 miles? Heavy new supply (>2% of stock underway) typically softens rents 12–24 months out; light construction supports rent growth.
Investment metrics
- 1% rule
- 0.94% ✗
- Cap rate
- 6.92%
- Cash-on-cash
- 2.23%
- DSCR
- 1.10
- GRM
- 8.9
CMA / ARV
No comps found within radius.
Projected returns pro-forma
-3.0% appreciation · 2.13% rent growth · sell at horizon
- IRR
- -16.7%
- Equity multiple
- 0.41×
- Total profit
- $-25,001
- Equity at exit
- $22,649
- IRR
- -10.2%
- Equity multiple
- 0.40×
- Total profit
- $-25,499
- Equity at exit
- $13,134
Cash invested: $42,532 (down + closing). Projections, not guarantees.
Landlord ↔ Tenant lean methodology
- Overall (STATE)
- 87 Strongly Landlord-Friendly
- State Texas
- 87 Strongly Landlord-Friendly · R+5
- County
- — inherits STATE
- City
- — inherits STATE
ZIP-level market 79423
- Rents YoY
- 2.1%
- Active inventory
- 673
- Price-to-rent
- 8.9×
Monthly cashflow live
- Estimated rent
- $1,429 high interval (Pro) →
- Mortgage (P&I)
- −$797
- Tax est. 1.5%
- −$190 /mo · $2,278/yr
- Insurance
- −$63
- Flood insurance flood zone
- −$66 /mo · $798/yr
- HOA
- −$0
- Vacancy / Maint / Mgmt
- −$300
- Net cashflow
- $12
Break-even live
Sensitivity live
| Price | -10% $117 | -5% $65 | +0% $12 | +5% $-40 | +10% $-93 |
|---|---|---|---|---|---|
| Rent | -10% $-100 | -5% $-44 | +0% $12 | +5% $69 | +10% $125 |
| Rate | -1.0pp $89 | -0.5pp $51 | base $12 | +0.5pp $-27 | +1.0pp $-67 |
UW: 25.0% down · 7.5% · 30yr · 1.5% tax · 5.0% vac · 8.0% maint · 8.0% mgmt
Financing live
Cash to close
- Down payment
- $37,975
- Closing costs
- $4,557
- Reserves months
- —
- Total cash needed
- —
Loan-product check · same deal, 3 products live
Conventional
25% down · 7.5% · 30yr
- Down + closing
- —
- Monthly P&I
- —
- Monthly cashflow
- —
- DSCR
- —
- Eligible?
- —
Personal DTI + credit; lowest rate.
DSCR
20% down · 8.5% · 30yr
- Down + closing
- —
- Monthly P&I
- —
- Monthly cashflow
- —
- DSCR
- —
- Eligible?
- —
No personal income docs; deal must DSCR.
Hard money
10% down · 12.0% · 12mo
- Down + closing
- —
- Monthly P&I
- —
- Monthly cashflow
- —
- DSCR
- —
- Eligible?
- —
Short-term bridge; refi at stabilization.
Rent comps 27 comps
| Address | Beds | Baths | Sqft | Rent | $/sqft | DOM | Units | Dist |
|---|---|---|---|---|---|---|---|---|
| 8601 Memphis Dr Unit A 8 Lubbock, TX | 2.0 | 1.5 | 1069 | $1,150 | $1.08 | 45d | 1 | 0.09mi |
| 8604 Jordan Dr Lubbock, TX | 3.0 | 2.0 | 1855 | $1,900 | $1.02 | 45d | 1 | 0.23mi |
| 3417 83rd Dr Lubbock, TX | 3.0 | 2.0 | 1642 | $1,650 | $1.00 | 23d | 1 | 0.35mi |
| 9001 Indiana Ave Unit C Lubbock, TX | 2.0 | 1.0 | 1100 | $699 | $0.64 | 45d | 1 | 0.48mi |
| 9715 Joliet Ave Lubbock, TX | 2.0 | 2.0 | 1589 | $1,400 | $0.88 | 45d | 1 | 0.65mi |
| 3311 79th St Lubbock, TX | 2.0 | 1.0 | 1391 | $1,249 | $0.90 | 45d | 1 | 0.73mi |
| 9818 Jordan Ave Unit B Lubbock, TX | 3.0 | 2.0 | 1497 | $1,500 | $1.00 | 45d | 1 | 0.77mi |
| 8310 Raleigh Ave Unit A Lubbock, TX | 3.0 | 2.0 | 1411 | $1,300 | $0.92 | 15d | 1 | 0.79mi |
| 8216 Elkridge Ave Lubbock, TX | 3.0 | 2.0 | 1412 | $1,550 | $1.10 | 23d | 1 | 0.92mi |
| 8219 Elkridge Ave Lubbock, TX | 3.0 | 2.0 | 1405 | $1,475 | $1.05 | 45d | 1 | 0.95mi |
| 3307 74th St Unit A Lubbock, TX | 3.0 | 2.5 | 2024 | $1,540 | $0.76 | 45d | 1 | 0.98mi |
| 7201 Memphis Ave Unit b Lubbock, TX | 3.0 | 2.5 | 1627 | $1,250 | $0.77 | 45d | 1 | 1.02mi |
| 3107 75th St Unit B Lubbock, TX | 2.0 | 2.0 | 1400 | $1,250 | $0.89 | 23d | 1 | 1.08mi |
| 4522 79th St Lubbock, TX | 3.0 | 2.0 | 1933 | $1,800 | $0.93 | 23d | 1 | 1.12mi |
| 3101 99th St Unit 1 Lubbock, TX | 3.0 | 2.0 | 1694 | $1,350 | $0.80 | 45d | 1 | 1.16mi |
| 4416 105th St Unit 2 Lubbock, TX | 3.0 | 3.0 | 1873 | $2,200 | $1.17 | 15d | 1 | 1.21mi |
| 4424 105th St Unit A Lubbock, TX | 3.0 | 2.5 | 1452 | $1,575 | $1.08 | 15d | 1 | 1.24mi |
| 10509 Quinton Ave Unit B Lubbock, TX | 3.0 | 3.0 | 1840 | $1,750 | $0.95 | 23d | 1 | 1.27mi |
| 4419 106th St Unit B Lubbock, TX | 3.0 | 2.5 | 1960 | $1,725 | $0.88 | 45d | 1 | 1.30mi |
| 2612 81st St Unit B Lubbock, TX | 2.0 | 2.0 | 1150 | $1,100 | $0.96 | 45d | 1 | 1.31mi |
| 7616 Utica Ave Lubbock, TX | 3.0 | 2.5 | 1913 | $2,100 | $1.10 | 45d | 1 | 1.32mi |
| 6911 Gary Ave Unit A Lubbock, TX | 3.0 | 2.0 | 1154 | $1,125 | $0.97 | 45d | 1 | 1.32mi |
| 6711 Hartford Ave Unit A Lubbock, TX | 2.0 | 1.5 | 1165 | $975 | $0.84 | 45d | 1 | 1.37mi |
| 4804 76th St Unit A Lubbock, TX | 2.0 | 2.0 | 1333 | $1,350 | $1.01 | 45d | 1 | 1.39mi |
| 3203 109th St Unit B Lubbock, TX | 3.0 | 2.0 | 1400 | $1,300 | $0.93 | 45d | 1 | 1.44mi |
| 2415 93rd St Lubbock, TX | 3.0 | 2.0 | 1692 | $1,650 | $0.98 | 23d | 1 | 1.46mi |
| 3203 110th St Unit B Lubbock, TX | 3.0 | 2.0 | 1191 | $1,350 | $1.13 | 23d | 1 | 1.50mi |
HOA detail condo
- Monthly dues
- $0 · $0/yr
- Assessments
- None detected in remarks — confirm with the listing agent.
Listing history 12 events
-
2026-06-22days on market $151,900 Active 16 DOM
-
2026-06-18days on market $151,900 Active 13 DOM
-
2026-06-17days on market $151,900 Active 12 DOM
-
2026-06-16days on market $151,900 Active 11 DOM
-
2026-06-15days on market $151,900 Active 10 DOM
-
2026-06-14days on market $151,900 Active 8 DOM
-
2026-06-13days on market $151,900 Active 7 DOM
-
2026-06-10days on market $151,900 Active 5 DOM
-
2026-06-09days on market $151,900 Active 4 DOM
-
2026-06-08days on market $151,900 Active 3 DOM
-
2026-06-07remarks 687-char remark
-
2026-06-07$151,900 Active 2 DOM
ⓘ Source: listings_history table (triggers on properties + properties_extension) + one-shot
backfill from property_details.listing_events for pre-trigger history.
Climate risk First Street
- Flood 7/10 Severe FEMA zone X (unshaded) · 76% chance over 30 yrs
- Wildfire 1/10 Low
- Heat 5/10 Major 7 d/yr ≥99°F today · 21 d/yr by 30 yrs out
- Wind 2/10 Low
- Air quality 2/10 Low 1 unhealthy d/yr today · 1 by 30 yrs out
Nearby sold comps map
Loading sold comps map…
Walkable amenities ~0.75 mi
Loading nearby amenities…
Taxation est. · year 1
- Rental income
- $17,144
- − Mortgage interest
- −$8,509
- − Property taxes
- −$2,278
- − Insurance
- −$1,557
- − Repairs & maintenance
- −$1,371
- − Management
- −$1,371
- − Depreciation
- −$4,419
- Taxable loss
- −$2,363
- Est. tax savings @ 24.0%
- +$567
- After-tax cash flow
- $716/yr
For passive investors: Depreciation is non-cash, so a rental often shows a tax loss while cash-flowing — sheltering income. Rental losses are passive: they offset passive income freely, and up to $25,000/yr can offset ordinary (W-2) income if you actively participate and your MAGI is under $100k (phasing out to $0 by $150k); unused losses carry forward. On sale, claimed depreciation is recaptured at up to 25%, and gains may owe capital-gains tax (a 1031 exchange can defer both). Figures are a year-1 estimate at your 24.0% rate — not tax advice; consult a CPA.
Condition & rehab AI · 12 photos
This 2-story townhome requires moderate repairs and maintenance, particularly to the exterior siding and walls. With updates, it has the potential to significantly increase its resale and rental value.
Repairs flagged
- Major exterior siding — Signs of wear and tear
- Minor interior walls — Some wear
Value-add opportunities
- Both paint exterior — Enhances curb appeal and value
- Both repair exterior siding — Improves structural integrity and appearance
- Both update flooring — Freshens up the living space and adds value
Renovation cost estimate screening
| Repair item | Severity | Est. cost |
|---|---|---|
| exterior siding · Signs of wear and tear | Major | $15,000–50,000 |
| interior walls · Some wear | Minor | $500–3,000 |
| Total estimated repair cost · 2 items | $15,500–53,000 |
Value-add ROI direction
- Both paint exterior — Enhances curb appeal and value ↑
- Both repair exterior siding — Improves structural integrity and appearance ↑
- Both update flooring — Freshens up the living space and adds value ↑
ⓘ Cost ranges are severity-bucket heuristics (US national rule-of-thumb). Get contractor quotes + a written scope before underwriting a rehab budget.
Schools (NCES district)
- District
- Lubbock ISD
- NCES district ID
- 4828500
- Math proficiency
- 36% ▼ -8.00%
- Reading proficiency
- 39% ▼ -1.00%
- Median HH income
- $39,820
- Composite
- 31.44/100
- National rank
- #5984
- State rank
- #481 of 826 in TX
Livability — Lubbock
- Score
- 80/100
- State rank
- #37
- US rank
- #1749
Category grades
Schools grade is shown separately in the Schools card above.
Census & demographics
- Census place
- Lubbock, TX
- County
- Lubbock County · 293,542 people
- City population
- 283,030
- Metro
- Lubbock, TX
- Population (ZIP)
- 46,998
- Household income
- $84,933
- Rent vs Own
- Severe rent burden
- 1385.0
Population outlook (Lubbock County) Hauer SSP2
- Today (2025)
- 345,960 people
- By 2030
- 371,449 · +7.4%
- By 2040
- 424,539 · +22.7%
- By 2050
- 481,150 · +39.1%
- By 2075
- 633,467 · +83.1%
- By 2100
- 746,853 · +115.9%
Race, ethnicity, and origin ACS 2023
- Neighborhood character
- Majority White (61%)
- Race & ethnicity
- White 61% Hispanic / Latino 31% Two or more races 15% Black 4% Asian 2%
- Hispanic origin (detail)
- Mexican 26%
- Common ancestry
- Slovak 1% Italian 1% Serbian 1%
- Foreign-born
- 5% · Canada
- Languages at home
- 84% English-only · Spanish 13% Tagalog/Filipino 1% Other Asian/Pacific 1%
Political lean MEDSL · Lubbock
- 2024 margin
- Solid R (+39.5) · D 29.7% · R 69.2% · Other 1.0%
- 2008→2024 swing
- -2.8pp toward R · 2008: -36.7pp · 2024: -39.5pp
- All cycles
- 2024: R+39.5 2020: R+32.2 2016: R+38.4 2012: R+40.9 2008: R+36.7
Not yet ingested
- Civics
- —
Market trends
- HPI YoY
- ▼ -155.00%
- Current HPI
- 213.6491
- Rent YoY
- ▲ 2.13%
- Metro
- Lubbock, TX
- State GDP YoY
- ▲ 3.95%
- F500 in state
- 110
Industry mix (Fortune 500 HQ in TX)
| Industry | F500 HQs | Revenue |
|---|---|---|
| Energy | 16 | $1,198B |
|
||
| Technology | 5 | $198B |
|
||
| Engineering / Construction | 4 | $72B |
|
||
| Energy Services | 3 | $60B |
|
||
| Utilities | 3 | $41B |
|
||
| Healthcare | 2 | $330B |
|
||
Price history
-3.9% since first listed9 events — show timeline
- 2026-06-03 Listed $151,900 LARMLS
- 2024-05-14 Sold (MLS) — LARMLS
- 2024-03-22 Pending — LARMLS
- 2024-02-26 Price Changed $156,500 LARMLS
- 2024-01-04 Relisted — LARMLS
- 2024-01-01 Pending — LARMLS
- 2023-12-28 Relisted — LARMLS
- 2023-12-27 Pending — LARMLS
- 2023-12-15 Listed $158,000 LARMLS
Cash-flow waterfall
monthlySold comps — $/sqft
last 12 mo · ≤1 miLoading sold comps…