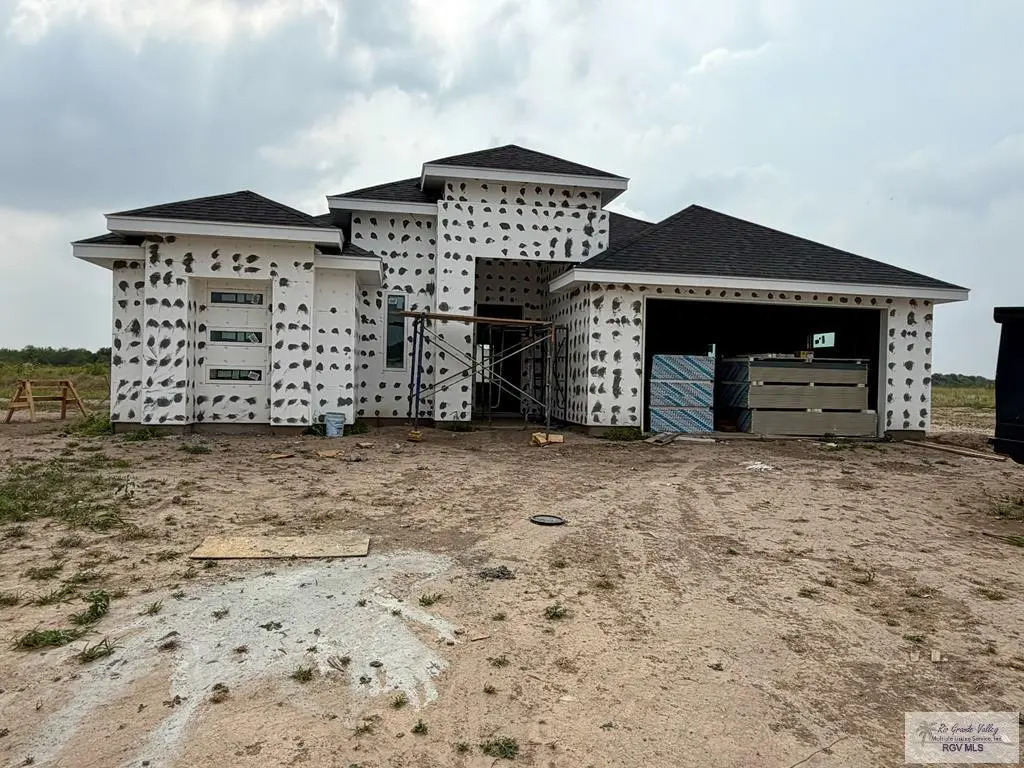
 🏗️ New Construction
7354 St Catherine Dr · Brownsville, TX
Flood risk 1/10 · Minimal
- FEMA flood zone
- X (unshaded)
- Chance of flooding over 30 yrs
- 0.0%
- Est. flood insurance / yr
- $507 – $1,088
Fire risk 2/10 · Minimal
- Est. fire insurance / yr
- $1,222 – $2,270
Heat risk 9/10 · Severe
- Hot days now (above 111°F)
- 7 days/yr
- Hot days in 30 yrs
- 26 days/yr
Wind risk 9/10 · Severe
- Chance of severe wind over 30 yrs
- 99.0%
Air-quality risk 2/10 · Minimal
- Unhealthy air days now
- 1 days/yr
- Unhealthy air days in 30 yrs
- 1 days/yr
Risk factors via First Street. Map © Google.
Why this score? — see what drove the D+ grade
The composite is a weighted blend of 9 inputs, each scored 0–100. Each bar is that input's sub-score; the figure is the points it added to the 100-point composite (weight × sub-score).
- Cash flow +14.5/30.0
- ARV discount +7.5/15.0
- Rent growth +5.0/5.0
- Condition / age +5.0/5.0
- DSCR +4.4/10.0
- 1% rule +4.0/10.0
- Livability +4.0/5.0
- Schools +3.3/10.0
- Appreciation +0.0/10.0
$325,000
🖨 Deal sheet 📄 Offer letter ✓ Due diligence
Listing remarks
Another Beautiful Home Built by LPZ DREAM BUILDERS LLC is For Sale Now! Stunning home is located In very desirable neighborhood/area with convenient access to major roads, shopping centers, and schools. It features a large kitchen with plenty of cabinet space, granite countertops, pantry, and a large center island open to the living and dining areas. This home also has large windows that look out to the backyard and allow for great natural lightning, a large laundry room , 3 bedrooms and 2.5 baths including large master bedroom with a walk-in closet, a 2 car garage and a spacious backyard. Property is still under construction and will be finished by middle of July.
Key facts
- Pantry
- Large windows
- Natural lighting
Tags
Property features AI
Exterior
- Security: Smoke detector(s)
- Utilities: Public water; Public sewer; Cable available
- Home design: Single-family residence; New construction; Single-story
- Construction: Stone and stucco construction; Slab foundation
- Exterior features: Composition roof; Located in Lago Vista subdivision
Interior
- Flooring: Tile
- Bathrooms: 2 full bathrooms; 1 half bathroom
- Heating & cooling: Central heating (electric); Central air conditioning; Ceiling fan(s)
- Interior features: Electric water heater; Tile flooring; Ceiling fans; Central air conditioning; Central electric heating; Smoke detectors
Neighborhood map
What this means for you Summary
Snapshot
- This is a 3-bed/2.5-bath single-family listed at $325k. Condition is rated excellent.
Deal economics
- At list price, monthly cash flow is $62 ($741/yr) — positive.
- To cash-flow at today's rent, offer at most $300k (7.6% below list).
- To meet the 1% rule (rent ≥ 1% of price), the offer needs to be $263k (19.2% below list).
- Recommended offer: $263k (19.2% below list) — sets the bar for 1% rule.
- Cap rate 6.5% vs local median 5.0% in Brownsville — top-decile yield for the area; either an underpriced asset or a hidden risk that comps aren't pricing in. Stress-test before assuming the spread holds.
Location & tenants
- Location reads 79/100 on livability (#62 in TX, #2,311 nationally) — a middle-class / working-renter tenant base. Strengths: commute A+, cost of living A+, housing A+; Watch: amenities D, crime D-, employment F.
- Los Fresnos CISD (suburban): math 34% / reading 44% proficiency, ranked #444 of 826 in TX (top 54%) — families likely to look elsewhere, expect single-tenant / working-renter base with shorter leases.
- Zoned schools: Villareal El (math 27% / reading 37%, grade F, #2,268 of 4,322 statewide, top 55%, 465 students, 78% FRL); Resaca Middle (math 29% / reading 44%, grade F, #786 of 1,662 statewide, top 48%, 857 students, 77% FRL); Los Fresnos H S (math 41% / reading 55%, grade D, #571 of 1,632 statewide, top 36%, 3,272 students, 82% FRL) — zoned schools average 79% FRL vs 43% district-wide (36 pts higher); higher-poverty schools than district average — tighter screening recommended.
- Market conditions: Rents rising fast (+11.4%/yr); 346 active listings in the ZIP; 6 comparable units currently listed for rent nearby; rentals at typical pace (median 21d on market — plan ~3-4 weeks tenant-placement turnaround); 2,326 units permitted in Cameron County in 2024 (503 in 5+ unit buildings).
- At $2,626/mo this rent would consume 63% of the median local household income ($50k/yr) (locally 1800% of renters already pay >50% of income on rent) — very limited rent-growth headroom before tenants either downsize or default.
Forward outlook
- Local home prices are declining (-3.0%/yr); year-one equity from $2k of loan paydown is wiped out by about $9k of value loss. Plan a longer hold.
- Cameron County population projected at +3% by 2050 — modest demand growth; plan on rents tracking national, not racing it.
Negotiation context
- It's been on market 15 days — a 2% lower offer ($320k) is reasonable based on typical stale-listing flexibility.
Risks & watch-outs
- Climate carrying-cost: severe wind risk, 99% chance of damaging wind over 30y; extreme-heat days projected 7→26/yr by 2055 (HVAC capex compounding) — expect insurance premiums to compound above CPI over the hold.
Questions for the listing agent
- Is there a deadline driving the sale (1031 exchange, divorce, estate, relocation)? That informs how much negotiation room exists.
- Crime grade is D in this area — have there been break-ins, vandalism, or insurance claims at this property in the last 3 years? What carrier currently insures it and at what premium?
- The area grade is low — what's the realistic commute time and amenity access for the typical tenant pool here? Any planned neighborhood developments (good or bad) we should know about?
- What's the average days-on-market for RENTAL listings here right now (not sales)? A rising rental-DOM trend means longer vacancies and softer asking-rent achievability than the comps imply.
- What's the recent tenant-quality profile in this submarket — average credit score on applications, eviction rate, late-payment / NSF rate, and stable-employment percentage? A property-management company in the area should have these aggregated.
- How much new for-sale + rental construction is in the pipeline within 1–3 miles? Heavy new supply typically softens prices + rents 12–24 months out; constrained supply supports both.
Investment metrics
- 1% rule
- 0.90% ✗
- Cap rate
- 6.55%
- Cash-on-cash
- 0.91%
- DSCR
- 1.04
- GRM
- 9.2
CMA / ARV
- ARV (on-the-fly)
- $291,225
- Comps found
- 2
Show comp detail 2 sales within ~0.75 mi
| Address | Dist | Beds/Ba | Sqft | Sold | Price | $/sf | Match |
|---|---|---|---|---|---|---|---|
| 7208 Dominica Dr | 0.33mi | 4/2.5 (+1) | 1,781 (+1%) | 5mo | $280,000 | $157 | 74 |
| 8830 Wentz Lk | 0.71mi | 3/2.5 | 1,847 (+5%) | 0mo | $305,000 | $165 | 59 |
Match score weights: distance 35% · size 25% · config 20% · recency 20%. Top-matched comps best support the ARV.
Projected returns pro-forma
-3.0% appreciation · 8.0% rent growth · sell at horizon
- IRR
- -9.4%
- Equity multiple
- 0.64×
- Total profit
- $-29,341
- Equity at exit
- $43,423
- IRR
- 5.8%
- Equity multiple
- 1.53×
- Total profit
- $42,835
- Equity at exit
- $25,180
Cash invested: $81,543 (down + closing). Projections, not guarantees.
Landlord ↔ Tenant lean methodology
- Overall (STATE)
- 87 Strongly Landlord-Friendly
- State Texas
- 87 Strongly Landlord-Friendly · R+5
- County
- — inherits STATE
- City
- — inherits STATE
ZIP-level market 78520
- Home prices YoY
- -19.8%
- Rents YoY
- 11.4%
- Active inventory
- 346
- Price-to-rent
- 10.3×
Monthly cashflow live
- Estimated rent
- $2,626 high interval (Pro) →
- Mortgage (P&I)
- −$1,527
- Tax est. 1.5%
- −$364 /mo · $4,368/yr
- Insurance
- −$121
- HOA
- −$0
- Vacancy / Maint / Mgmt
- −$551
- Net cashflow
- $62
Break-even live
UW: 25.0% down · 7.5% · 30yr · 1.5% tax · 5.0% vac · 8.0% maint · 8.0% mgmt
Financing live
Cash to close
- Down payment
- $72,806
- Closing costs
- $8,737
- Reserves months
- —
- Total cash needed
- —
Loan-product check · same deal, 3 products live
Conventional
25% down · 7.5% · 30yr
- Down + closing
- —
- Monthly P&I
- —
- Monthly cashflow
- —
- DSCR
- —
- Eligible?
- —
Personal DTI + credit; lowest rate.
DSCR
20% down · 8.5% · 30yr
- Down + closing
- —
- Monthly P&I
- —
- Monthly cashflow
- —
- DSCR
- —
- Eligible?
- —
No personal income docs; deal must DSCR.
Hard money
10% down · 12.0% · 12mo
- Down + closing
- —
- Monthly P&I
- —
- Monthly cashflow
- —
- DSCR
- —
- Eligible?
- —
Short-term bridge; refi at stabilization.
Rent comps 6 comps
| Address | Beds | Baths | Sqft | Rent | $/sqft | DOM | Units | Dist |
|---|---|---|---|---|---|---|---|---|
| 7180 Dominica Dr Brownsville, TX | 4.0 | 4.0 | 2287 | $3,400 | $1.49 | 21d | 1 | 0.25mi |
| 7425 Lake Havasu Brownsville, TX | 3.0 | 2.0 | 1786 | $2,700 | $1.51 | 21d | 1 | 0.76mi |
| 7425 Lake Havasu Brownsville, TX | 3.0 | 2.0 | 1786 | $2,700 | $1.51 | 13d | 1 | 0.76mi |
| 7072 Lago Vista Blvd Brownsville, TX | 3.0 | 3.0 | 2473 | $3,200 | $1.29 | 21d | 1 | 0.79mi |
| 6919 Blue Spruce St Brownsville, TX | 3.0 | 2.0 | 1451 | $1,750 | $1.21 | 43d | 1 | 1.13mi |
| 6654 Pino Azul Brownsville, TX | 3.0 | 2.0 | 1433 | $1,900 | $1.33 | 43d | 1 | 1.24mi |
Listing history 12 events
-
2026-06-18days on market $325,000 Active 15 DOM
-
2026-06-17days on market $325,000 Active 14 DOM
-
2026-06-16days on market $325,000 Active 13 DOM
-
2026-06-15days on market $325,000 Active 12 DOM
-
2026-06-14days on market $325,000 Active 10 DOM
-
2026-06-13days on market $325,000 Active 9 DOM
-
2026-06-10days on market $325,000 Active 7 DOM
-
2026-06-09days on market $325,000 Active 6 DOM
-
2026-06-08days on market $325,000 Active 5 DOM
-
2026-06-07days on market $325,000 Active 4 DOM
-
2026-06-05remarks 673-char remark
-
2026-06-05$325,000 Active 1 DOM
ⓘ Source: listings_history table (triggers on properties + properties_extension) + one-shot
backfill from property_details.listing_events for pre-trigger history.
Climate risk First Street
- Flood 1/10 Low FEMA zone X (unshaded) · 0% chance over 30 yrs
- Wildfire 2/10 Low
- Heat 9/10 Extreme 7 d/yr ≥111°F today · 26 d/yr by 30 yrs out
- Wind 9/10 Extreme 99% chance of damaging wind over 30 yrs
- Air quality 2/10 Low 1 unhealthy d/yr today · 1 by 30 yrs out
Nearby sold comps map
Loading sold comps map…
Walkable amenities ~0.75 mi
Loading nearby amenities…
Taxation est. · year 1
- Rental income
- $31,509
- − Mortgage interest
- −$16,313
- − Property taxes
- −$4,368
- − Insurance
- −$1,456
- − Repairs & maintenance
- −$2,521
- − Management
- −$2,521
- − Depreciation
- −$8,472
- Taxable loss
- −$4,142
- Est. tax savings @ 24.0%
- +$994
- After-tax cash flow
- $1,735/yr
For passive investors: Depreciation is non-cash, so a rental often shows a tax loss while cash-flowing — sheltering income. Rental losses are passive: they offset passive income freely, and up to $25,000/yr can offset ordinary (W-2) income if you actively participate and your MAGI is under $100k (phasing out to $0 by $150k); unused losses carry forward. On sale, claimed depreciation is recaptured at up to 25%, and gains may owe capital-gains tax (a 1031 exchange can defer both). Figures are a year-1 estimate at your 24.0% rate — not tax advice; consult a CPA.
Condition & rehab AI · 8 photos
This home is under construction and will be finished by the middle of July. It is in excellent condition with new construction and no repairs needed. The highest-ROI updates would be to paint the interior and install flooring in the living areas.
Value-add opportunities
- Both Paint interior walls and trim — Freshly painted interior walls and trim will enhance the home's curb appeal and interior aesthetics, making it more attractive to potential buyers and renters.
- Both Install flooring in living areas — Replacing the concrete flooring with hardwood or tile flooring will improve the home's comfort and increase its value for both resale and rental.
Renovation cost estimate screening
Value-add ROI direction
- Both Paint interior walls and trim — Freshly painted interior walls and trim will enhance the home's curb appeal and interior aesthetics, making it more attractive to potential buyers and renters. ↑
- Both Install flooring in living areas — Replacing the concrete flooring with hardwood or tile flooring will improve the home's comfort and increase its value for both resale and rental. ↑
ⓘ Cost ranges are severity-bucket heuristics (US national rule-of-thumb). Get contractor quotes + a written scope before underwriting a rehab budget.
Schools (NCES district)
- District
- Los Fresnos CISD
- NCES district ID
- 4828290
- Math proficiency
- 34% ▼ -30.00%
- Reading proficiency
- 44% ▼ -10.00%
- Median HH income
- $42,586
- Composite
- 32.92/100
- National rank
- #5601
- State rank
- #444 of 826 in TX
Livability — Brownsville
- Score
- 79/100
- State rank
- #62
- US rank
- #2311
Category grades
Schools grade is shown separately in the Schools card above.
Census & demographics
- Census place
- Brownsville, TX
- County
- Cameron County · 310,734 people
- City population
- 212,132
- Metro
- Brownsville-Harlingen, TX
- Population (ZIP)
- 64,740
- Household income
- $50,116
- Rent vs Own
- Severe rent burden
- 1800.0
Population outlook (Cameron County) Hauer SSP2
- Today (2025)
- 441,603 people
- By 2030
- 448,113 · +1.5%
- By 2040
- 456,385 · +3.3%
- By 2050
- 456,294 · +3.3%
- By 2075
- 423,851 · -4.0%
- By 2100
- 342,787 · -22.4%
Race, ethnicity, and origin ACS 2023
- Neighborhood character
- Predominantly Hispanic (93%)
- Race & ethnicity
- Hispanic / Latino 93% Two or more races 44% White 6%
- Hispanic origin (detail)
- Mexican 88%
- Foreign-born
- 26% · Canada
- Languages at home
- 18% English-only · Spanish 82%
Political lean MEDSL · Cameron
- 2024 margin
- Lean R (+5.8) · D 46.7% · R 52.5%
- 2008→2024 swing
- -34.6pp toward R · 2008: 28.8pp · 2024: -5.8pp
- All cycles
- 2024: R+5.8 2020: D+13.2 2016: D+32.5 2012: D+32.4 2008: D+28.8
Not yet ingested
- Civics
- —
Market trends
- HPI YoY
- ▼ -52.91%
- Current HPI
- 214.4335
- Rent YoY
- ▲ 11.41%
- Metro
- Brownsville-Harlingen, TX
- State GDP YoY
- ▲ 3.95%
- F500 in state
- 110
Industry mix (Fortune 500 HQ in TX)
| Industry | F500 HQs | Revenue |
|---|---|---|
| Energy | 16 | $1,198B |
|
||
| Technology | 5 | $198B |
|
||
| Engineering / Construction | 4 | $72B |
|
||
| Energy Services | 3 | $60B |
|
||
| Utilities | 3 | $41B |
|
||
| Healthcare | 2 | $330B |
|
||
Price history
1 event — show timeline
- 2026-06-03 Listed $325,000 RGVMLS
Cash-flow waterfall
monthlySold comps — $/sqft
last 12 mo · ≤1 miLoading sold comps…