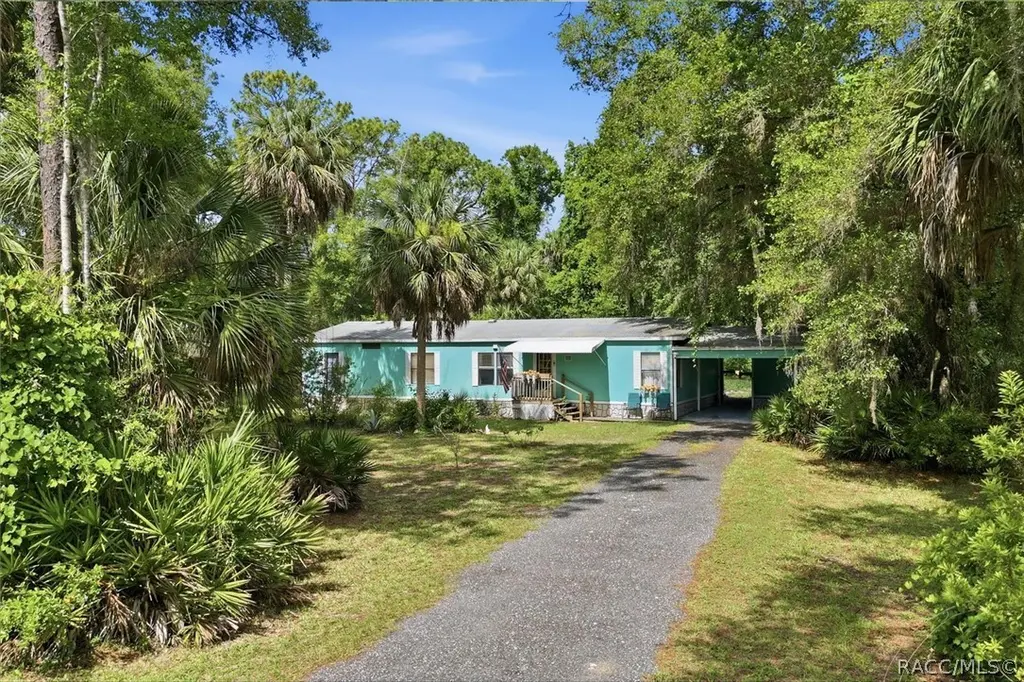
4390 N Williams Ave · Crystal River, FL
Flood risk 10/10 · Severe
- FEMA flood zone
- AE
- Chance of flooding over 30 yrs
- 0.99%
- Est. flood insurance / yr
- $1,737 – $8,500
Fire risk 5/10 · Moderate
- Est. fire insurance / yr
- $947 – $1,759
Heat risk 10/10 · Severe
- Hot days now (above 110°F)
- 7 days/yr
- Hot days in 30 yrs
- 25 days/yr
Wind risk 9/10 · Severe
- Chance of severe wind over 30 yrs
- 99.0%
Air-quality risk 1/10 · Minimal
- Unhealthy air days now
- 0 days/yr
- Unhealthy air days in 30 yrs
- 0 days/yr
Risk factors via First Street. Map © Google.
Why this score? — see what drove the C+ grade
The composite is a weighted blend of 9 inputs, each scored 0–100. Each bar is that input's sub-score; the figure is the points it added to the 100-point composite (weight × sub-score).
- Cash flow +29.2/30.0
- DSCR +10.0/10.0
- 1% rule +6.9/10.0
- ARV discount +5.6/15.0
- Schools +4.1/10.0
- Livability +3.3/5.0
- Rent growth +2.5/5.0
- Condition / age +2.5/5.0
- Appreciation +0.0/10.0
$182,900
🖨 Deal sheet (PDF) 📄 Offer letter ✓ Due diligence
Listing remarks MLS
Nice location for this 3 bedroom, 2 bath doublewide. Living in Crystal River, you will never run out of fun things to do. With several boat ramp's nearby, you can enjoy spending the day out on beautiful Kings Bay, fishing, kayaking, and swimming with the manatees. Or, if you'd rather shop the day away, downtown in Heritage Village is where you'll want to be, with many charming shops to browse through, and then stop in at one of the quaint eateries for a bite to eat. Close to everything, this home features a split floor plan, large living room with a wood-burning fireplace, master bedroom suite, screened porch, all on half an acre of land.
Key facts
- Quartz counters
- Half acre
- Gas oven range
Tags
Property features AI
Exterior
- Parking: Attached carport; Driveway; Paved parking; 1 parking space
- Security: Smoke detectors
- Utilities: Public water; Septic tank
- Home design: Manufactured home (double wide); Faces east
- Construction: Asphalt shingle roof; Crawl space foundation; Approximately 27 ft by 56 ft (double wide)
- Exterior features: Deck; French doors; Above-ground pool; Shed(s); Cleared, landscaped, level and wooded lot; Paved road frontage (county road)
Interior
- Kitchen: Gas oven; Gas range; Dishwasher; Refrigerator; Range hood
- Bathrooms: 2 full bathrooms
- Heating & cooling: Central electric heating; Central electric cooling
- Interior features: Eat-in kitchen; High ceilings; Vaulted ceilings; Walk-in closets; Blinds and window coverings; Gas fireplace
- Laundry & utility: Washer and dryer; Water heater
Neighborhood map
What this means for you Summary
Snapshot
- This is a 3-bed/2.0-bath manufactured listed at $183k.
Deal economics
- At list price, monthly cash flow is $210 ($3k/yr) — positive.
- The deal already cash-flows at list — no discount required.
- Meets the 1% rule at list price ($2k rent vs $183k).
- Cap rate 10.5% vs local median 2.1% in Crystal River — top-decile yield for the area; either an underpriced asset or a hidden risk that comps aren't pricing in. Stress-test before assuming the spread holds.
Location & tenants
- Location reads 66/100 on livability (#603 in FL) — a middle-class / working-renter tenant base. Strengths: crime A+, cost of living A+; Watch: health & safety C-, amenities F, commute F.
- Citrus (rural): math 49% / reading 50% proficiency, ranked #44 of 73 in FL (top 60%) — families likely to look elsewhere, expect single-tenant / working-renter base with shorter leases.
- Zoned schools: Crystal River Primary School (math 45% / reading 55%, grade D+, #1,070 of 2,144 statewide, top 51%, 654 students, 70% FRL); Crystal River Middle School (math 49% / reading 47%, grade C-, #286 of 571 statewide, top 50%, 900 students, 64% FRL); Crystal River High School (math 31% / reading 44%, grade F, #336 of 667 statewide, top 51%, 1,249 students, 56% FRL).
- Market conditions: 320 active listings in the ZIP; 6 comparable units currently listed for rent nearby; rentals at typical pace (median 22d on market — plan ~3-4 weeks tenant-placement turnaround); 2,443 units permitted in Citrus County in 2024 (0 in 5+ unit buildings).
- At $2,179/mo this rent would consume 51% of the median local household income ($51k/yr) (locally 264% of renters already pay >50% of income on rent) — very limited rent-growth headroom before tenants either downsize or default.
Forward outlook
- Local home prices are declining (-3.0%/yr); year-one equity from $1k of loan paydown is wiped out by about $5k of value loss. Plan a longer hold.
- Citrus County population projected to shrink 10% by 2050 — rents likely to lag national; underwrite the cash flow, not the appreciation.
Negotiation context
- Only 14 days on market — expect competitive offers; lowballing is unlikely to land.
- 3 sale attempts since 24y ago with the ask held roughly flat each time — persistent listings suggest the price (not the market) is what's stuck; bring a comps-based counter.
- Current owner paid $48k; list at $183k implies a 281% gain — meaningful room to come down on a strong offer.
Risks & watch-outs
- Watch-outs: flood insurance adds $427/mo.
- Climate carrying-cost: in FEMA flood zone AE (mandatory federal flood insurance); severe wind risk, 99% chance of damaging wind over 30y; moderate wildfire risk; extreme-heat days projected 7→25/yr by 2055 (HVAC capex compounding) — expect insurance premiums to compound above CPI over the hold.
Questions for the listing agent
- What's the actual annual flood-insurance premium (NFIP or private), and is the property in a SFHA with mandatory coverage?
- Is there a deadline driving the sale (1031 exchange, divorce, estate, relocation)? That informs how much negotiation room exists.
- Schools are D-rated, which usually means shorter tenancies and higher turnover. Who's the typical renter profile here, and what's been the actual vacancy rate?
- What's the average days-on-market for RENTAL listings here right now (not sales)? A rising rental-DOM trend means longer vacancies and softer asking-rent achievability than the comps imply.
- What's the recent tenant-quality profile in this submarket — average credit score on applications, eviction rate, late-payment / NSF rate, and stable-employment percentage? A property-management company in the area should have these aggregated.
- How much new for-sale + rental construction is in the pipeline within 1–3 miles? Heavy new supply typically softens prices + rents 12–24 months out; constrained supply supports both.
Investment metrics
- 1% rule
- 1.19% ✓
- Cap rate
- 10.47%
- Cash-on-cash
- 14.91%
- DSCR
- 1.66
- GRM
- 7.0
CMA / ARV
- ARV (on-the-fly)
- $175,392
- Comps found
- 1
Show comp detail 1 sale within ~0.75 mi
| Address | Dist | Beds/Ba | Sqft | Sold | Price | $/sf | Match |
|---|---|---|---|---|---|---|---|
| 4278 N Weewahi Pt | 0.14mi | 3/2.0 | 1,549 (+2%) | 10mo | $180,000 | $116 | 81 |
Match score weights: distance 35% · size 25% · config 20% · recency 20%. Top-matched comps best support the ARV.
Projected returns pro-forma
-3.0% appreciation · 3.0% rent growth · sell at horizon
- IRR
- -8.5%
- Equity multiple
- 0.69×
- Total profit
- $-16,085
- Equity at exit
- $27,271
- IRR
- 1.1%
- Equity multiple
- 1.08×
- Total profit
- $3,959
- Equity at exit
- $15,814
Cash invested: $51,212 (down + closing). Projections, not guarantees.
Landlord ↔ Tenant lean methodology
- Overall (STATE)
- 87 Strongly Landlord-Friendly
- State Florida
- 87 Strongly Landlord-Friendly · R+3
- County
- — inherits STATE
- City
- — inherits STATE
ZIP-level market 34428
- Home prices YoY
- -15.3%
- Active inventory
- 320
- Price-to-rent
- 7.0×
Monthly cashflow live
- Estimated rent
- $2,179 high interval (Pro) →
- Mortgage (P&I)
- −$959
- Tax from tax record
- −$50 /mo · $597/yr
- Insurance
- −$76
- Flood insurance flood zone
- −$427 /mo · $5,118/yr
- HOA
- −$0
- Vacancy / Maint / Mgmt
- −$458
- Net cashflow
- $210
Break-even live
Sensitivity live
| Price | -10% $313 | -5% $262 | +0% $210 | +5% $158 | +10% $106 |
|---|---|---|---|---|---|
| Rent | -10% $38 | -5% $124 | +0% $210 | +5% $296 | +10% $382 |
| Rate | -1.0pp $302 | -0.5pp $256 | base $210 | +0.5pp $162 | +1.0pp $114 |
UW: 25.0% down · 7.5% · 30yr · 1.5% tax · 5.0% vac · 8.0% maint · 8.0% mgmt
Financing live
Cash to close
- Down payment
- $45,725
- Closing costs
- $5,487
- Reserves months
- —
- Total cash needed
- —
Loan-product check · same deal, 3 products live
Conventional
25% down · 7.5% · 30yr
- Down + closing
- —
- Monthly P&I
- —
- Monthly cashflow
- —
- DSCR
- —
- Eligible?
- —
Personal DTI + credit; lowest rate.
DSCR
20% down · 8.5% · 30yr
- Down + closing
- —
- Monthly P&I
- —
- Monthly cashflow
- —
- DSCR
- —
- Eligible?
- —
No personal income docs; deal must DSCR.
Hard money
10% down · 12.0% · 12mo
- Down + closing
- —
- Monthly P&I
- —
- Monthly cashflow
- —
- DSCR
- —
- Eligible?
- —
Short-term bridge; refi at stabilization.
Rent comps 6 comps
| Address | Beds | Baths | Sqft | Rent | $/sqft | DOM | Units | Dist |
|---|---|---|---|---|---|---|---|---|
| 10785 W Spring Cir Crystal River, FL | 3.0 | 2.0 | 1344 | $1,600 | $1.19 | 21d | 1 | 0.54mi |
| 10906 W Cove Harbor Dr Crystal River, FL | 2.0 | 2.0 | 1409 | $2,950 | $2.09 | 21d | 1 | 0.67mi |
| 1950 NW 12th Ave Unit B Crystal River, FL | 2.0 | 2.0 | 1100 | $1,300 | $1.18 | 21d | 1 | 0.74mi |
| 1701 NW 22nd St Crystal River, FL | 3.0 | 2.0 | 1537 | $2,100 | $1.37 | 21d | 1 | 0.75mi |
| 11057 W Harbor Watch Loop Crystal River, FL | 2.0 | 1.5 | 1074 | $1,495 | $1.39 | 21d | 1 | 0.78mi |
| 11055 W Harbor Watch Loop Crystal River, FL | 2.0 | 1.5 | 1074 | $1,550 | $1.44 | 21d | 1 | 0.78mi |
Listing history 12 events
-
2026-06-19days on market $182,900 Active 14 DOM
-
2026-06-18days on market $182,900 Active 13 DOM
-
2026-06-17days on market $182,900 Active 12 DOM
-
2026-06-16days on market $182,900 Active 11 DOM
-
2026-06-15days on market $182,900 Active 10 DOM
-
2026-06-14days on market $182,900 Active 8 DOM
-
2026-06-13days on market $182,900 Active 7 DOM
-
2026-06-10days on market $182,900 Active 5 DOM
-
2026-06-09days on market $182,900 Active 4 DOM
-
2026-06-08days on market $182,900 Active 3 DOM
-
2026-06-07remarks 693-char remark
-
2026-06-07$182,900 Active 2 DOM
ⓘ Source: listings_history table (triggers on properties + properties_extension) + one-shot
backfill from property_details.listing_events for pre-trigger history.
Tax reassessment forecast FL · Resets to sale price
- Current annual tax
- $597 · $50/mo
- Projected year-2 tax
- $1,518 · $127/mo
- Expected delta
- +$921/yr (+$77/mo · 154.1%)
ⓘ Screening estimate from a state-policy table — verify with the county assessor before closing.
Climate risk First Street
- Flood 10/10 Extreme FEMA zone AE · 99% chance over 30 yrs
- Wildfire 5/10 Major
- Heat 10/10 Extreme 7 d/yr ≥110°F today · 25 d/yr by 30 yrs out
- Wind 9/10 Extreme 99% chance of damaging wind over 30 yrs
- Air quality 1/10 Low 0 unhealthy d/yr today · 0 by 30 yrs out
Nearby sold comps map
Loading sold comps map…
Walkable amenities ~0.75 mi
Loading nearby amenities…
Taxation est. · year 1
- Rental income
- $26,150
- − Mortgage interest
- −$10,245
- − Property taxes
- −$597
- − Insurance
- −$6,033
- − Repairs & maintenance
- −$2,092
- − Management
- −$2,092
- − Depreciation
- −$5,321
- Taxable loss
- −$230
- Est. tax savings @ 24.0%
- +$55
- After-tax cash flow
- $2,574/yr
For passive investors: Depreciation is non-cash, so a rental often shows a tax loss while cash-flowing — sheltering income. Rental losses are passive: they offset passive income freely, and up to $25,000/yr can offset ordinary (W-2) income if you actively participate and your MAGI is under $100k (phasing out to $0 by $150k); unused losses carry forward. On sale, claimed depreciation is recaptured at up to 25%, and gains may owe capital-gains tax (a 1031 exchange can defer both). Figures are a year-1 estimate at your 24.0% rate — not tax advice; consult a CPA.
Schools (NCES district)
- District
- Citrus
- NCES district ID
- 1200270
- Math proficiency
- 49% ▼ -10.00%
- Reading proficiency
- 50% ▼ -6.00%
- Median HH income
- $38,618
- Composite
- 41.28/100
- National rank
- #3519
- State rank
- #44 of 73 in FL
Livability — Crystal River
- Score
- 66/100
- State rank
- #603
- US rank
- #11564
Category grades
Schools grade is shown separately in the Schools card above.
Census & demographics
- County
- Citrus County · 111,314 people
- City population
- 10,163
- Metro
- Homosassa Springs, FL
- Population (ZIP)
- 10,163
- Household income
- $50,779
- Rent vs Own
- Severe rent burden
- 264.0
Population outlook (Citrus County) Hauer SSP2
- Today (2025)
- 138,622 people
- By 2030
- 136,886 · -1.3%
- By 2040
- 132,009 · -4.8%
- By 2050
- 125,196 · -9.7%
- By 2075
- 108,570 · -21.7%
- By 2100
- 84,454 · -39.1%
Race, ethnicity, and origin ACS 2023
- Neighborhood character
- Predominantly White (88%)
- Race & ethnicity
- White 88% Two or more races 6% Hispanic / Latino 5% Asian 2%
- Common ancestry
- Lithuanian 3% Romanian 3% Slovak 2%
- Foreign-born
- 5% · Canada, Jamaica, South Korea
- Languages at home
- 96% English-only · Spanish 3%
Political lean MEDSL · Citrus
- 2024 margin
- Solid R (+45.9) · D 26.8% · R 72.6%
- 2008→2024 swing
- -29.8pp toward R · 2008: -16.1pp · 2024: -45.9pp
- All cycles
- 2024: R+45.9 2020: R+41.0 2016: R+39.7 2012: R+21.9 2008: R+16.1
Not yet ingested
- Civics
- —
Market trends
- HPI YoY
- ▼ -57.32%
- Current HPI
- 317.7637
- Rent YoY
- —
- Metro
- Homosassa Springs, FL
- State GDP YoY
- ▲ 3.28%
- F500 in state
- 36
Industry mix (Fortune 500 HQ in FL)
| Industry | F500 HQs | Revenue |
|---|---|---|
| Industrial Technology | 2 | $29B |
|
||
| Insurance | 2 | $17B |
|
||
| Retail | 1 | $60B |
|
||
| Technology Distribution | 1 | $58B |
|
||
| Homebuilding | 1 | $35B |
|
||
| Technology Manufacturing | 1 | $35B |
|
||
Price history
+293.3% since first listed6 events — show timeline
- 2026-06-05 Listed $182,900 RACC
- 2017-08-09 Sold (Public Records) $48,000 Public Records
- 2017-07-07 Sold (MLS) $48,000 RACC
- 2017-06-26 Listed $50,000 RACC
- 2002-08-16 Sold (MLS) $44,000 RACC
- 2002-07-30 Listed $46,500 RACC
Property tax history
-1.3%/yrLatest (2025): $597 · +10.4% YoY. Source: county tax records.
Cash-flow waterfall
monthlySold comps — $/sqft
last 12 mo · ≤1 miLoading sold comps…