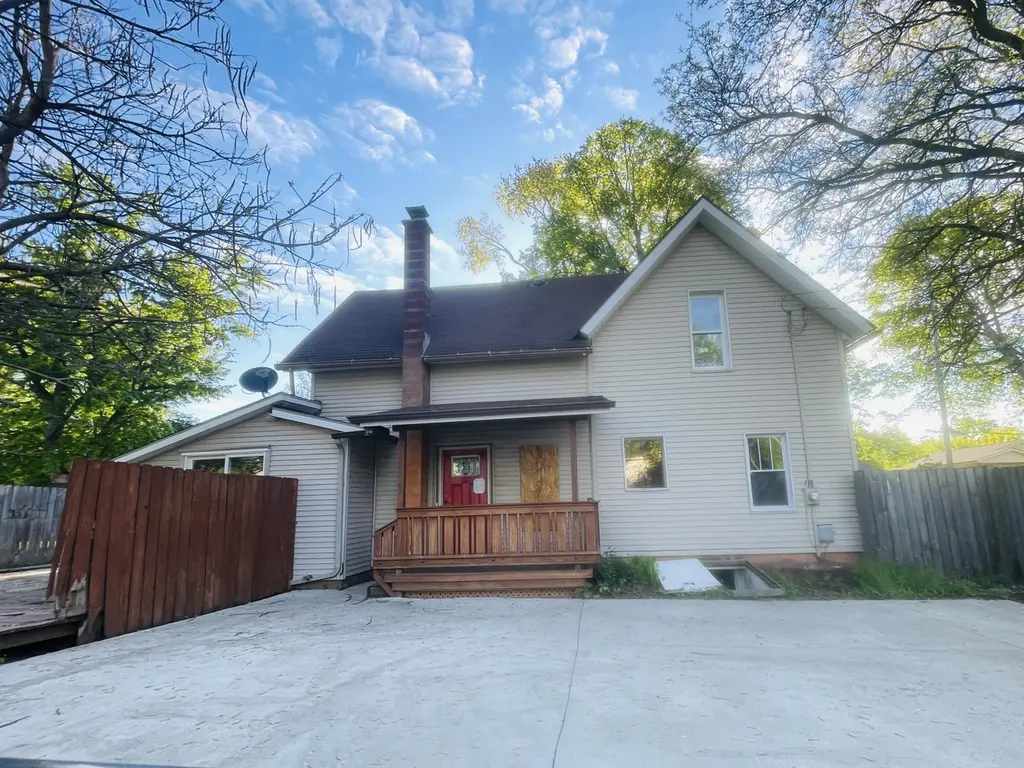
412 Quarry St · Jackson, MI
Flood risk 1/10 · Minimal
- FEMA flood zone
- X (unshaded)
- Chance of flooding over 30 yrs
- 0.0%
- Est. flood insurance / yr
- $473 – $860
Fire risk 1/10 · Minimal
- Est. fire insurance / yr
- $784 – $1,456
Heat risk 3/10 · Minor
- Hot days now (above 98°F)
- 7 days/yr
- Hot days in 30 yrs
- 15 days/yr
Wind risk 2/10 · Minimal
- Chance of severe wind over 30 yrs
- —
Air-quality risk 2/10 · Minimal
- Unhealthy air days now
- 1 days/yr
- Unhealthy air days in 30 yrs
- 1 days/yr
Risk factors via First Street. Map © Google.
Why this score? — see what drove the B+ grade
The composite is a weighted blend of 9 inputs, each scored 0–100. Each bar is that input's sub-score; the figure is the points it added to the 100-point composite (weight × sub-score).
- Cash flow +30.0/30.0
- ARV discount +15.0/15.0
- 1% rule +10.0/10.0
- DSCR +10.0/10.0
- Rent growth +5.0/5.0
- Livability +3.7/5.0
- Condition / age +2.2/5.0
- Schools +1.8/10.0
- Appreciation +0.0/10.0
$67,900
🖨 Deal sheet 📄 Offer letter ✓ Due diligence
Listing remarks MLS
All offers must be submitted by the Buyer's agent via the RES. NET Agent Portal. If your offer is accepted, you agree to be responsible for an offer submission technology fee of $225.00. The fee will be collected and disbursed by the settlement agent and disbursed at the closing & settlement of the trans. To submit your buyer's offer, click the link below. If you already have a RES. NET Agent account log in. If not create an account. To begin, click or paste this link into your web browser: https://agent. res.net/Offers. aspx?-1804713
Key facts
- 8,712 sq ft lot
- Built 1920
- Listed 15 days
Property features AI
Exterior
- Utilities: Natural gas connected
- Home design: Traditional single-family residence; Built in 1920
- Construction: Vinyl siding
- Exterior features: Corner lot; Paved road access; Public water
Interior
- Kitchen: Kitchen (13 x 14); Eat-in layout
- Bedrooms: Primary bedroom (11 x 18); Bedroom 2 (9 x 13); Bedroom 3 (9 x 13); Loft (13 x 18)
- Bathrooms: 2 full bathrooms; Primary bathroom (7 x 13); Bathroom 2 (6 x 10)
- Heating & cooling: Forced air heating
- Interior features: Eat-in kitchen; 8 total rooms; Full basement
- Laundry & utility: Natural gas water heater
Neighborhood map
What this means for you Summary
Snapshot
- This is a 3-bed/2.0-bath single-family listed at $68k. Condition is rated fair.
Deal economics
- At list price, monthly cash flow is $507 ($6k/yr) — positive.
- The deal already cash-flows at list — no discount required.
- Meets the 1% rule at list price ($1k rent vs $68k).
- Recommended offer: $67k (1.5% below list) — sets the bar for market timing.
- Cap rate 15.3% vs local median 5.4% in Jackson — top-decile yield for the area; either an underpriced asset or a hidden risk that comps aren't pricing in. Stress-test before assuming the spread holds.
Location & tenants
- Location reads 74/100 on livability (#197 in MI, #4,970 nationally) — a middle-class / working-renter tenant base. Strengths: cost of living A+, housing A+, health & safety A+; Watch: schools D, crime F, employment F.
- Jackson Public Schools (urban): math 15% / reading 28% proficiency, ranked #458 of 540 in MI (top 85%) — low school quality limits family demand, transient renter base, plan for 1-2y turnover; 63% free/reduced lunch — lower-income household profile, screen leases tightly.
- Market conditions: Rents rising fast (+10.3%/yr); 362 active listings in the ZIP; 4 comparable units currently listed for rent nearby; rentals lingering (median 44d on market — plan ~5-8 weeks vacancy on turnover, expect pricing pressure); 100% of comp listings sitting > 30 days — soft ceiling on asking rent; 317 units permitted in Jackson County in 2024 (103 in 5+ unit buildings).
Forward outlook
- Local home prices are declining (-3.0%/yr); year-one equity from $469 of loan paydown is wiped out by about $2k of value loss. Plan a longer hold.
- Jackson County population projected at -13% by 2050 — secular population decline; favor cash flow + early exit over multi-decade hold.
- At projected returns (-3.0% appreciation + 8.0% rent growth), your $19k cash investment doubles in ~4 years — after that, you're playing with house money.
Negotiation context
- It's been on market 15 days — a 2% lower offer ($67k) is reasonable based on typical stale-listing flexibility.
- 6 sale attempts since 2y ago with the ask held roughly flat each time — persistent listings suggest the price (not the market) is what's stuck; bring a comps-based counter.
Risks & watch-outs
- Watch-outs: built in 1920 — expect roof / HVAC / electrical / plumbing capex.
Questions for the listing agent
- Have any recent inspections been done? Can we get a copy of the seller's disclosures and any deferred-maintenance estimates?
- Built in 1920 — when were the roof, HVAC, electrical panel, plumbing, and water heater last replaced?
- Is there a deadline driving the sale (1031 exchange, divorce, estate, relocation)? That informs how much negotiation room exists.
- Schools are D-rated, which usually means shorter tenancies and higher turnover. Who's the typical renter profile here, and what's been the actual vacancy rate?
- Crime grade is F in this area — have there been break-ins, vandalism, or insurance claims at this property in the last 3 years? What carrier currently insures it and at what premium?
- What's the average days-on-market for RENTAL listings here right now (not sales)? A rising rental-DOM trend means longer vacancies and softer asking-rent achievability than the comps imply.
- What's the recent tenant-quality profile in this submarket — average credit score on applications, eviction rate, late-payment / NSF rate, and stable-employment percentage? A property-management company in the area should have these aggregated.
- How much new for-sale + rental construction is in the pipeline within 1–3 miles? Heavy new supply typically softens prices + rents 12–24 months out; constrained supply supports both.
Investment metrics
- 1% rule
- 1.82% ✓
- Cap rate
- 15.25%
- Cash-on-cash
- 32.00%
- DSCR
- 2.42
- GRM
- 4.6
CMA / ARV
- ARV (on-the-fly)
- $122,670
- Comps found
- 12
Show comp detail 12 sales within ~0.75 mi
| Address | Dist | Beds/Ba | Sqft | Sold | Price | $/sf | Match |
|---|---|---|---|---|---|---|---|
| 656 Cooper St | 0.08mi | 3/2.0 | 1,224 (-6%) | 5mo | $195,000 | $159 | 81 |
| 510 Harris St | 0.15mi | 3/1.0 | 1,455 (+12%) | 1mo | $25,000 | $17 | 69 |
| 827 Wells St | 0.15mi | 3/1.0 | 1,435 (+10%) | 5mo | $110,500 | $77 | 68 |
| 309 N Park Ave | 0.23mi | 2/1.5 (-1) | 1,200 (-8%) | 4mo | $113,000 | $94 | 65 |
| 839 N East Ave | 0.63mi | 4/2.0 (+1) | 1,304 (-0%) | 1mo | $206,000 | $158 | 65 |
| 1025 Hamilton St | 0.48mi | 2/1.0 (-1) | 1,283 (-2%) | 3mo | $59,500 | $46 | 64 |
| 513 N Waterloo St | 0.32mi | 3/1.0 | 1,184 (-9%) | 5mo | $55,000 | $46 | 62 |
| 1135 Hamilton St | 0.69mi | 3/1.0 | 1,291 (-1%) | 3mo | $97,000 | $75 | 59 |
| 927 N George St | 0.65mi | 3/1.0 | 1,351 (+4%) | 4mo | $100,000 | $74 | 56 |
| 319 W North St | 0.68mi | 3/1.0 | 1,252 (-4%) | 3mo | $145,000 | $116 | 55 |
| 1308 Leroy St | 0.70mi | 4/1.0 (+1) | 1,450 (+11%) | 2mo | $185,000 | $128 | 38 |
| 1104 N Waterloo Ave | 0.74mi | 4/2.0 (+1) | 1,490 (+14%) | 1mo | $189,900 | $127 | 36 |
Match score weights: distance 35% · size 25% · config 20% · recency 20%. Top-matched comps best support the ARV.
Projected returns pro-forma
-3.0% appreciation · 8.0% rent growth · sell at horizon
- IRR
- 32.6%
- Equity multiple
- 2.46×
- Total profit
- $27,835
- Equity at exit
- $10,124
- IRR
- 42.2%
- Equity multiple
- 6.03×
- Total profit
- $95,613
- Equity at exit
- $5,871
Cash invested: $19,012 (down + closing). Projections, not guarantees.
Landlord ↔ Tenant lean methodology
- Overall (STATE)
- 62 Landlord-Friendly
- State Michigan
- 62 Landlord-Friendly · EVEN
- County
- — inherits STATE
- City
- — inherits STATE
ZIP-level market 49201
- Rents YoY
- 10.3%
- Active inventory
- 362
- Price-to-rent
- 4.6×
Monthly cashflow live
- Estimated rent
- $1,236 medium interval (Pro) →
- Mortgage (P&I)
- −$356
- Tax est. 1.5%
- −$85 /mo · $1,018/yr
- Insurance
- −$28
- HOA
- −$0
- Vacancy / Maint / Mgmt
- −$259
- Net cashflow
- $507
Break-even live
UW: 25.0% down · 7.5% · 30yr · 1.5% tax · 5.0% vac · 8.0% maint · 8.0% mgmt
Financing live
Cash to close
- Down payment
- $16,975
- Closing costs
- $2,037
- Reserves months
- —
- Total cash needed
- —
Loan-product check · same deal, 3 products live
Conventional
25% down · 7.5% · 30yr
- Down + closing
- —
- Monthly P&I
- —
- Monthly cashflow
- —
- DSCR
- —
- Eligible?
- —
Personal DTI + credit; lowest rate.
DSCR
20% down · 8.5% · 30yr
- Down + closing
- —
- Monthly P&I
- —
- Monthly cashflow
- —
- DSCR
- —
- Eligible?
- —
No personal income docs; deal must DSCR.
Hard money
10% down · 12.0% · 12mo
- Down + closing
- —
- Monthly P&I
- —
- Monthly cashflow
- —
- DSCR
- —
- Eligible?
- —
Short-term bridge; refi at stabilization.
Rent comps 4 comps
| Address | Beds | Baths | Sqft | Rent | $/sqft | DOM | Units | Dist |
|---|---|---|---|---|---|---|---|---|
| 408 N Perrine St Jackson, MI | 3.0 | 1.0 | 990 | $1,350 | $1.36 | 44d | 1 | 0.22mi |
| 159 W Pearl St Unit 202 Jackson, MI | 2.0 | 1.0 | 1000 | $1,350 | $1.35 | 44d | 1 | 0.51mi |
| 653 Oakhill Ave Jackson, MI | 2.0 | 1.0 | 900 | $950 | $1.06 | 44d | 1 | 0.98mi |
| 720 W Michigan Ave Jackson, MI | 2.0 | 1.0 | 972 | $900 | $0.93 | 44d | 1 | 1.02mi |
Listing history 17 events
-
2026-06-03status $67,900 Pending 15 DOM
-
2026-06-02days on market $67,900 Active 15 DOM
-
2026-06-01days on market $67,900 Active 14 DOM
-
2026-05-31days on market $67,900 Active 13 DOM
-
2026-05-30days on market $67,900 Active 12 DOM
-
2026-05-18$67,900 Active 545-char remark
Show marketing remark (545 chars)
All offers must be submitted by the Buyer's agent via the RES. NET Agent Portal. If your offer is accepted, you agree to be responsible for an offer submission technology fee of $225.00. The fee will be collected and disbursed by the settlement agent and disbursed at the closing & settlement of the trans. To submit your buyer's offer, click the link below. If you already have a RES. NET Agent account log in. If not create an account. To begin, click or paste this link into your web browser: https://agent. res.net/Offers. aspx?-1804713
-
2026-05-18$67,900 Active
Show marketing remark (545 chars)
All offers must be submitted by the Buyer's agent via the RES. NET Agent Portal. If your offer is accepted, you agree to be responsible for an offer submission technology fee of $225.00. The fee will be collected and disbursed by the settlement agent and disbursed at the closing & settlement of the trans. To submit your buyer's offer, click the link below. If you already have a RES. NET Agent account log in. If not create an account. To begin, click or paste this link into your web browser: https://agent. res.net/Offers. aspx?-1804713
-
2026-05-18$67,900 Active 545-char remark
Show marketing remark (545 chars)
All offers must be submitted by the Buyer's agent via the RES. NET Agent Portal. If your offer is accepted, you agree to be responsible for an offer submission technology fee of $225.00. The fee will be collected and disbursed by the settlement agent and disbursed at the closing & settlement of the trans. To submit your buyer's offer, click the link below. If you already have a RES. NET Agent account log in. If not create an account. To begin, click or paste this link into your web browser: https://agent. res.net/Offers. aspx?-1804713
-
2024-04-19soldstatus $135,000 Sold
-
2024-04-19soldstatus $135,000 Closed
-
2024-04-19soldstatus $135,000 Sold
-
2024-03-19historical Contingent - Continue To Show
-
2024-03-19historical Keep Showing-Contgcy Appl
-
2024-03-19historical Active - Contingent
-
2024-03-12$129,000 Active
-
2024-03-12$129,000 Active
-
2024-03-12$129,000 Active
ⓘ Source: listings_history table (triggers on properties + properties_extension) + one-shot
backfill from property_details.listing_events for pre-trigger history.
Climate risk First Street
- Flood 1/10 Low FEMA zone X (unshaded) · 0% chance over 30 yrs
- Wildfire 1/10 Low
- Heat 3/10 Moderate 7 d/yr ≥98°F today · 15 d/yr by 30 yrs out
- Wind 2/10 Low
- Air quality 2/10 Low 1 unhealthy d/yr today · 1 by 30 yrs out
Nearby sold comps map
Loading sold comps map…
Walkable amenities ~0.75 mi
Loading nearby amenities…
Taxation est. · year 1
- Rental income
- $14,828
- − Mortgage interest
- −$3,803
- − Property taxes
- −$1,018
- − Insurance
- −$340
- − Repairs & maintenance
- −$1,186
- − Management
- −$1,186
- − Depreciation
- −$1,975
- Taxable income
- $5,319
- Est. tax owed @ 24.0%
- −$1,277
- After-tax cash flow
- $4,807/yr
For passive investors: Depreciation is non-cash, so a rental often shows a tax loss while cash-flowing — sheltering income. Rental losses are passive: they offset passive income freely, and up to $25,000/yr can offset ordinary (W-2) income if you actively participate and your MAGI is under $100k (phasing out to $0 by $150k); unused losses carry forward. On sale, claimed depreciation is recaptured at up to 25%, and gains may owe capital-gains tax (a 1031 exchange can defer both). Figures are a year-1 estimate at your 24.0% rate — not tax advice; consult a CPA.
Condition & rehab AI · 12 photos
This home requires significant repairs and updates, including major work on the roof and siding, to improve its condition and value.
Repairs flagged
- Major siding — Significant damage
- Major roof — Signs of wear
- Major paint — Peeling
- Major bathroom fixtures — Needs updating
- Major kitchen cabinets — Needs updating
Value-add opportunities
- Both painting — Enhances curb appeal and interior
- Both landscaping — Improves curb appeal and value
- Both roof repair — Critical for structural integrity and value
- Both siding repair — Improves curb appeal and value
- Both bathroom updates — Enhances functionality and value
- Both kitchen updates — Enhances functionality and value
Renovation cost estimate screening
| Repair item | Severity | Est. cost |
|---|---|---|
| siding · Significant damage | Major | $15,000–50,000 |
| roof · Signs of wear | Major | $15,000–50,000 |
| paint · Peeling | Major | $15,000–50,000 |
| bathroom fixtures · Needs updating | Major | $15,000–50,000 |
| kitchen cabinets · Needs updating | Major | $15,000–50,000 |
| Total estimated repair cost · 5 items | $75,000–250,000 |
Value-add ROI direction
- Both painting — Enhances curb appeal and interior ↑
- Both landscaping — Improves curb appeal and value ↑
- Both roof repair — Critical for structural integrity and value ↑
- Both siding repair — Improves curb appeal and value ↑
- Both bathroom updates — Enhances functionality and value ↑
- Both kitchen updates — Enhances functionality and value ↑
ⓘ Cost ranges are severity-bucket heuristics (US national rule-of-thumb). Get contractor quotes + a written scope before underwriting a rehab budget.
Schools (NCES district)
- District
- Jackson Public Schools
- NCES district ID
- 2619620
- Math proficiency
- 15% ▼ -6.00%
- Reading proficiency
- 28% ▼ -3.00%
- Median HH income
- $38,344
- Composite
- 17.99/100
- National rank
- #8986
- State rank
- #458 of 540 in MI
Livability — Jackson
- Score
- 74/100
- State rank
- #197
- US rank
- #4970
Category grades
Schools grade is shown separately in the Schools card above.
Census & demographics
- Census place
- Jackson, MI
- County
- Jackson County · 85,581 people
- City population
- 85,581
- Metro
- Jackson, MI
- Population (ZIP)
- 49,107
- Household income
- $74,484
- Rent vs Own
- Severe rent burden
- 840.0
Population outlook (Jackson County) Hauer SSP2
- Today (2025)
- 156,365 people
- By 2030
- 153,123 · -2.1%
- By 2040
- 144,981 · -7.3%
- By 2050
- 135,671 · -13.2%
- By 2075
- 113,833 · -27.2%
- By 2100
- 86,592 · -44.6%
Race, ethnicity, and origin ACS 2023
- Neighborhood character
- Predominantly White (80%)
- Race & ethnicity
- White 80% Black 9% Two or more races 6% Hispanic / Latino 5%
- Hispanic origin (detail)
- Mexican 4%
- Common ancestry
- Romanian 7% Lithuanian 3% Slovak 2%
- Foreign-born
- 3% · Canada
- Languages at home
- 96% English-only · Spanish 2% Other Indo-European 1% Russian/Polish/Slavic 1%
Political lean MEDSL · Jackson
- 2024 margin
- Strong R (+21.3) · D 38.6% · R 59.9% · Other 1.5%
- 2008→2024 swing
- -23.7pp toward R · 2008: 2.4pp · 2024: -21.3pp
- All cycles
- 2024: R+21.3 2020: R+19.0 2016: R+20.1 2012: R+5.8 2008: D+2.4
Not yet ingested
- Civics
- —
Market trends
- HPI YoY
- ▼ -198.89%
- Current HPI
- 185.3773
- Rent YoY
- ▲ 10.32%
- Metro
- Jackson, MI
- State GDP YoY
- ▲ 1.37%
- F500 in state
- 28
Industry mix (Fortune 500 HQ in MI)
| Industry | F500 HQs | Revenue |
|---|---|---|
| Automotive Parts | 3 | $48B |
|
||
| Automotive | 2 | $372B |
|
||
| Chemicals | 1 | $45B |
|
||
| Automotive Retail | 1 | $29B |
|
||
| Healthcare / Medical Devices | 1 | $23B |
|
||
| Automotive Technology | 1 | $20B |
|
||
Price history
-47.4% since first listed12 events — show timeline
- 2026-05-18 Listed $67,900 REALCOMP
- 2026-05-18 Listed $67,900 MiRealSource-MiMLS
- 2026-05-18 Listed $67,900 SW Michigan MLS
- 2024-04-19 Sold (MLS) $135,000 SW Michigan MLS
- 2024-04-19 Sold (MLS) $135,000 MiRealSource-MiMLS
- 2024-04-19 Sold (MLS) $135,000 REALCOMP
- 2024-03-19 Contingent — REALCOMP
- 2024-03-19 Contingent — MiRealSource-MiMLS
- 2024-03-19 Contingent — SW Michigan MLS
- 2024-03-12 Listed $129,000 SW Michigan MLS
- 2024-03-12 Listed $129,000 MiRealSource-MiMLS
- 2024-03-12 Listed $129,000 REALCOMP
Cash-flow waterfall
monthlySold comps — $/sqft
last 12 mo · ≤1 miLoading sold comps…