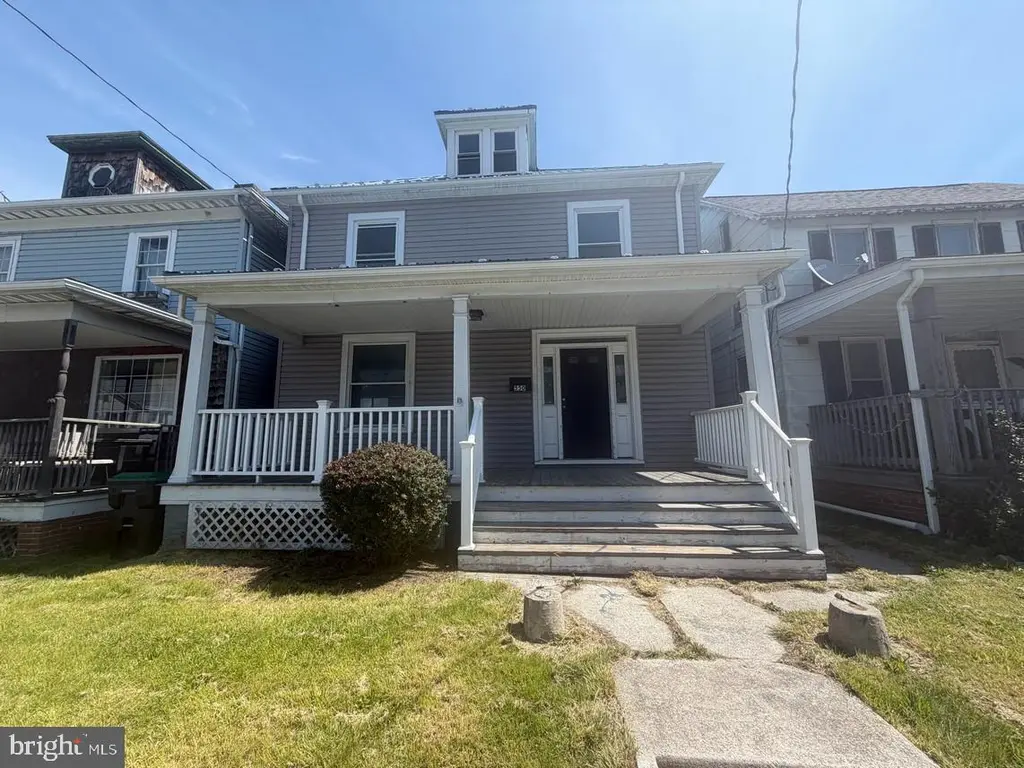
550 Baltimore St · Penn, PA
Flood risk 1/10 · Minimal
- FEMA flood zone
- X (unshaded)
- Chance of flooding over 30 yrs
- 0.0%
- Est. flood insurance / yr
- $473 – $860
Fire risk 1/10 · Minimal
- Est. fire insurance / yr
- $511 – $949
Heat risk 6/10 · Moderate
- Hot days now (above 102°F)
- 7 days/yr
- Hot days in 30 yrs
- 15 days/yr
Wind risk 4/10 · Minor
- Chance of severe wind over 30 yrs
- 9.0%
Air-quality risk 2/10 · Minimal
- Unhealthy air days now
- 1 days/yr
- Unhealthy air days in 30 yrs
- 3 days/yr
Risk factors via First Street. Map © Google.
Why this score? — see what drove the B grade
The composite is a weighted blend of 9 inputs, each scored 0–100. Each bar is that input's sub-score; the figure is the points it added to the 100-point composite (weight × sub-score).
- Cash flow +26.0/30.0
- ARV discount +15.0/15.0
- DSCR +8.7/10.0
- 1% rule +7.7/10.0
- Schools +4.2/10.0
- Rent growth +3.7/5.0
- Livability +2.8/5.0
- Condition / age +2.5/5.0
- Appreciation +0.0/10.0
$164,000
🖨 Deal sheet 📄 Offer letter ✓ Due diligence
Listing remarks MLS
Newly renovated 4 Bedrooms and 2 Bath Colonial in Southwestern Schools. With all new paint, flooring, exterior siding, landscaping, and an updated HVAC this will not last long!! Schedule a showing today!
Key facts
- Open floor plan
- Updated cabinets
- Large front porch
Tags
Property features AI
Finance
- Other: Fee simple ownership; Not in a federal flood zone; Ground rent paid annually
Exterior
- Parking: Two off-street parking spaces; Concrete driveway
- Utilities: Public water; Public sewer; Electric service with circuit breakers; Natural gas for heating and hot water
- Home design: Detached property; Vinyl siding exterior; Metal roof; Stone foundation; Building is winterized
- Construction: Vinyl siding construction; Metal roof; Stone foundation; Detached structure
- Exterior features: Front and rear yard; Level lot; Porches and enclosed balcony; Exterior lighting; Sidewalks; Wood fencing
Interior
- Kitchen: Built-in microwave; Dishwasher; Gas range/oven
- Bedrooms: Four bedrooms on the upper level
- Flooring: Hardwood; Carpet; Vinyl
- Bathrooms: Two full bathrooms (one on main level, one on first upper level)
- Heating & cooling: Forced air heating (natural gas); Central air conditioning
- Interior features: Open floor plan with formal dining area and separate dining space; Eat-in kitchen; Attic; Tub/shower; Drywall and plaster walls; Wood and carpet finishes
- Laundry & utility: Laundry in the basement
Neighborhood map
What this means for you Summary
Snapshot
- This is a 5-bed/2.0-bath single-family listed at $164k.
Deal economics
- At list price, monthly cash flow is $408 ($5k/yr) — positive.
- The deal already cash-flows at list — no discount required.
- Meets the 1% rule at list price ($2k rent vs $164k).
- Recommended offer: $159k (3.0% below list) — sets the bar for market timing.
Location & tenants
- Location reads 56/100 on livability (#1,637 in PA) — a working-class tenant base; expect higher turnover. Strengths: cost of living A+, housing A+; Watch: crime D+, amenities F, commute F.
- South Western SD (suburban): math 37% / reading 56% proficiency, ranked #206 of 539 in PA (top 38%) — families likely to look elsewhere, expect single-tenant / working-renter base with shorter leases.
- Zoned schools: Emory H Markle Ms (math 27% / reading 53%, grade F, #257 of 512 statewide, top 52%, 1,028 students, 34% FRL); South Western Shs (math 83% / reading 75%, grade A-, #20 of 437 statewide, top 4%, 1,299 students, 31% FRL).
- Zoned-school proficiency averages 60% at this address vs 46% district-wide (+13 pts) — the actual schools serving this property are materially stronger than the South Western SD average implies; a family-tenant draw the district grade alone would hide.
- Market conditions: Rents rising fast (+4.7%/yr); 386 active listings in the ZIP; 2 comparable units currently listed for rent nearby; solid renter incomes; 1,328 units permitted in York County in 2024 (338 in 5+ unit buildings).
- This rent runs 31% of the median local income ($79k/yr) — at the standard rent-burdened threshold; future hikes will face affordability resistance.
Forward outlook
- Local home prices are declining (-3.0%/yr); year-one equity from $1k of loan paydown is wiped out by about $5k of value loss. Plan a longer hold.
- At projected returns (-3.0% appreciation + 4.7% rent growth), your $46k cash investment doubles in ~9 years — after that, you're playing with house money.
Negotiation context
- It's been on market 46 days — a 3% lower offer ($159k) is reasonable based on typical stale-listing flexibility.
- 5 sale attempts since 7y ago; this cycle's ask has dropped $10k (6%) from the opening price — seller is motivated, your offer sets the floor, not the list.
Risks & watch-outs
- Watch-outs: built in 1900 — expect roof / HVAC / electrical / plumbing capex.
- Climate carrying-cost: extreme-heat days projected 7→15/yr by 2055 (HVAC capex compounding) — expect insurance premiums to compound above CPI over the hold.
Questions for the listing agent
- It's been on market 46 days. Have you received any prior offers? Is the seller open to a 3% concession, seller financing, or rate buy-down credit?
- Built in 1900 — when were the roof, HVAC, electrical panel, plumbing, and water heater last replaced?
- Is there a deadline driving the sale (1031 exchange, divorce, estate, relocation)? That informs how much negotiation room exists.
- Schools are F-rated, which usually means shorter tenancies and higher turnover. Who's the typical renter profile here, and what's been the actual vacancy rate?
- Crime grade is D in this area — have there been break-ins, vandalism, or insurance claims at this property in the last 3 years? What carrier currently insures it and at what premium?
- What's the average days-on-market for RENTAL listings here right now (not sales)? A rising rental-DOM trend means longer vacancies and softer asking-rent achievability than the comps imply.
- What's the recent tenant-quality profile in this submarket — average credit score on applications, eviction rate, late-payment / NSF rate, and stable-employment percentage? A property-management company in the area should have these aggregated.
- How much new for-sale + rental construction is in the pipeline within 1–3 miles? Heavy new supply typically softens prices + rents 12–24 months out; constrained supply supports both.
Investment metrics
- 1% rule
- 1.27% ✓
- Cap rate
- 9.28%
- Cash-on-cash
- 10.65%
- DSCR
- 1.47
- GRM
- 6.6
CMA / ARV
- ARV (median comp)
- $231,578
- List price
- $164,000
- Delta
- -29.18%
- Verdict
- UNDERPRICED
- Comps
- 20 within 1.0 mi
Show comp detail 12 sales within ~0.75 mi
| Address | Dist | Beds/Ba | Sqft | Sold | Price | $/sf | Match |
|---|---|---|---|---|---|---|---|
| 210 Centennial Ave | 0.49mi | 4/1.0 (-1) | 1,548 (-0%) | 6mo | $210,000 | $136 | 63 |
| 311 Wirt Ave | 0.34mi | 4/2.0 (-1) | 1,664 (+7%) | 5mo | $331,000 | $199 | 63 |
| 832 Baltimore St | 0.52mi | 4/1.5 (-1) | 1,536 (-1%) | 7mo | $175,000 | $114 | 61 |
| 246 Locust St | 0.56mi | 4/2.0 (-1) | 1,632 (+5%) | 0mo | $125,000 | $77 | 60 |
| 45 Wilmar Ave | 0.41mi | 4/2.0 (-1) | 1,627 (+5%) | 10mo | $260,000 | $160 | 60 |
| 125 Charles Ave | 0.38mi | 4/2.0 (-1) | 1,660 (+7%) | 9mo | $272,000 | $164 | 58 |
| 551 York St | 0.41mi | 4/1.0 (-1) | 1,704 (+10%) | 4mo | $242,000 | $142 | 53 |
| 524 Fulton St | 0.69mi | 4/1.0 (-1) | 1,490 (-4%) | 1mo | $236,000 | $158 | 51 |
| 827 York St | 0.65mi | 4/2.0 (-1) | 1,480 (-5%) | 13mo | $223,000 | $151 | 46 |
| 512 Fulton St | 0.69mi | 4/1.5 (-1) | 1,632 (+5%) | 13mo | $235,000 | $144 | 41 |
| 18 Center St | 0.68mi | 4/2.0 (-1) | 1,698 (+9%) | 13mo | $250,000 | $147 | 37 |
| 104 Park Heights Blvd | 0.65mi | 4/2.0 (-1) | 1,729 (+11%) | 13mo | $300,000 | $174 | 35 |
Match score weights: distance 35% · size 25% · config 20% · recency 20%. Top-matched comps best support the ARV.
Projected returns pro-forma
-3.0% appreciation · 4.67% rent growth · sell at horizon
- IRR
- 1.7%
- Equity multiple
- 1.07×
- Total profit
- $3,029
- Equity at exit
- $24,453
- IRR
- 13.0%
- Equity multiple
- 2.12×
- Total profit
- $51,500
- Equity at exit
- $14,180
Cash invested: $45,920 (down + closing). Projections, not guarantees.
Landlord ↔ Tenant lean methodology
- Overall (STATE)
- 62 Landlord-Friendly
- State Pennsylvania
- 62 Landlord-Friendly · EVEN
- County
- — inherits STATE
- City
- — inherits STATE
ZIP-level market 17331
- Home prices YoY
- -33.8%
- Rents YoY
- 4.7%
- Active inventory
- 386
- Price-to-rent
- 6.6×
Monthly cashflow live
- Estimated rent
- $2,075 medium interval (Pro) →
- Mortgage (P&I)
- −$860
- Tax from tax record
- −$303 /mo · $3,641/yr
- Insurance
- −$68
- HOA
- −$0
- Vacancy / Maint / Mgmt
- −$436
- Net cashflow
- $408
Break-even live
UW: 25.0% down · 7.5% · 30yr · 1.5% tax · 5.0% vac · 8.0% maint · 8.0% mgmt
Financing live
Cash to close
- Down payment
- $41,000
- Closing costs
- $4,920
- Reserves months
- —
- Total cash needed
- —
Loan-product check · same deal, 3 products live
Conventional
25% down · 7.5% · 30yr
- Down + closing
- —
- Monthly P&I
- —
- Monthly cashflow
- —
- DSCR
- —
- Eligible?
- —
Personal DTI + credit; lowest rate.
DSCR
20% down · 8.5% · 30yr
- Down + closing
- —
- Monthly P&I
- —
- Monthly cashflow
- —
- DSCR
- —
- Eligible?
- —
No personal income docs; deal must DSCR.
Hard money
10% down · 12.0% · 12mo
- Down + closing
- —
- Monthly P&I
- —
- Monthly cashflow
- —
- DSCR
- —
- Eligible?
- —
Short-term bridge; refi at stabilization.
Rent comps 2 comps
| Address | Beds | Baths | Sqft | Rent | $/sqft | DOM | Units | Dist |
|---|---|---|---|---|---|---|---|---|
| 40 Mustang Dr Hanover, PA | 4.0 | 2.5 | 1625 | $1,843 | $1.13 | 43d | 1 | 0.59mi |
| 20 Mustang Dr Hanover, PA | 4.0 | 2.5 | 1625 | $1,931 | $1.19 | 43d | 1 | 0.60mi |
Listing history 36 events
-
2026-06-18days on market $164,000 Active 46 DOM
-
2026-06-17days on market $164,000 Active 45 DOM
-
2026-06-16days on market $164,000 Active 44 DOM
-
2026-06-15days on market $164,000 Active 43 DOM
-
2026-06-14days on market $164,000 Active 41 DOM
-
2026-06-13days on market $164,000 Active 40 DOM
-
2026-06-10days on market $164,000 Active 38 DOM
-
2026-06-09days on market $164,000 Active 37 DOM
-
2026-06-08days on market $164,000 Active 36 DOM
-
2026-06-07pricedays on market $164,000 Active 35 DOM
-
2026-06-02days on market $174,000 Active 30 DOM
-
2026-06-01days on market $174,000 Active 29 DOM
-
2026-05-31days on market $174,000 Active 28 DOM
-
2026-05-30days on market $174,000 Active 27 DOM
-
2026-05-03$174,000 Active 1810-char remark
-
2020-02-03soldstatus $159,900
-
2020-01-31status Pending 203-char remark
Show marketing remark (203 chars)
Newly renovated 4 Bedrooms and 2 Bath Colonial in Southwestern Schools. With all new paint, flooring, exterior siding, landscaping, and an updated HVAC this will not last long!! Schedule a showing today!
-
2020-01-31soldstatus $159,900 Closed 203-char remark
Show marketing remark (203 chars)
Newly renovated 4 Bedrooms and 2 Bath Colonial in Southwestern Schools. With all new paint, flooring, exterior siding, landscaping, and an updated HVAC this will not last long!! Schedule a showing today!
-
2020-01-29$159,900 Active 203-char remark
Show marketing remark (203 chars)
Newly renovated 4 Bedrooms and 2 Bath Colonial in Southwestern Schools. With all new paint, flooring, exterior siding, landscaping, and an updated HVAC this will not last long!! Schedule a showing today!
-
2020-01-28status Pending
-
2020-01-28historical
-
2020-01-07historical Active Under Contract
-
2019-11-26price $159,900
-
2019-11-02$169,895 Active
-
2019-11-02historical
-
2019-09-27price $169,895
-
2019-08-09$169,995 Active
-
2019-08-07soldstatus $58,000
-
2019-07-31soldstatus $58,000 Closed
-
2019-07-10status Pending
-
2019-06-11price $60,000
-
2019-05-17price $65,000
-
2019-03-28$70,000 Active
-
1999-10-21soldstatus $62,500
-
1990-05-15soldstatus $73,900
-
1988-04-18soldstatus $63,000
ⓘ Source: listings_history table (triggers on properties + properties_extension) + one-shot
backfill from property_details.listing_events for pre-trigger history.
Tax reassessment forecast PA · Partial reset (capped growth)
- Current annual tax
- $3,641 · $303/mo
- Projected year-2 tax
- $3,641 · $303/mo
- Expected delta
- $0/yr ($0/mo · 0.0%)
ⓘ Screening estimate from a state-policy table — verify with the county assessor before closing.
Climate risk First Street
- Flood 1/10 Low FEMA zone X (unshaded) · 0% chance over 30 yrs
- Wildfire 1/10 Low
- Heat 6/10 Major 7 d/yr ≥102°F today · 15 d/yr by 30 yrs out
- Wind 4/10 Moderate 9% chance of damaging wind over 30 yrs
- Air quality 2/10 Low 1 unhealthy d/yr today · 3 by 30 yrs out
Nearby sold comps map
Loading sold comps map…
Walkable amenities ~0.75 mi
Loading nearby amenities…
Taxation est. · year 1
- Rental income
- $24,904
- − Mortgage interest
- −$9,187
- − Property taxes
- −$3,641
- − Insurance
- −$820
- − Repairs & maintenance
- −$1,992
- − Management
- −$1,992
- − Depreciation
- −$4,771
- Taxable income
- $2,501
- Est. tax owed @ 24.0%
- −$600
- After-tax cash flow
- $4,292/yr
For passive investors: Depreciation is non-cash, so a rental often shows a tax loss while cash-flowing — sheltering income. Rental losses are passive: they offset passive income freely, and up to $25,000/yr can offset ordinary (W-2) income if you actively participate and your MAGI is under $100k (phasing out to $0 by $150k); unused losses carry forward. On sale, claimed depreciation is recaptured at up to 25%, and gains may owe capital-gains tax (a 1031 exchange can defer both). Figures are a year-1 estimate at your 24.0% rate — not tax advice; consult a CPA.
Schools (NCES district)
- District
- South Western SD
- NCES district ID
- 4222470
- Math proficiency
- 37% ▼ -16.00%
- Reading proficiency
- 56% ▼ -11.00%
- Median HH income
- $67,689
- Composite
- 41.5/100
- National rank
- #3456
- State rank
- #206 of 539 in PA
Livability — Penn
- Score
- 56/100
- State rank
- #1637
- US rank
- #22584
Category grades
Schools grade is shown separately in the Schools card above.
Census & demographics
- Census place
- Parkville, PA
- County
- York County · 278,806 people
- Metro
- York-Hanover, PA
- Population (ZIP)
- 56,443
- Household income
- $79,488
- Rent vs Own
- Severe rent burden
- 1076.0
Population outlook (York County) Hauer SSP2
- Today (2025)
- 454,205 people
- By 2030
- 457,407 · +0.7%
- By 2040
- 457,529 · +0.7%
- By 2050
- 448,261 · -1.3%
- By 2075
- 427,388 · -5.9%
- By 2100
- 384,218 · -15.4%
Race, ethnicity, and origin ACS 2023
- Neighborhood character
- Predominantly White (86%)
- Race & ethnicity
- White 86% Hispanic / Latino 7% Two or more races 7% Black 3% Asian 1%
- Hispanic origin (detail)
- Mexican 3% Puerto Rican 2%
- Common ancestry
- Romanian 3% Lithuanian 2% Slovak 2%
- Foreign-born
- 4% · Canada
- Languages at home
- 95% English-only · Spanish 3%
Political lean MEDSL · York
- 2024 margin
- Strong R (+25.3) · D 36.9% · R 62.1%
- 2008→2024 swing
- -11.7pp toward R · 2008: -13.6pp · 2024: -25.3pp
- All cycles
- 2024: R+25.3 2020: R+24.6 2016: R+29.3 2012: R+21.2 2008: R+13.6
Not yet ingested
- Civics
- —
Market trends
- HPI YoY
- ▼ -128.48%
- Current HPI
- 251.8974
- Rent YoY
- ▲ 4.67%
- Metro
- York-Hanover, PA
- State GDP YoY
- ▲ 1.68%
- F500 in state
- 34
Industry mix (Fortune 500 HQ in PA)
| Industry | F500 HQs | Revenue |
|---|---|---|
| Healthcare | 2 | $309B |
|
||
| Insurance | 2 | $27B |
|
||
| Telecommunications / Media | 1 | $124B |
|
||
| Industrial Distribution | 1 | $22B |
|
||
| Financial Services | 1 | $20B |
|
||
| Chemicals / Materials | 1 | $18B |
|
||
Price history
+160.3% since first listed23 events — show timeline
- 2026-06-05 Price Changed $164,000 BRIGHT MLS
- 2026-05-03 Listed $174,000 BRIGHT MLS
- 2020-02-03 Sold (Public Records) $159,900 Public Records
- 2020-01-31 Pending — BRIGHT MLS
- 2020-01-31 Sold (MLS) $159,900 BRIGHT MLS
- 2020-01-29 Listed $159,900 BRIGHT MLS
- 2020-01-28 Pending — BRIGHT MLS
- 2020-01-28 Listing Removed — BRIGHT MLS
- 2020-01-07 Contingent — BRIGHT MLS
- 2019-11-26 Price Changed $159,900 BRIGHT MLS
- 2019-11-02 Listing Removed — BRIGHT MLS
- 2019-11-02 Listed $169,895 BRIGHT MLS
- 2019-09-27 Price Changed $169,895 BRIGHT MLS
- 2019-08-09 Listed $169,995 BRIGHT MLS
- 2019-08-07 Sold (Public Records) $58,000 Public Records
- 2019-07-31 Sold (MLS) $58,000 BRIGHT MLS
- 2019-07-10 Pending — BRIGHT MLS
- 2019-06-11 Price Changed $60,000 BRIGHT MLS
- 2019-05-17 Price Changed $65,000 BRIGHT MLS
- 2019-03-28 Listed $70,000 BRIGHT MLS
- 1999-10-21 Sold (Public Records) $62,500 Public Records
- 1990-05-15 Sold (Public Records) $73,900 Public Records
- 1988-04-18 Sold (Public Records) $63,000 Public Records
Property tax history
+3.0%/yrLatest (2026): $3,641 · +4.7% YoY. Source: county tax records.
Cash-flow waterfall
monthlySold comps — $/sqft
last 12 mo · ≤1 miLoading sold comps…