 Multi-family
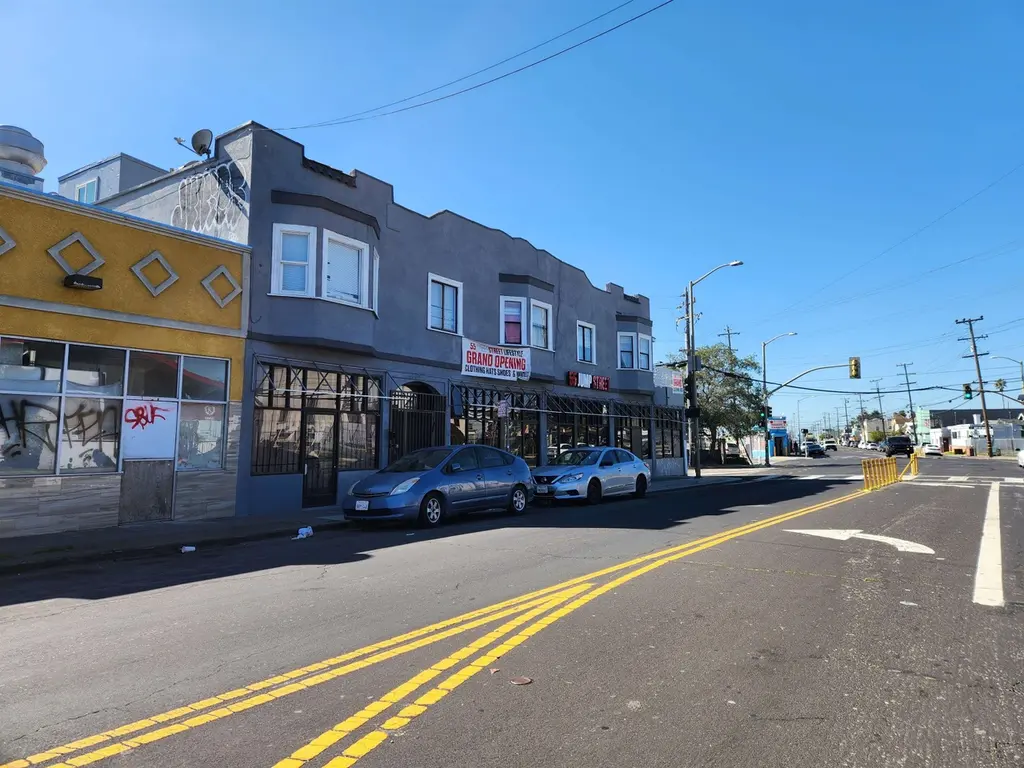
5503 Foothill Blvd · Oakland, CA
Flood risk No data
- FEMA flood zone
- —
- Chance of flooding over 30 yrs
- —
- Est. flood insurance / yr
- —
Fire risk No data
- Est. fire insurance / yr
- —
Heat risk No data
- Hot days now (above threshold)
- —
- Hot days in 30 yrs
- —
Wind risk No data
- Chance of severe wind over 30 yrs
- —
Air-quality risk No data
- Unhealthy air days now
- —
- Unhealthy air days in 30 yrs
- —
Risk factors via First Street. Map © Google.
Why this score? — see what drove the C- grade
The composite is a weighted blend of 9 inputs, each scored 0–100. Each bar is that input's sub-score; the figure is the points it added to the 100-point composite (weight × sub-score).
- Cash flow +25.6/30.0
- DSCR +8.5/10.0
- 1% rule +6.7/10.0
- Livability +3.6/5.0
- Schools +3.0/10.0
- Rent growth +2.7/5.0
- Condition / age +2.5/5.0
- ARV discount +0.0/15.0
- Appreciation +0.0/10.0
$1,100,000
🖨 Deal sheet (PDF) 📄 Offer letter ✓ Due diligence
Multi-family units
County records classify this as Multi-Family (2-4 Unit). Listing-text estimate: 1 unit. estimate disagrees with records
Listing remarks MLS
5503 Foothill Blvd offers a mixed-use investment opportunity with a blend of residential and commercial income in a high-visibility Oakland corridor. Built in 1917, the property is approximately 4,753 square feet on a 2,550-square-foot lot. The residential mix includes one one-bedroom/one-bath unit and five studio units, three of which are currently vacant. Two street-level commercial spaces anchor the building, with one anticipated to be delivered vacant, providing flexibility for a new tenant or owneruser. With its combination of residential turnover, commercial frontage, and strategic location along Foothill Blvd, 5503 Foothill Blvd presents a clear opportunity to reposition unit and enhance long-term value.
Key facts
- 2,550 sq ft lot
- Built 1917
- Listed 158 days
Neighborhood map
What this means for you Summary
Snapshot
- This is a multifamily listed at $1.10M.
Deal economics
- At list price, monthly cash flow is $3k ($31k/yr) — positive.
- The deal already cash-flows at list — no discount required.
- Meets the 1% rule at list price ($13k rent vs $1.10M).
- Recommended offer: $968k (12.0% below list) — sets the bar for market timing.
- Cap rate 9.1% vs local median 2.4% in Oakland — top-decile yield for the area; either an underpriced asset or a hidden risk that comps aren't pricing in. Stress-test before assuming the spread holds.
Location & tenants
- Location reads 71/100 on livability (#224 in CA) — a middle-class / working-renter tenant base. Strengths: amenities A+, commute A+, employment A+; Watch: schools C-, crime F, cost of living F.
- Oakland Unified (urban): math 27% / reading 33% proficiency, ranked #1,007 of 1,400 in CA (top 72%) — families likely to look elsewhere, expect single-tenant / working-renter base with shorter leases; 68% free/reduced lunch — lower-income household profile, screen leases tightly.
- Market conditions: Rents flat; 187 active listings in the ZIP; solid renter incomes; 1,742 units permitted in Alameda County in 2024 (856 in 5+ unit buildings).
- At $12,898/mo this rent would consume 146% of the median local household income ($106k/yr) (locally 2086% of renters already pay >50% of income on rent) — very limited rent-growth headroom before tenants either downsize or default.
Forward outlook
- Local home prices are declining (-3.0%/yr); year-one equity from $8k of loan paydown is wiped out by about $33k of value loss. Plan a longer hold.
- Alameda County population projected at +34% by 2050 — long-run rental-demand tailwind backs the buy-and-hold thesis.
Negotiation context
- It's been on market 159 days — a 12% lower offer ($968k) is reasonable based on typical stale-listing flexibility.
- 3 sale attempts since 13y ago with the ask held roughly flat each time — persistent listings suggest the price (not the market) is what's stuck; bring a comps-based counter.
Risks & watch-outs
- Watch-outs: built in 1917 — expect roof / HVAC / electrical / plumbing capex.
Questions for the listing agent
- It's been on market 159 days. Have you received any prior offers? Is the seller open to a 12% concession, seller financing, or rate buy-down credit?
- Built in 1917 — when were the roof, HVAC, electrical panel, plumbing, and water heater last replaced?
- Why hasn't it sold? Are there any deal-killer items the seller is aware of (foundation, flood, title, zoning, code violations)?
- Is there a deadline driving the sale (1031 exchange, divorce, estate, relocation)? That informs how much negotiation room exists.
- Crime grade is F in this area — have there been break-ins, vandalism, or insurance claims at this property in the last 3 years? What carrier currently insures it and at what premium?
- What's the average days-on-market for RENTAL listings here right now (not sales)? A rising rental-DOM trend means longer vacancies and softer asking-rent achievability than the comps imply.
- What's the recent tenant-quality profile in this submarket — average credit score on applications, eviction rate, late-payment / NSF rate, and stable-employment percentage? A property-management company in the area should have these aggregated.
- How much new apartment / multifamily construction is in the pipeline within 1–3 miles? Heavy new supply (>2% of stock underway) typically softens rents 12–24 months out; light construction supports rent growth.
Investment metrics
- 1% rule
- 1.17% ✓
- Cap rate
- 9.12%
- Cash-on-cash
- 10.08%
- DSCR
- 1.45
- GRM
- 7.1
CMA / ARV
- ARV (median comp)
- $908,046
- List price
- $1,100,000
- Delta
- 21.14%
- Verdict
- OVERPRICED
- Comps
- 20 within 1.0 mi
Show comp detail 3 sales within ~0.75 mi
| Address | Dist | Beds/Ba | Sqft | Sold | Price | $/sf | Match |
|---|---|---|---|---|---|---|---|
| 2312 55th Ave | 0.04mi | 10/6.0 | 4,160 (-12%) | 9mo | $925,000 | $222 | 70 |
| 5420 Ygnacio Ave | 0.16mi | 8/4.0 | 4,080 (-14%) | 12mo | $795,200 | $195 | 59 |
| 4546 San Carlos Ave | 0.67mi | 9/5.0 | 4,113 (-14%) | 10mo | $870,000 | $212 | 38 |
Match score weights: distance 35% · size 25% · config 20% · recency 20%. Top-matched comps best support the ARV.
Projected returns pro-forma
-3.0% appreciation · 0.65% rent growth · sell at horizon
- IRR
- -3.8%
- Equity multiple
- 0.86×
- Total profit
- $-43,049
- Equity at exit
- $164,014
- IRR
- 3.0%
- Equity multiple
- 1.19×
- Total profit
- $58,863
- Equity at exit
- $95,108
Cash invested: $308,000 (down + closing). Projections, not guarantees.
Landlord ↔ Tenant lean methodology
- Overall (CITY)
- 0 Strongly Tenant-Friendly
- State California
- 18 Strongly Tenant-Friendly · D+13
- County
- — inherits STATE
- City Oakland
- 0 Strongly Tenant-Friendly · D+62
ZIP-level market 94605
- Rents YoY
- 0.7%
- Active inventory
- 187
- Price-to-rent
- 43.4×
Monthly cashflow live
- Estimated rent
- $12,898 high interval (Pro) →
- Mortgage (P&I)
- −$5,769
- Tax est. 1.5%
- −$1,375 /mo · $16,500/yr
- Insurance
- −$458
- HOA
- −$0
- Vacancy / Maint / Mgmt
- −$2,709
- Net cashflow
- $2,588
Break-even live
Sensitivity live
| Price | -10% $3,348 | -5% $2,968 | +0% $2,588 | +5% $2,207 | +10% $1,827 |
|---|---|---|---|---|---|
| Rent | -10% $1,569 | -5% $2,078 | +0% $2,588 | +5% $3,097 | +10% $3,607 |
| Rate | -1.0pp $3,142 | -0.5pp $2,867 | base $2,588 | +0.5pp $2,303 | +1.0pp $2,013 |
6-unit breakdown (identical units grouped — click to expand)
| Units | Beds | Baths | Est. rent |
|---|---|---|---|
| 1× unit | 1 | 1 | $2,113 |
| 5× units | 0 | 1 | $10,785 |
| #2 | 0 | 1 | $2,157 |
| #3 | 0 | 1 | $2,157 |
| #4 | 0 | 1 | $2,157 |
| #5 | 0 | 1 | $2,157 |
| #6 | 0 | 1 | $2,157 |
| Total (6 units) | $12,898 | ||
UW: 25.0% down · 7.5% · 30yr · 1.5% tax · 5.0% vac · 8.0% maint · 8.0% mgmt
Financing live
Cash to close
- Down payment
- $275,000
- Closing costs
- $33,000
- Reserves months
- —
- Total cash needed
- —
Loan-product check · same deal, 3 products live
Conventional
25% down · 7.5% · 30yr
- Down + closing
- —
- Monthly P&I
- —
- Monthly cashflow
- —
- DSCR
- —
- Eligible?
- —
Personal DTI + credit; lowest rate.
DSCR
20% down · 8.5% · 30yr
- Down + closing
- —
- Monthly P&I
- —
- Monthly cashflow
- —
- DSCR
- —
- Eligible?
- —
No personal income docs; deal must DSCR.
Hard money
10% down · 12.0% · 12mo
- Down + closing
- —
- Monthly P&I
- —
- Monthly cashflow
- —
- DSCR
- —
- Eligible?
- —
Short-term bridge; refi at stabilization.
Listing history 22 events
-
2026-06-21days on market $1,100,000 Active 159 DOM
-
2026-06-18days on market $1,100,000 Active 156 DOM
-
2026-06-17days on market $1,100,000 Active 155 DOM
-
2026-06-16days on market $1,100,000 Active 154 DOM
-
2026-06-15days on market $1,100,000 Active 153 DOM
-
2026-06-13days on market $1,100,000 Active 151 DOM
-
2026-06-13days on market $1,100,000 Active 150 DOM
-
2026-06-09days on market $1,100,000 Active 147 DOM
-
2026-06-08days on market $1,100,000 Active 146 DOM
-
2026-06-07days on market $1,100,000 Active 145 DOM
-
2026-06-04days on market $1,100,000 Active 142 DOM
-
2026-06-03days on market $1,100,000 Active 141 DOM
-
2026-06-02days on market $1,100,000 Active 140 DOM
-
2026-06-01days on market $1,100,000 Active 139 DOM
-
2026-05-31days on market $1,100,000 Active 138 DOM
-
2026-01-13$1,100,000 Active 720-char remark
Show marketing remark (720 chars)
5503 Foothill Blvd offers a mixed-use investment opportunity with a blend of residential and commercial income in a high-visibility Oakland corridor. Built in 1917, the property is approximately 4,753 square feet on a 2,550-square-foot lot. The residential mix includes one one-bedroom/one-bath unit and five studio units, three of which are currently vacant. Two street-level commercial spaces anchor the building, with one anticipated to be delivered vacant, providing flexibility for a new tenant or owneruser. With its combination of residential turnover, commercial frontage, and strategic location along Foothill Blvd, 5503 Foothill Blvd presents a clear opportunity to reposition unit and enhance long-term value.
-
2019-01-18historical
-
2019-01-18historical
-
2013-11-30historical
-
2013-04-09$525,000
-
2013-03-19historical
-
2013-01-14$530,000
ⓘ Source: listings_history table (triggers on properties + properties_extension) + one-shot
backfill from property_details.listing_events for pre-trigger history.
Nearby sold comps map
Loading sold comps map…
Walkable amenities ~0.75 mi
Loading nearby amenities…
Taxation est. · year 1
- Rental income
- $154,776
- − Mortgage interest
- −$61,617
- − Property taxes
- −$16,500
- − Insurance
- −$5,500
- − Repairs & maintenance
- −$12,382
- − Management
- −$12,382
- − Depreciation
- −$32,000
- Taxable income
- $14,395
- Est. tax owed @ 24.0%
- −$3,455
- After-tax cash flow
- $27,596/yr
For passive investors: Depreciation is non-cash, so a rental often shows a tax loss while cash-flowing — sheltering income. Rental losses are passive: they offset passive income freely, and up to $25,000/yr can offset ordinary (W-2) income if you actively participate and your MAGI is under $100k (phasing out to $0 by $150k); unused losses carry forward. On sale, claimed depreciation is recaptured at up to 25%, and gains may owe capital-gains tax (a 1031 exchange can defer both). Figures are a year-1 estimate at your 24.0% rate — not tax advice; consult a CPA.
Schools (NCES district)
- District
- Oakland Unified
- NCES district ID
- 0628050
- Math proficiency
- 27% ▬ 0.00%
- Reading proficiency
- 33% ▬ 0.00%
- Median HH income
- $55,194
- Composite
- 29.52/100
- National rank
- #11769
- State rank
- #1007 of 1400 in CA
Livability — Oakland
- Score
- 71/100
- State rank
- #224
- US rank
- #7245
Category grades
Schools grade is shown separately in the Schools card above.
Census & demographics
- Census place
- Oakland, CA
- County
- Alameda County · 1,614,355 people
- City population
- 385,993
- Metro
- San Francisco-Oakland-Berkeley, CA
- Population (ZIP)
- 44,103
- Household income
- $106,068
- Rent vs Own
- Severe rent burden
- 2086.0
Population outlook (Alameda County) Hauer SSP2
- Today (2025)
- 1,928,884 people
- By 2030
- 2,069,146 · +7.3%
- By 2040
- 2,338,405 · +21.2%
- By 2050
- 2,586,608 · +34.1%
- By 2075
- 3,061,911 · +58.7%
- By 2100
- 3,234,133 · +67.7%
Race, ethnicity, and origin ACS 2023
- Neighborhood character
- Highly diverse neighborhood (Simpson 0.73)
- Race & ethnicity
- Black 40% Hispanic / Latino 27% White 17% Two or more races 11% Asian 9%
- Hispanic origin (detail)
- Mexican 18% Puerto Rican 1%
- Common ancestry
- Italian 2% Lithuanian 1% Romanian 1%
- Foreign-born
- 20% · Canada, China, Vietnam
- Languages at home
- 70% English-only · Spanish 21% Chinese 2% Other Asian/Pacific 2%
Political lean MEDSL · Alameda
- 2024 margin
- Solid D (+53.6) · D 74.6% · R 21.0% · Other 4.4%
- 2008→2024 swing
- -5.9pp toward R · 2008: 59.5pp · 2024: 53.6pp
- All cycles
- 2024: D+53.6 2020: D+62.5 2016: D+64.4 2012: D+59.8 2008: D+59.5
Not yet ingested
- Civics
- —
Market trends
- HPI YoY
- ▼ -793.09%
- Current HPI
- 294.5467
- Rent YoY
- ▲ 0.65%
- Metro
- San Francisco-Oakland-Berkeley, CA
- State GDP YoY
- ▲ 3.21%
- F500 in state
- 116
Industry mix (Fortune 500 HQ in CA)
| Industry | F500 HQs | Revenue |
|---|---|---|
| Technology | 27 | $1,492B |
|
||
| Financial Services | 3 | $174B |
|
||
| Retail | 3 | $44B |
|
||
| Insurance | 3 | $26B |
|
||
| Media / Entertainment | 2 | $115B |
|
||
| Pharmaceuticals / Biotech | 2 | $62B |
|
||
Price history
+107.5% since first listed7 events — show timeline
- 2026-01-13 Listed $1,100,000 bridgeMLS, Bay East AOR, or Contra Costa AOR
- 2019-01-18 Listing Removed — SDMLS
- 2019-01-18 Listing Removed — SDMLS
- 2013-11-30 Listing Removed — bridgeMLS, Bay East AOR, or Contra Costa AOR
- 2013-04-09 Listed $525,000 SDMLS
- 2013-03-19 Listing Removed — bridgeMLS, Bay East AOR, or Contra Costa AOR
- 2013-01-14 Listed $530,000 SDMLS
Cash-flow waterfall
monthlySold comps — $/sqft
last 12 mo · ≤1 miLoading sold comps…