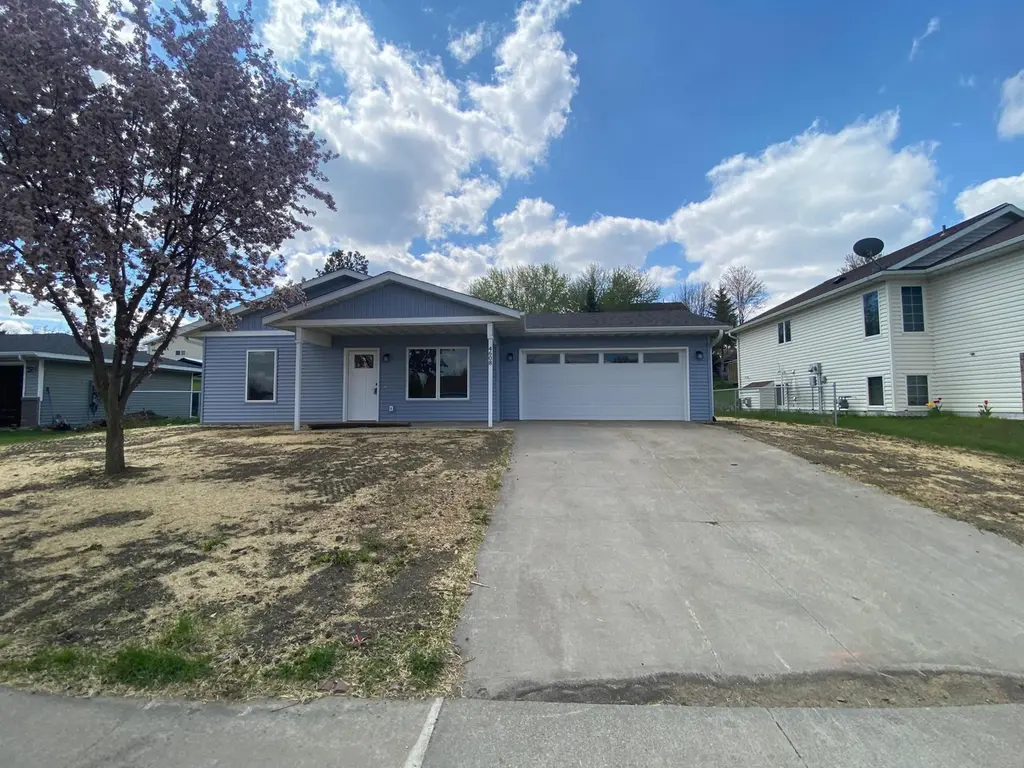
4608 Manor Brook Dr NW · Rochester, MN
Flood risk 1/10 · Minimal
- FEMA flood zone
- X (unshaded)
- Chance of flooding over 30 yrs
- 0.0%
- Est. flood insurance / yr
- $507 – $1,088
Fire risk 1/10 · Minimal
- Est. fire insurance / yr
- $888 – $1,650
Heat risk 2/10 · Minimal
- Hot days now (above 98°F)
- 7 days/yr
- Hot days in 30 yrs
- 15 days/yr
Wind risk 2/10 · Minimal
- Chance of severe wind over 30 yrs
- —
Air-quality risk 2/10 · Minimal
- Unhealthy air days now
- 1 days/yr
- Unhealthy air days in 30 yrs
- 1 days/yr
Risk factors via First Street. Map © Google.
Why this score? — see what drove the C+ grade
The composite is a weighted blend of 9 inputs, each scored 0–100. Each bar is that input's sub-score; the figure is the points it added to the 100-point composite (weight × sub-score).
- Cash flow +23.5/30.0
- ARV discount +12.1/15.0
- DSCR +7.6/10.0
- 1% rule +5.5/10.0
- Livability +4.6/5.0
- Schools +4.1/10.0
- Rent growth +3.0/5.0
- Condition / age +2.5/5.0
- Appreciation +0.0/10.0
$260,000
🖨 Deal sheet (PDF) 📄 Offer letter ✓ Due diligence
Listing remarks
Home is in the Community Land Trust. Must income qualify and owner occupy. Income qualify, no more than $100,500/household at the time of purchase. Home has been almost completely renovated, 4 bedrooms and 2 bathrooms on one floor.
Key facts
- 8,276 sq ft lot
- 2 garage spots
- Built 2004
Property features AI
Finance
- Financial info: Land is leased with a land lease payment of $25
Exterior
- Parking: Attached 2-car garage
- Utilities: City water connected; City sewer connected; Natural gas
- Home design: Residential property; Single-story; Slab foundation
- Construction: Slab foundation
- Exterior features: Vinyl exterior; Lot approximately 0.19 acres (68 x 120)
Interior
- Bedrooms: 4 bedrooms
- Bathrooms: 2 full bathrooms
- Heating & cooling: Forced air heating; Heat pump; Central air conditioning
- Interior features: No basement; One-level living
Neighborhood map
What this means for you Summary
Snapshot
- This is a 4-bed/2.0-bath single-family listed at $260k.
Deal economics
- At list price, monthly cash flow is $485 ($6k/yr) — positive.
- The deal already cash-flows at list — no discount required.
- Meets the 1% rule at list price ($3k rent vs $260k).
- Recommended offer: $256k (1.5% below list) — sets the bar for market timing.
- Cap rate 8.5% vs local median 3.6% in Rochester — top-decile yield for the area; either an underpriced asset or a hidden risk that comps aren't pricing in. Stress-test before assuming the spread holds.
Location & tenants
- Location reads 92/100 on livability (#1 in MN, #27 nationally) — a professional / high-income tenant draw. Strengths: amenities A+, commute A+, employment A+.
- Rochester Public School District (urban): math 40% / reading 51% proficiency, ranked #152 of 301 in MN (top 50%) — families likely to look elsewhere, expect single-tenant / working-renter base with shorter leases.
- Zoned schools: Bishop Elementary (math 51% / reading 51%, grade C-, #406 of 857 statewide, top 48%, 512 students, 41% FRL); John Adams Middle (math 20% / reading 42%, grade F, #191 of 258 statewide, top 74%, 731 students, 42% FRL); John Marshall Senior High (math 37% / reading 58%, grade D, #162 of 471 statewide, top 35%, 1,573 students, 43% FRL).
- Market conditions: Rents rising (+2.2%/yr); 507 active listings in the ZIP; 4 comparable units currently listed for rent nearby; rentals at typical pace (median 16d on market — plan ~3-4 weeks tenant-placement turnaround); solid renter incomes; 1,267 units permitted in Olmsted County in 2024 (915 in 5+ unit buildings).
- This rent runs 35% of the median local income ($95k/yr) — at the standard rent-burdened threshold; future hikes will face affordability resistance.
Forward outlook
- Local home prices are declining (-3.0%/yr); year-one equity from $2k of loan paydown is wiped out by about $8k of value loss. Plan a longer hold.
- Olmsted County population projected at +16% by 2050 — long-run rental-demand tailwind backs the buy-and-hold thesis.
Negotiation context
- It's been on market 28 days — a 2% lower offer ($256k) is reasonable based on typical stale-listing flexibility.
- Current owner paid $79k; list at $260k implies a 230% gain — meaningful room to come down on a strong offer.
Questions for the listing agent
- Is there a deadline driving the sale (1031 exchange, divorce, estate, relocation)? That informs how much negotiation room exists.
- Schools are A-rated — typically a magnet for longer-tenancy family renters. What's the average tenant stay here, and is there a school-zone premium baked into asking?
- What's the average days-on-market for RENTAL listings here right now (not sales)? A rising rental-DOM trend means longer vacancies and softer asking-rent achievability than the comps imply.
- What's the recent tenant-quality profile in this submarket — average credit score on applications, eviction rate, late-payment / NSF rate, and stable-employment percentage? A property-management company in the area should have these aggregated.
- How much new for-sale + rental construction is in the pipeline within 1–3 miles? Heavy new supply typically softens prices + rents 12–24 months out; constrained supply supports both.
Investment metrics
- 1% rule
- 1.05% ✓
- Cap rate
- 8.53%
- Cash-on-cash
- 7.99%
- DSCR
- 1.36
- GRM
- 7.9
CMA / ARV
- ARV (median comp)
- $289,865
- List price
- $260,000
- Delta
- -10.30%
- Verdict
- UNDERPRICED
- Comps
- 1 within 2.0 mi
Projected returns pro-forma
-3.0% appreciation · 2.18% rent growth · sell at horizon
- IRR
- -5.0%
- Equity multiple
- 0.81×
- Total profit
- $-13,539
- Equity at exit
- $38,767
- IRR
- 3.7%
- Equity multiple
- 1.26×
- Total profit
- $18,788
- Equity at exit
- $22,480
Cash invested: $72,800 (down + closing). Projections, not guarantees.
Landlord ↔ Tenant lean methodology
- Overall (STATE)
- 46 Balanced
- State Minnesota
- 46 Balanced · D+2
- County
- — inherits STATE
- City
- — inherits STATE
ZIP-level market 55901
- Home prices YoY
- -33.2%
- Rents YoY
- 2.2%
- Active inventory
- 507
- Price-to-rent
- 7.9×
Monthly cashflow live
- Estimated rent
- $2,731 medium interval (Pro) →
- Mortgage (P&I)
- −$1,363
- Tax from tax record
- −$201 /mo · $2,412/yr
- Insurance
- −$108
- HOA
- −$0
- Vacancy / Maint / Mgmt
- −$573
- Net cashflow
- $485
Break-even live
Sensitivity live
| Price | -10% $632 | -5% $558 | +0% $485 | +5% $411 | +10% $337 |
|---|---|---|---|---|---|
| Rent | -10% $269 | -5% $377 | +0% $485 | +5% $592 | +10% $700 |
| Rate | -1.0pp $616 | -0.5pp $551 | base $485 | +0.5pp $417 | +1.0pp $349 |
UW: 25.0% down · 7.5% · 30yr · 1.5% tax · 5.0% vac · 8.0% maint · 8.0% mgmt
Financing live
Cash to close
- Down payment
- $65,000
- Closing costs
- $7,800
- Reserves months
- —
- Total cash needed
- —
Loan-product check · same deal, 3 products live
Conventional
25% down · 7.5% · 30yr
- Down + closing
- —
- Monthly P&I
- —
- Monthly cashflow
- —
- DSCR
- —
- Eligible?
- —
Personal DTI + credit; lowest rate.
DSCR
20% down · 8.5% · 30yr
- Down + closing
- —
- Monthly P&I
- —
- Monthly cashflow
- —
- DSCR
- —
- Eligible?
- —
No personal income docs; deal must DSCR.
Hard money
10% down · 12.0% · 12mo
- Down + closing
- —
- Monthly P&I
- —
- Monthly cashflow
- —
- DSCR
- —
- Eligible?
- —
Short-term bridge; refi at stabilization.
Rent comps 4 comps
| Address | Beds | Baths | Sqft | Rent | $/sqft | DOM | Units | Dist |
|---|---|---|---|---|---|---|---|---|
| 3680 9th St NW Rochester, MN | 2.0–3.0 | 2.5 | 1600 | $2,695 | $1.68 | 15d | 17 | 0.81mi |
| 1990 Ashland Dr NW Rochester, MN | 1.0–3.0 | 1.0–2.0 | 920 | $1,726 | $1.88 | 15d | 3 | 1.22mi |
| 4275 Heritage Pl NW Rochester, MN | 2.0–5.0 | 2.0–3.5 | 2067 | $3,946 | $1.91 | 15d | 9 | 1.31mi |
| 2257 Jordyn Rd NW Rochester, MN | 3.0 | 2.0 | 1715 | $3,440 | $2.01 | 45d | 1 | 1.48mi |
Listing history 9 events
-
2026-06-02status $260,000 Pending 28 DOM
-
2026-06-01days on market $260,000 Contingent - Inspection 28 DOM
-
2026-05-31days on market $260,000 Contingent - Inspection 27 DOM
-
2026-05-30days on market $260,000 Contingent - Inspection 26 DOM
-
2026-05-04$260,000 Active 231-char remark
-
2025-06-13soldstatus $78,718
-
2004-08-05soldstatus $62,295
-
2004-07-29soldstatus $62,295
-
2003-03-18soldstatus $35,000
ⓘ Source: listings_history table (triggers on properties + properties_extension) + one-shot
backfill from property_details.listing_events for pre-trigger history.
Tax reassessment forecast MN · Partial reset (capped growth)
- Current annual tax
- $2,412 · $201/mo
- Projected year-2 tax
- $2,662 · $222/mo
- Expected delta
- +$250/yr (+$21/mo · 10.4%)
ⓘ Screening estimate from a state-policy table — verify with the county assessor before closing.
Climate risk First Street
- Flood 1/10 Low FEMA zone X (unshaded) · 0% chance over 30 yrs
- Wildfire 1/10 Low
- Heat 2/10 Low 7 d/yr ≥98°F today · 15 d/yr by 30 yrs out
- Wind 2/10 Low
- Air quality 2/10 Low 1 unhealthy d/yr today · 1 by 30 yrs out
Nearby sold comps map
Loading sold comps map…
Walkable amenities ~0.75 mi
Loading nearby amenities…
Taxation est. · year 1
- Rental income
- $32,770
- − Mortgage interest
- −$14,564
- − Property taxes
- −$2,412
- − Insurance
- −$1,300
- − Repairs & maintenance
- −$2,622
- − Management
- −$2,622
- − Depreciation
- −$7,564
- Taxable income
- $1,687
- Est. tax owed @ 24.0%
- −$405
- After-tax cash flow
- $5,410/yr
For passive investors: Depreciation is non-cash, so a rental often shows a tax loss while cash-flowing — sheltering income. Rental losses are passive: they offset passive income freely, and up to $25,000/yr can offset ordinary (W-2) income if you actively participate and your MAGI is under $100k (phasing out to $0 by $150k); unused losses carry forward. On sale, claimed depreciation is recaptured at up to 25%, and gains may owe capital-gains tax (a 1031 exchange can defer both). Figures are a year-1 estimate at your 24.0% rate — not tax advice; consult a CPA.
Schools (NCES district)
- District
- Rochester Public School District
- NCES district ID
- 2731800
- Math proficiency
- 40% ▼ -10.00%
- Reading proficiency
- 51% ▼ -4.00%
- Median HH income
- $66,540
- Composite
- 40.6/100
- National rank
- #3695
- State rank
- #152 of 301 in MN
Livability — Rochester
- Score
- 92/100
- State rank
- #1
- US rank
- #27
Category grades
Schools grade is shown separately in the Schools card above.
Census & demographics
- Census place
- Rochester, MN
- County
- Olmsted County · 135,035 people
- City population
- 135,035
- Metro
- Rochester, MN
- Population (ZIP)
- 58,495
- Household income
- $94,607
- Rent vs Own
- Severe rent burden
- 1651.0
Population outlook (Olmsted County) Hauer SSP2
- Today (2025)
- 165,999 people
- By 2030
- 172,425 · +3.9%
- By 2040
- 183,785 · +10.7%
- By 2050
- 192,981 · +16.3%
- By 2075
- 215,284 · +29.7%
- By 2100
- 224,887 · +35.5%
Race, ethnicity, and origin ACS 2023
- Neighborhood character
- Predominantly White (71%)
- Race & ethnicity
- White 71% Black 12% Asian 8% Two or more races 6% Hispanic / Latino 5%
- Hispanic origin (detail)
- Mexican 3%
- Common ancestry
- Portuguese 11% Romanian 3% Iranian 2%
- Foreign-born
- 15% · Canada, Vietnam, China
- Languages at home
- 81% English-only · Spanish 3% Other Asian/Pacific 3% Arabic 2%
Political lean MEDSL · Olmsted
- 2024 margin
- D (+10.7) · D 54.3% · R 43.6% · Other 2.1%
- 2008→2024 swing
- +7.4pp toward D · 2008: 3.3pp · 2024: 10.7pp
- All cycles
- 2024: D+10.7 2020: D+10.7 2016: D+0.8 2012: D+3.2 2008: D+3.3
Not yet ingested
- Civics
- —
Market trends
- HPI YoY
- ▼ -126.08%
- Current HPI
- 253.7999
- Rent YoY
- ▲ 2.18%
- Metro
- Rochester, MN
- State GDP YoY
- ▲ 2.41%
- F500 in state
- 34
Industry mix (Fortune 500 HQ in MN)
| Industry | F500 HQs | Revenue |
|---|---|---|
| Healthcare | 2 | $407B |
|
||
| Retail | 2 | $150B |
|
||
| Consumer Goods | 2 | $32B |
|
||
| Industrial Machinery | 2 | $6B |
|
||
| Agriculture | 1 | $40B |
|
||
| Healthcare / Medical Devices | 1 | $32B |
|
||
Price history
+642.9% since first listed7 events — show timeline
- 2026-06-01 Pending — NORTHSTARMLS as Distributed by MLS Grid
- 2026-05-20 Contingent — NORTHSTARMLS as Distributed by MLS Grid
- 2026-05-04 Listed $260,000 NORTHSTARMLS as Distributed by MLS Grid
- 2025-06-13 Sold (Public Records) $78,718 Public Records
- 2004-08-05 Sold (Public Records) $62,295 Public Records
- 2004-07-29 Sold (Public Records) $62,295 Public Records
- 2003-03-18 Sold (Public Records) $35,000 Public Records
Property tax history
+3.1%/yrLatest (2025): $2,412 · -15.2% YoY. Source: county tax records.
Cash-flow waterfall
monthlySold comps — $/sqft
last 12 mo · ≤1 miLoading sold comps…