305 E 41st Ave · Gary, IN
Flood risk 6/10 · Moderate
- FEMA flood zone
- X (unshaded)
- Chance of flooding over 30 yrs
- 0.74%
- Est. flood insurance / yr
- $473 – $860
Fire risk 1/10 · Minimal
- Est. fire insurance / yr
- $717 – $1,331
Heat risk 2/10 · Minimal
- Hot days now (above 102°F)
- 7 days/yr
- Hot days in 30 yrs
- 15 days/yr
Wind risk 2/10 · Minimal
- Chance of severe wind over 30 yrs
- 0.0%
Air-quality risk 3/10 · Minor
- Unhealthy air days now
- 2 days/yr
- Unhealthy air days in 30 yrs
- 3 days/yr
Risk factors via First Street. Map © Google.
Why this score? — see what drove the B grade
The composite is a weighted blend of 9 inputs, each scored 0–100. Each bar is that input's sub-score; the figure is the points it added to the 100-point composite (weight × sub-score).
- Cash flow +30.0/30.0
- DSCR +10.0/10.0
- 1% rule +9.7/10.0
- ARV discount +7.5/15.0
- Rent growth +3.7/5.0
- Livability +3.7/5.0
- Appreciation +3.0/10.0
- Condition / age +2.5/5.0
- Schools +0.5/10.0
$89,000
🖨 Deal sheet (PDF) 📄 Offer letter ✓ Due diligence
Listing remarks
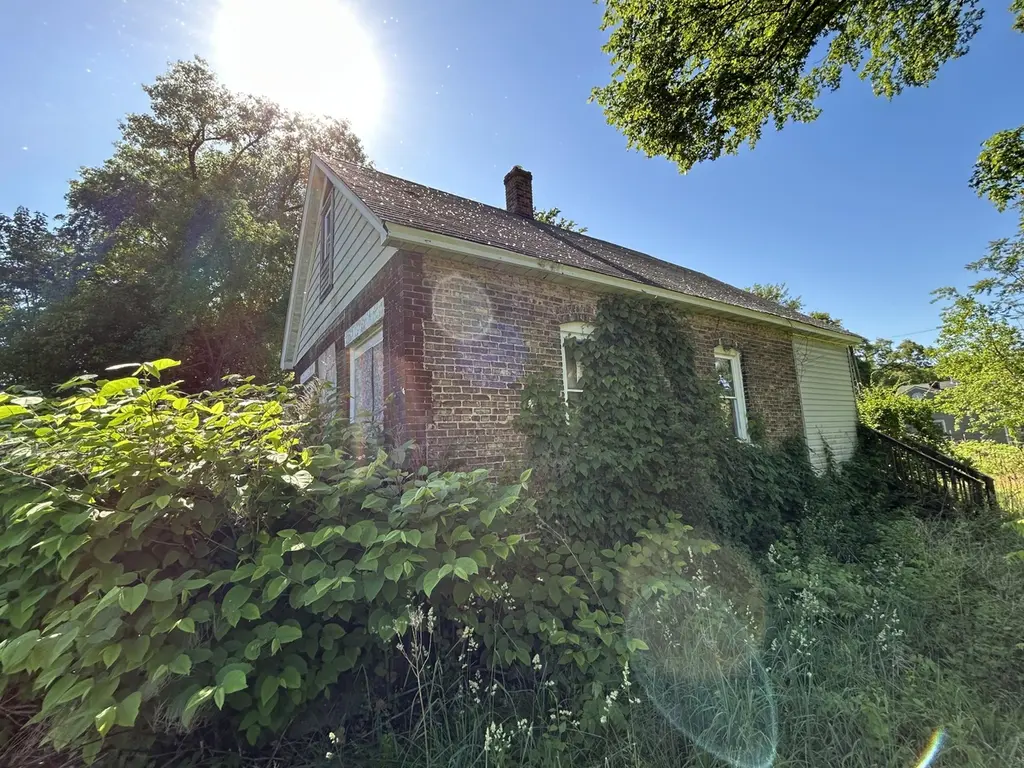
Unlock the potential of this Gary home situated on a spacious corner lot. Portions of the renovation work have been begun, providing a head start for investors, rehabbers, or owner-occupants ready to finish the project and add their personal touch. Whether your goal is a profitable flip, a long-term rental, or creating home equity through improvements, this property offers plenty of upside in a market that continues to gain momentum. The surrounding area is experiencing ongoing home renovations and property improvements, helping to strengthen neighborhood appeal and contribute to rising property values. The oversized corner lot offers additional possibilities beyond the existing home, inclu
Key facts
- Oversized corner lot
- Value-add potential
- Spacious corner lot
Tags
Property features AI
Finance
- Other: Vacant
Exterior
- Parking: Off-street parking; Other parking
- Utilities: Public water; Public sewer
- Home design: One story; Built in 1918
- Construction: Has unfinished basement
- Exterior features: Asphalt roof
Interior
- Kitchen: No appliances listed
- Bedrooms: Primary bedroom; Bedroom 2; Bedroom 3
- Bathrooms: 1 full bathroom
- Heating & cooling: No heating; No cooling
- Interior features: Fixer condition; Neighborhood view; Has unfinished basement
- Laundry & utility: No appliances listed
Neighborhood map
What this means for you Summary
Snapshot
- This is a 3-bed/1.0-bath single-family listed at $89k.
Deal economics
- At list price, monthly cash flow is $513 ($6k/yr) — positive.
- The deal already cash-flows at list — no discount required.
- Meets the 1% rule at list price ($1k rent vs $89k).
- Cap rate 13.2% vs local median 9.1% in Gary — top-decile yield for the area; either an underpriced asset or a hidden risk that comps aren't pricing in. Stress-test before assuming the spread holds.
Location & tenants
- Location reads 73/100 on livability (#105 in IN) — a middle-class / working-renter tenant base. Strengths: commute A+, cost of living A+, housing A+; Watch: schools F, crime F, employment F.
- Gary Community School Corporation (urban): math 3% / reading 11% proficiency, ranked #299 of 301 in IN (top 99%) — low school quality limits family demand, transient renter base, plan for 1-2y turnover; 80% free/reduced lunch — lower-income household profile, screen leases tightly.
- Market conditions: Rents rising fast (+4.8%/yr); 77 active listings in the ZIP; 18 comparable units currently listed for rent nearby; rentals leasing fast (median 5d on market — plan ~1-2 weeks tenant-placement turnaround); lower-income renter base — watch delinquency; 1,642 units permitted in Lake County in 2024 (14 in 5+ unit buildings).
- This rent runs 35% of the median local income ($45k/yr) — at the standard rent-burdened threshold; future hikes will face affordability resistance.
Forward outlook
- Local home prices are declining (-3.0%/yr); year-one equity from $615 of loan paydown is wiped out by about $3k of value loss. Plan a longer hold.
- Lake County population projected to shrink 7% by 2050 — rents likely to lag national; underwrite the cash flow, not the appreciation.
- At projected returns (-3.0% appreciation + 4.8% rent growth), your $25k cash investment doubles in ~5 years — after that, you're playing with house money.
Negotiation context
- Only 3 days on market — expect competitive offers; lowballing is unlikely to land.
- 2 sale attempts since 20y ago with the ask held roughly flat each time — persistent listings suggest the price (not the market) is what's stuck; bring a comps-based counter.
Risks & watch-outs
- Watch-outs: built in 1918 — expect roof / HVAC / electrical / plumbing capex.
- Climate carrying-cost: major flood risk — expect insurance premiums to compound above CPI over the hold.
Questions for the listing agent
- Built in 1918 — when were the roof, HVAC, electrical panel, plumbing, and water heater last replaced?
- Is there a deadline driving the sale (1031 exchange, divorce, estate, relocation)? That informs how much negotiation room exists.
- Schools are F-rated, which usually means shorter tenancies and higher turnover. Who's the typical renter profile here, and what's been the actual vacancy rate?
- Crime grade is F in this area — have there been break-ins, vandalism, or insurance claims at this property in the last 3 years? What carrier currently insures it and at what premium?
- What's the average days-on-market for RENTAL listings here right now (not sales)? A rising rental-DOM trend means longer vacancies and softer asking-rent achievability than the comps imply.
- What's the recent tenant-quality profile in this submarket — average credit score on applications, eviction rate, late-payment / NSF rate, and stable-employment percentage? A property-management company in the area should have these aggregated.
- How much new for-sale + rental construction is in the pipeline within 1–3 miles? Heavy new supply typically softens prices + rents 12–24 months out; constrained supply supports both.
Investment metrics
- 1% rule
- 1.47% ✓
- Cap rate
- 13.21%
- Cash-on-cash
- 24.71%
- DSCR
- 2.10
- GRM
- 5.7
CMA / ARV
- ARV (on-the-fly)
- $44,660
- Comps found
- 12
Show comp detail 12 sales within ~0.75 mi
| Address | Dist | Beds/Ba | Sqft | Sold | Price | $/sf | Match |
|---|---|---|---|---|---|---|---|
| 4001 Virginia St | 0.23mi | 2/1.0 (-1) | 760 (-1%) | 8mo | $45,000 | $59 | 76 |
| 4045 Massachusetts St | 0.15mi | 2/1.5 (-1) | 736 (-4%) | 8mo | $3,500 | $5 | 72 |
| 4217 Massachusetts St | 0.19mi | 2/1.0 (-1) | 840 (+9%) | 1mo | $28,000 | $33 | 70 |
| 4019 Pennsylvania St | 0.11mi | 2/— (-1) | 856 (+11%) | 4mo | $36,500 | $43 | 68 |
| 4002 Pennsylvania St | 0.13mi | 2/1.0 (-1) | 846 (+10%) | 8mo | $50,000 | $59 | 66 |
| 4217 Maryland St | 0.19mi | 2/1.0 (-1) | 864 (+12%) | 3mo | $49,900 | $58 | 63 |
| 908 E 44th Ave | 0.52mi | 2/1.5 (-1) | 790 (+3%) | 2mo | $34,000 | $43 | 62 |
| 3953 Monroe St | 0.54mi | 2/1.0 (-1) | 740 (-4%) | 2mo | $57,000 | $77 | 61 |
| 3621 Virginia St | 0.63mi | 2/1.0 (-1) | 748 (-3%) | 7mo | $25,000 | $33 | 55 |
| 4341 Maryland St | 0.32mi | 2/1.0 (-1) | 864 (+12%) | 7mo | $59,000 | $68 | 54 |
| 840 E 44th Ave | 0.51mi | 2/1.0 (-1) | 720 (-6%) | 8mo | $78,000 | $108 | 53 |
| 4646 Pennsylvania St | 0.68mi | 2/1.0 (-1) | 734 (-5%) | 4mo | $30,000 | $41 | 52 |
Match score weights: distance 35% · size 25% · config 20% · recency 20%. Top-matched comps best support the ARV.
Projected returns pro-forma
-3.0% appreciation · 4.85% rent growth · sell at horizon
- IRR
- 20.0%
- Equity multiple
- 1.83×
- Total profit
- $20,704
- Equity at exit
- $13,270
- IRR
- 29.3%
- Equity multiple
- 3.83×
- Total profit
- $70,530
- Equity at exit
- $7,695
Cash invested: $24,920 (down + closing). Projections, not guarantees.
Landlord ↔ Tenant lean methodology
- Overall (STATE)
- 90 Strongly Landlord-Friendly
- State Indiana
- 90 Strongly Landlord-Friendly · R+11
- County
- — inherits STATE
- City
- — inherits STATE
ZIP-level market 46409
- Home prices YoY
- -2.0%
- Rents YoY
- 4.8%
- Active inventory
- 77
- Price-to-rent
- 5.7×
Monthly cashflow live
- Estimated rent
- $1,309 high interval (Pro) →
- Mortgage (P&I)
- −$467
- Tax from tax record
- −$17 /mo · $203/yr
- Insurance
- −$37
- HOA
- −$0
- Vacancy / Maint / Mgmt
- −$275
- Net cashflow
- $513
Break-even live
Sensitivity live
| Price | -10% $564 | -5% $538 | +0% $513 | +5% $488 | +10% $463 |
|---|---|---|---|---|---|
| Rent | -10% $410 | -5% $461 | +0% $513 | +5% $565 | +10% $617 |
| Rate | -1.0pp $558 | -0.5pp $536 | base $513 | +0.5pp $490 | +1.0pp $467 |
UW: 25.0% down · 7.5% · 30yr · 1.5% tax · 5.0% vac · 8.0% maint · 8.0% mgmt
Financing live
Cash to close
- Down payment
- $22,250
- Closing costs
- $2,670
- Reserves months
- —
- Total cash needed
- —
Loan-product check · same deal, 3 products live
Conventional
25% down · 7.5% · 30yr
- Down + closing
- —
- Monthly P&I
- —
- Monthly cashflow
- —
- DSCR
- —
- Eligible?
- —
Personal DTI + credit; lowest rate.
DSCR
20% down · 8.5% · 30yr
- Down + closing
- —
- Monthly P&I
- —
- Monthly cashflow
- —
- DSCR
- —
- Eligible?
- —
No personal income docs; deal must DSCR.
Hard money
10% down · 12.0% · 12mo
- Down + closing
- —
- Monthly P&I
- —
- Monthly cashflow
- —
- DSCR
- —
- Eligible?
- —
Short-term bridge; refi at stabilization.
Rent comps 18 comps
| Address | Beds | Baths | Sqft | Rent | $/sqft | DOM | Units | Dist |
|---|---|---|---|---|---|---|---|---|
| 4456 Connecticut St Gary, IN | 3.0 | 1.0 | 1044 | $1,300 | $1.25 | 4d | 1 | 0.46mi |
| 624 W 44th Pl Gary, IN | 3.0 | 1.0 | 836 | $1,250 | $1.50 | 9d | 1 | 0.77mi |
| 816 E 35th Ct Gary, IN | 2.0 | 1.0 | 810 | $1,050 | $1.30 | 0d | 1 | 0.79mi |
| 4018 Tyler St Gary, IN | 3.0 | 1.0 | 880 | $1,350 | $1.53 | 0d | 1 | 0.81mi |
| 3708 Harrison St Gary, IN | 3.0 | 1.5 | 904 | $1,400 | $1.55 | 4d | 1 | 0.90mi |
| 4816 Massachusetts St Gary, IN | 3.0 | 1.0 | 1024 | $1,350 | $1.32 | 17d | 1 | 0.92mi |
| 4040 Fillmore St Gary, IN | 2.0 | 1.0 | 1000 | $1,000 | $1.00 | 12d | 1 | 0.93mi |
| 4170 Fillmore St Gary, IN | 2.0 | 1.0 | 720 | $950 | $1.32 | 21d | 1 | 0.94mi |
| 4748 Monroe St Gary, IN | 3.0 | 1.0 | 1074 | $1,695 | $1.58 | 0d | 1 | 0.98mi |
| 4364 Buchanan St Gary, IN | 3.0 | 1.0 | 900 | $1,400 | $1.56 | 0d | 1 | 1.10mi |
| 801 E 32nd Ave Unit 2 Gary, IN | 2.0 | 1.0 | 850 | $1,300 | $1.53 | 0d | 1 | 1.11mi |
| 1005 W 35th Ave Apt 105 Gary, IN | 2.0 | 1.0 | 601 | $795 | $1.32 | 20d | 1 | 1.14mi |
| 1005 W 35th Ave Apt 202 Gary, IN | 2.0 | 1.0 | 617 | $795 | $1.29 | 3d | 1 | 1.14mi |
| 4905 Kentucky St Unit 4901 Gary, IN | 3.0 | 1.0 | 950 | $1,525 | $1.61 | 26d | 1 | 1.14mi |
| 1015 W 35th Ave Apt 206 Gary, IN | 2.0 | 1.0 | 601 | $795 | $1.32 | 45d | 1 | 1.15mi |
| 5001 Carolina St Gary, IN | 3.0 | 1.0 | 875 | $1,350 | $1.54 | 4d | 1 | 1.17mi |
| 3777 Lincoln St Gary, IN | 2.0 | 1.0 | 800 | $1,150 | $1.44 | 0d | 1 | 1.17mi |
| 4974 Tennessee St Gary, IN | 2.0 | 1.0 | 1100 | $1,175 | $1.07 | 21d | 1 | 1.22mi |
Listing history 3 events
-
2026-06-21days on market $89,000 Active 3 DOM
-
2026-06-18remarks 699-char remark
-
2026-06-18$89,000 Active 1 DOM
ⓘ Source: listings_history table (triggers on properties + properties_extension) + one-shot
backfill from property_details.listing_events for pre-trigger history.
Tax reassessment forecast IN · Partial reset (capped growth)
- Current annual tax
- $203 · $17/mo
- Projected year-2 tax
- $480 · $40/mo
- Expected delta
- +$277/yr (+$23/mo · 136.2%)
ⓘ Screening estimate from a state-policy table — verify with the county assessor before closing.
Climate risk First Street
- Flood 6/10 Major FEMA zone X (unshaded) · 74% chance over 30 yrs
- Wildfire 1/10 Low
- Heat 2/10 Low 7 d/yr ≥102°F today · 15 d/yr by 30 yrs out
- Wind 2/10 Low 0% chance of damaging wind over 30 yrs
- Air quality 3/10 Moderate 2 unhealthy d/yr today · 3 by 30 yrs out
Nearby sold comps map
Loading sold comps map…
Walkable amenities ~0.75 mi
Loading nearby amenities…
Taxation est. · year 1
- Rental income
- $15,705
- − Mortgage interest
- −$4,985
- − Property taxes
- −$203
- − Insurance
- −$445
- − Repairs & maintenance
- −$1,256
- − Management
- −$1,256
- − Depreciation
- −$2,589
- Taxable income
- $4,969
- Est. tax owed @ 24.0%
- −$1,193
- After-tax cash flow
- $4,965/yr
For passive investors: Depreciation is non-cash, so a rental often shows a tax loss while cash-flowing — sheltering income. Rental losses are passive: they offset passive income freely, and up to $25,000/yr can offset ordinary (W-2) income if you actively participate and your MAGI is under $100k (phasing out to $0 by $150k); unused losses carry forward. On sale, claimed depreciation is recaptured at up to 25%, and gains may owe capital-gains tax (a 1031 exchange can defer both). Figures are a year-1 estimate at your 24.0% rate — not tax advice; consult a CPA.
Schools (NCES district)
- District
- Gary Community School Corporation
- NCES district ID
- 1803870
- Math proficiency
- 3% ▼ -10.00%
- Reading proficiency
- 11% ▼ -6.00%
- Median HH income
- $27,739
- Composite
- 4.98/100
- National rank
- #10039
- State rank
- #299 of 301 in IN
Livability — Gary
- Score
- 73/100
- State rank
- #105
- US rank
- #5592
Category grades
Schools grade is shown separately in the Schools card above.
Census & demographics
- Census place
- Gary, IN
- County
- Lake County · 422,878 people
- City population
- 63,701
- Metro
- Chicago-Naperville-Elgin, IL-IN-WI
- Population (ZIP)
- 7,184
- Household income
- $44,667
- Rent vs Own
- Severe rent burden
- 516.0
Population outlook (Lake County) Hauer SSP2
- Today (2025)
- 484,026 people
- By 2030
- 478,091 · -1.2%
- By 2040
- 462,974 · -4.3%
- By 2050
- 449,894 · -7.1%
- By 2075
- 436,169 · -9.9%
- By 2100
- 426,607 · -11.9%
Race, ethnicity, and origin ACS 2023
- Neighborhood character
- Predominantly Black (68%)
- Race & ethnicity
- Black 68% Two or more races 17% Hispanic / Latino 14% White 11%
- Hispanic origin (detail)
- Mexican 8% Puerto Rican 5%
- Common ancestry
- Iranian 1% Romanian 1%
- Foreign-born
- 2% · Canada
- Languages at home
- 94% English-only · Spanish 6%
Political lean MEDSL · Lake
- 2024 margin
- Lean D (+5.6) · D 52.1% · R 46.5% · Other 1.5%
- 2008→2024 swing
- -28.6pp toward R · 2008: 34.3pp · 2024: 5.6pp
- All cycles
- 2024: D+5.6 2020: D+15.1 2016: D+20.6 2012: D+31.0 2008: D+34.3
Not yet ingested
- Civics
- —
Market trends
- HPI YoY
- ▼ -3.91%
- Current HPI
- 190.6724
- Rent YoY
- ▲ 4.85%
- Metro
- Chicago-Naperville-Elgin, IL-IN-WI
- State GDP YoY
- ▲ 2.90%
- F500 in state
- 18
Industry mix (Fortune 500 HQ in IN)
| Industry | F500 HQs | Revenue |
|---|---|---|
| Industrial Machinery | 2 | $37B |
|
||
| Healthcare | 1 | $177B |
|
||
| Pharmaceuticals | 1 | $45B |
|
||
| Metals / Steel | 1 | $18B |
|
||
| Agriculture | 1 | $17B |
|
||
| Packaging | 1 | $12B |
|
||
Price history
+21.1% since first listed2 events — show timeline
- 2026-06-18 Listed $89,000 NIRA MLS as Distributed by MLS Grid
- 2006-10-12 Listed $73,500 NIRA MLS as Distributed by MLS Grid
Property tax history
-19.5%/yrLatest (2024): $203 · -37.5% YoY. Source: county tax records.
Cash-flow waterfall
monthlySold comps — $/sqft
last 12 mo · ≤1 miLoading sold comps…