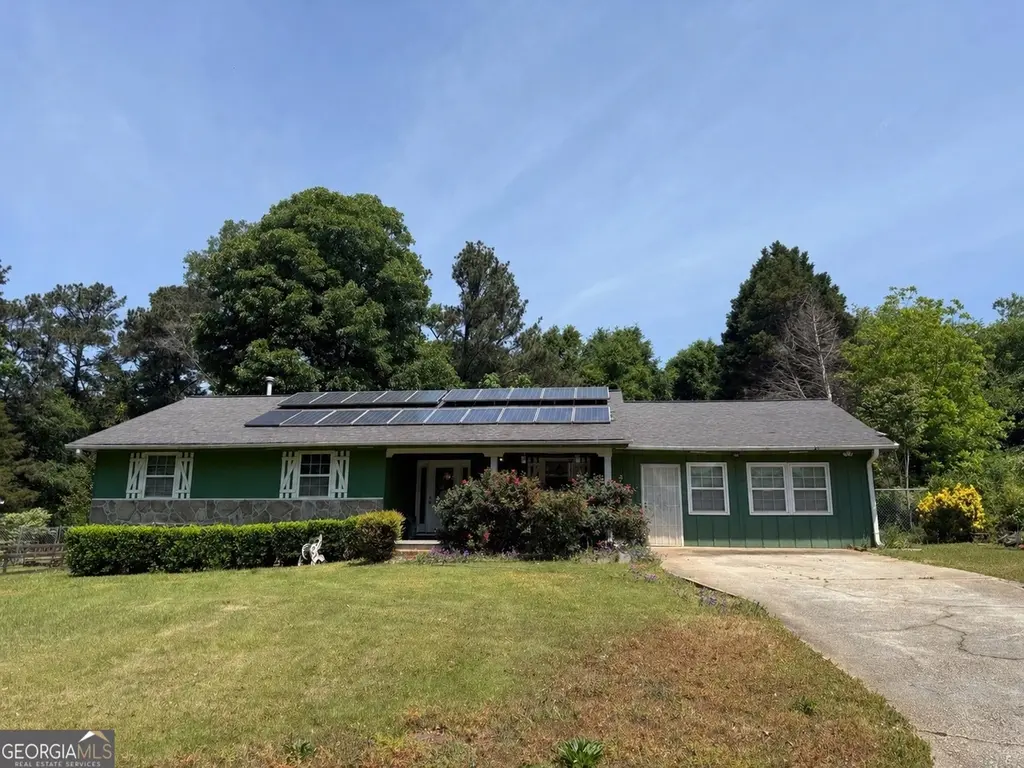
150 Belmont Farms Dr · Stockbridge, GA
Flood risk 1/10 · Minimal
- FEMA flood zone
- X (unshaded)
- Chance of flooding over 30 yrs
- 0.0%
- Est. flood insurance / yr
- $507 – $1,088
Fire risk 3/10 · Minor
- Est. fire insurance / yr
- $963 – $1,789
Heat risk 5/10 · Moderate
- Hot days now (above 105°F)
- 7 days/yr
- Hot days in 30 yrs
- 17 days/yr
Wind risk 6/10 · Moderate
- Chance of severe wind over 30 yrs
- 27.0%
Air-quality risk 4/10 · Minor
- Unhealthy air days now
- 5 days/yr
- Unhealthy air days in 30 yrs
- 7 days/yr
Risk factors via First Street. Map © Google.
Why this score? — see what drove the C- grade
The composite is a weighted blend of 9 inputs, each scored 0–100. Each bar is that input's sub-score; the figure is the points it added to the 100-point composite (weight × sub-score).
- Cash flow +22.9/30.0
- ARV discount +7.4/15.0
- DSCR +7.3/10.0
- 1% rule +4.6/10.0
- Rent growth +3.6/5.0
- Livability +3.0/5.0
- Schools +2.6/10.0
- Condition / age +2.5/5.0
- Appreciation +0.0/10.0
$215,000
🖨 Deal sheet 📄 Offer letter ✓ Due diligence
Listing remarks
Approved probate third-party sale! Great opportunity for an income-seeking investor! This 3-bedroom, 2-bath home is a true diamond in the rough, offering solid bones and endless potential to renovate, customize, or add value. Ideal for those looking to create a profitable investment or transform it into a standout property.
Key facts
- Garage
- Built 1977
- Listed 48 days
Property features AI
Finance
- Financial info: Listing available for cash or other terms; Sold As Is
- HOA & community: No HOA
Exterior
- Parking: Attached garage
- Utilities: Public water; Public sewer; Cable available; Electricity available
- Home design: Single family residence; House structure
- Construction: Built in 1977; Brick and wood siding construction; Other roof type
- Exterior features: Level lot
Interior
- Kitchen: No appliances listed
- Bedrooms: 3 bedrooms on the main level
- Flooring: Carpet; Tile; Vinyl
- Bathrooms: 2 full bathrooms (main level)
- Heating & cooling: Forced air heating; Central air conditioning
- Interior features: One-level layout; Resale condition; No fireplace
- Laundry & utility: Laundry closet
Neighborhood map
What this means for you Summary
Snapshot
- This is a 3-bed/2.0-bath single-family listed at $215k.
Deal economics
- At list price, monthly cash flow is $377 ($5k/yr) — positive.
- The deal already cash-flows at list — no discount required.
- To meet the 1% rule (rent ≥ 1% of price), the offer needs to be $207k (3.5% below list).
- Recommended offer: $207k (3.5% below list) — sets the bar for 1% rule.
- Cap rate 8.4% vs local median 4.3% in Stockbridge — top-decile yield for the area; either an underpriced asset or a hidden risk that comps aren't pricing in. Stress-test before assuming the spread holds.
Location & tenants
- Location reads 60/100 on livability (#389 in GA) — a middle-class / working-renter tenant base. Strengths: housing A+, cost of living A; Watch: crime D, amenities F, commute F.
- Henry County (rural): math 24% / reading 33% proficiency, ranked #89 of 174 in GA (top 51%) — low school quality limits family demand, transient renter base, plan for 1-2y turnover.
- Zoned schools: Fairview Elementary School (math 22% / reading 27%, grade F, #753 of 1,228 statewide, top 64%, 566 students, 69% FRL); Stockbridge Middle School (math 11% / reading 22%, grade F, #388 of 470 statewide, top 83%, 611 students, 70% FRL) — zoned schools average 70% FRL vs 43% district-wide (27 pts higher); higher-poverty schools than district average — tighter screening recommended.
- Market conditions: Rents rising fast (+4.6%/yr); 244 active listings in the ZIP; 8 comparable units currently listed for rent nearby; rentals at typical pace (median 24d on market — plan ~3-4 weeks tenant-placement turnaround); solid renter incomes; 1,989 units permitted in Henry County in 2024 (92 in 5+ unit buildings).
- This rent runs 31% of the median local income ($80k/yr) — at the standard rent-burdened threshold; future hikes will face affordability resistance.
Forward outlook
- Local home prices are declining (-3.0%/yr); year-one equity from $1k of loan paydown is wiped out by about $6k of value loss. Plan a longer hold.
- Henry County population projected at +29% by 2050 — long-run rental-demand tailwind backs the buy-and-hold thesis.
Negotiation context
- It's been on market 48 days — a 3% lower offer ($209k) is reasonable based on typical stale-listing flexibility.
- Current owner paid $82k; list at $215k implies a 161% gain — meaningful room to come down on a strong offer.
Risks & watch-outs
- Climate carrying-cost: major wind risk, 27% chance of damaging wind over 30y; extreme-heat days projected 7→17/yr by 2055 (HVAC capex compounding) — expect insurance premiums to compound above CPI over the hold.
Questions for the listing agent
- It's been on market 48 days. Have you received any prior offers? Is the seller open to a 4% concession, seller financing, or rate buy-down credit?
- Built in 1977 — when were the roof, HVAC, electrical panel, plumbing, and water heater last replaced?
- Is there a deadline driving the sale (1031 exchange, divorce, estate, relocation)? That informs how much negotiation room exists.
- Schools are D-rated, which usually means shorter tenancies and higher turnover. Who's the typical renter profile here, and what's been the actual vacancy rate?
- Crime grade is D in this area — have there been break-ins, vandalism, or insurance claims at this property in the last 3 years? What carrier currently insures it and at what premium?
- What's the average days-on-market for RENTAL listings here right now (not sales)? A rising rental-DOM trend means longer vacancies and softer asking-rent achievability than the comps imply.
- What's the recent tenant-quality profile in this submarket — average credit score on applications, eviction rate, late-payment / NSF rate, and stable-employment percentage? A property-management company in the area should have these aggregated.
- How much new for-sale + rental construction is in the pipeline within 1–3 miles? Heavy new supply typically softens prices + rents 12–24 months out; constrained supply supports both.
Investment metrics
- 1% rule
- 0.96% ✗
- Cap rate
- 8.40%
- Cash-on-cash
- 7.51%
- DSCR
- 1.33
- GRM
- 8.6
CMA / ARV
- ARV (median comp)
- $214,604
- List price
- $215,000
- Delta
- 0.18%
- Verdict
- FAIR
- Comps
- 20 within 1.0 mi
Show comp detail 10 sales within ~0.75 mi
| Address | Dist | Beds/Ba | Sqft | Sold | Price | $/sf | Match |
|---|---|---|---|---|---|---|---|
| 190 Belmont Farms Dr | 0.07mi | 3/2.0 | 1,338 (+4%) | 2mo | $216,000 | $161 | 88 |
| 40 Derby Country Dr | 0.22mi | 3/2.0 | 1,352 (+5%) | 13mo | $180,000 | $133 | 71 |
| 305 Belmont Farms Dr | 0.39mi | 3/2.0 | 1,231 (-4%) | 5mo | $185,000 | $150 | 70 |
| 110 Belmont Farms Dr | 0.07mi | 4/2.0 (+1) | 1,460 (+13%) | 16mo | $178,900 | $123 | 56 |
| 265 Belmont Farms Dr | 0.31mi | 3/2.0 | 1,363 (+6%) | 24mo | $245,000 | $180 | 56 |
| 280 Belmont Farms Dr | 0.35mi | 3/2.0 | 1,154 (-10%) | 15mo | $196,000 | $170 | 54 |
| 241 Orchard Rd | 0.50mi | 4/2.0 (+1) | 1,152 (-11%) | 4mo | $204,900 | $178 | 51 |
| 241 Lariat Ln | 0.67mi | 3/2.0 | 1,231 (-4%) | 17mo | $239,220 | $194 | 47 |
| 325 Winchester Ct | 0.70mi | 3/2.0 | 1,219 (-5%) | 23mo | $224,000 | $184 | 39 |
| 326 Barr Cir NW | 0.68mi | 3/2.0 | 1,400 (+9%) | 18mo | $212,420 | $152 | 39 |
Match score weights: distance 35% · size 25% · config 20% · recency 20%. Top-matched comps best support the ARV.
Projected returns pro-forma
-3.0% appreciation · 4.56% rent growth · sell at horizon
- IRR
- -3.3%
- Equity multiple
- 0.87×
- Total profit
- $-7,636
- Equity at exit
- $32,057
- IRR
- 7.8%
- Equity multiple
- 1.63×
- Total profit
- $37,830
- Equity at exit
- $18,589
Cash invested: $60,200 (down + closing). Projections, not guarantees.
Landlord ↔ Tenant lean methodology
- Overall (STATE)
- 90 Strongly Landlord-Friendly
- State Georgia
- 90 Strongly Landlord-Friendly · R+3
- County
- — inherits STATE
- City
- — inherits STATE
ZIP-level market 30294
- Home prices YoY
- -25.0%
- Rents YoY
- 4.6%
- Active inventory
- 244
- Price-to-rent
- 8.6×
Monthly cashflow live
- Estimated rent
- $2,074 high interval (Pro) →
- Mortgage (P&I)
- −$1,127
- Tax from tax record
- −$44 /mo · $531/yr
- Insurance
- −$90
- HOA
- −$0
- Vacancy / Maint / Mgmt
- −$435
- Net cashflow
- $377
Break-even live
UW: 25.0% down · 7.5% · 30yr · 1.5% tax · 5.0% vac · 8.0% maint · 8.0% mgmt
Financing live
Cash to close
- Down payment
- $53,750
- Closing costs
- $6,450
- Reserves months
- —
- Total cash needed
- —
Loan-product check · same deal, 3 products live
Conventional
25% down · 7.5% · 30yr
- Down + closing
- —
- Monthly P&I
- —
- Monthly cashflow
- —
- DSCR
- —
- Eligible?
- —
Personal DTI + credit; lowest rate.
DSCR
20% down · 8.5% · 30yr
- Down + closing
- —
- Monthly P&I
- —
- Monthly cashflow
- —
- DSCR
- —
- Eligible?
- —
No personal income docs; deal must DSCR.
Hard money
10% down · 12.0% · 12mo
- Down + closing
- —
- Monthly P&I
- —
- Monthly cashflow
- —
- DSCR
- —
- Eligible?
- —
Short-term bridge; refi at stabilization.
Rent comps 8 comps
| Address | Beds | Baths | Sqft | Rent | $/sqft | DOM | Units | Dist |
|---|---|---|---|---|---|---|---|---|
| 85 Derby Country Dr Ellenwood, GA | 3.0 | 2.0 | 1273 | $1,895 | $1.49 | 24d | 1 | 0.37mi |
| 40 Wagon Wheel Dr Rex, GA | 3.0 | 2.0 | 1404 | $1,350 | $0.96 | 5d | 1 | 0.58mi |
| 3769 Stagecoach Pass Ellenwood, GA | 3.0 | 2.0 | 1800 | $2,200 | $1.22 | 43d | 1 | 1.28mi |
| 4595 Westminster Dr Ellenwood, GA | 3.0 | 2.5 | 1689 | $2,055 | $1.22 | 20d | 1 | 1.30mi |
| 4798 Moss Trce Ellenwood, GA | 3.0 | 2.5 | 1730 | $1,990 | $1.15 | 24d | 1 | 1.30mi |
| 85 Wilhelmina Dr Ellenwood, GA | 3.0 | 2.0 | 1600 | $4,900 | $3.06 | 43d | 1 | 1.32mi |
| 3637 Windmill Rd Ellenwood, GA | 3.0 | 1.0 | 1200 | $1,695 | $1.41 | 24d | 1 | 1.32mi |
| 4910 Brookstone Pkwy Ellenwood, GA | 4.0 | 3.0 | 1728 | $1,995 | $1.15 | 1d | 1 | 1.44mi |
Listing history 17 events
-
2026-06-18days on market $215,000 Active 48 DOM
-
2026-06-17days on market $215,000 Active 47 DOM
-
2026-06-16days on market $215,000 Active 46 DOM
-
2026-06-15days on market $215,000 Active 45 DOM
-
2026-06-13days on market $215,000 Active 43 DOM
-
2026-06-09days on market $215,000 Active 39 DOM
-
2026-06-08days on market $215,000 Active 38 DOM
-
2026-06-07days on market $215,000 Active 37 DOM
-
2026-06-04days on market $215,000 Active 34 DOM
-
2026-06-03days on market $215,000 Active 33 DOM
-
2026-06-02days on market $215,000 Active 32 DOM
-
2026-06-01days on market $215,000 Active 31 DOM
-
2026-05-31days on market $215,000 Active 30 DOM
-
2026-04-10$215,000 New 325-char remark
-
1999-12-08soldstatus $82,500
-
1988-07-15soldstatus $66,000
-
1978-02-01soldstatus $39,000
ⓘ Source: listings_history table (triggers on properties + properties_extension) + one-shot
backfill from property_details.listing_events for pre-trigger history.
Tax reassessment forecast GA · Resets to sale price
- Current annual tax
- $531 · $44/mo
- Projected year-2 tax
- $1,978 · $165/mo
- Expected delta
- +$1,447/yr (+$121/mo · 272.2%)
ⓘ Screening estimate from a state-policy table — verify with the county assessor before closing.
Climate risk First Street
- Flood 1/10 Low FEMA zone X (unshaded) · 0% chance over 30 yrs
- Wildfire 3/10 Moderate
- Heat 5/10 Major 7 d/yr ≥105°F today · 17 d/yr by 30 yrs out
- Wind 6/10 Major 27% chance of damaging wind over 30 yrs
- Air quality 4/10 Moderate 5 unhealthy d/yr today · 7 by 30 yrs out
Nearby sold comps map
Loading sold comps map…
Walkable amenities ~0.75 mi
Loading nearby amenities…
Taxation est. · year 1
- Rental income
- $24,885
- − Mortgage interest
- −$12,043
- − Property taxes
- −$531
- − Insurance
- −$1,075
- − Repairs & maintenance
- −$1,991
- − Management
- −$1,991
- − Depreciation
- −$6,255
- Taxable income
- $999
- Est. tax owed @ 24.0%
- −$240
- After-tax cash flow
- $4,283/yr
For passive investors: Depreciation is non-cash, so a rental often shows a tax loss while cash-flowing — sheltering income. Rental losses are passive: they offset passive income freely, and up to $25,000/yr can offset ordinary (W-2) income if you actively participate and your MAGI is under $100k (phasing out to $0 by $150k); unused losses carry forward. On sale, claimed depreciation is recaptured at up to 25%, and gains may owe capital-gains tax (a 1031 exchange can defer both). Figures are a year-1 estimate at your 24.0% rate — not tax advice; consult a CPA.
Schools (NCES district)
- District
- Henry County
- NCES district ID
- 1302820
- Math proficiency
- 24% ▼ -9.00%
- Reading proficiency
- 33% ▼ -7.00%
- Median HH income
- $62,594
- Composite
- 26.13/100
- National rank
- #7279
- State rank
- #89 of 174 in GA
Livability — Stockbridge
- Score
- 60/100
- State rank
- #389
- US rank
- #19479
Category grades
Schools grade is shown separately in the Schools card above.
Census & demographics
- County
- Henry County · 316,359 people
- City population
- 71,603
- Metro
- Atlanta-Sandy Springs-Alpharetta, GA
- Population (ZIP)
- 41,983
- Household income
- $79,762
- Rent vs Own
- Severe rent burden
- 864.0
Population outlook (Henry County) Hauer SSP2
- Today (2025)
- 249,041 people
- By 2030
- 264,369 · +6.2%
- By 2040
- 294,459 · +18.2%
- By 2050
- 322,249 · +29.4%
- By 2075
- 392,310 · +57.5%
- By 2100
- 437,836 · +75.8%
Race, ethnicity, and origin ACS 2023
- Neighborhood character
- Predominantly Black (84%)
- Race & ethnicity
- Black 84% Hispanic / Latino 7% Two or more races 6% White 6% Asian 1%
- Hispanic origin (detail)
- Mexican 6%
- Common ancestry
- Hispanic 1%
- Foreign-born
- 7% · Canada, Vietnam
- Languages at home
- 91% English-only · Spanish 6% Vietnamese 1% French/Haitian/Cajun 1%
Political lean MEDSL · Henry
- 2024 margin
- Strong D (+29.7) · D 64.5% · R 34.9%
- 2008→2024 swing
- +37.1pp toward D · 2008: -7.5pp · 2024: 29.7pp
- All cycles
- 2024: D+29.7 2020: D+20.5 2016: D+4.3 2012: R+3.2 2008: R+7.5
Not yet ingested
- Civics
- —
Market trends
- HPI YoY
- ▼ -70.99%
- Current HPI
- 213.1999
- Rent YoY
- ▲ 4.56%
- Metro
- Atlanta-Sandy Springs-Alpharetta, GA
- State GDP YoY
- ▲ 2.66%
- F500 in state
- 28
Industry mix (Fortune 500 HQ in GA)
| Industry | F500 HQs | Revenue |
|---|---|---|
| Paper / Packaging | 2 | $29B |
|
||
| Retail | 1 | $160B |
|
||
| Transportation / Logistics | 1 | $91B |
|
||
| Airlines | 1 | $62B |
|
||
| Consumer Goods | 1 | $47B |
|
||
| Utilities | 1 | $25B |
|
||
Price history
+451.3% since first listed4 events — show timeline
- 2026-04-10 Listed $215,000 GAMLS
- 1999-12-08 Sold (Public Records) $82,500 Public Records
- 1988-07-15 Sold (Public Records) $66,000 Public Records
- 1978-02-01 Sold (Public Records) $39,000 Public Records
Property tax history
-5.3%/yrLatest (2025): $531 · +71.4% YoY. Source: county tax records.
Cash-flow waterfall
monthlySold comps — $/sqft
last 12 mo · ≤1 miLoading sold comps…