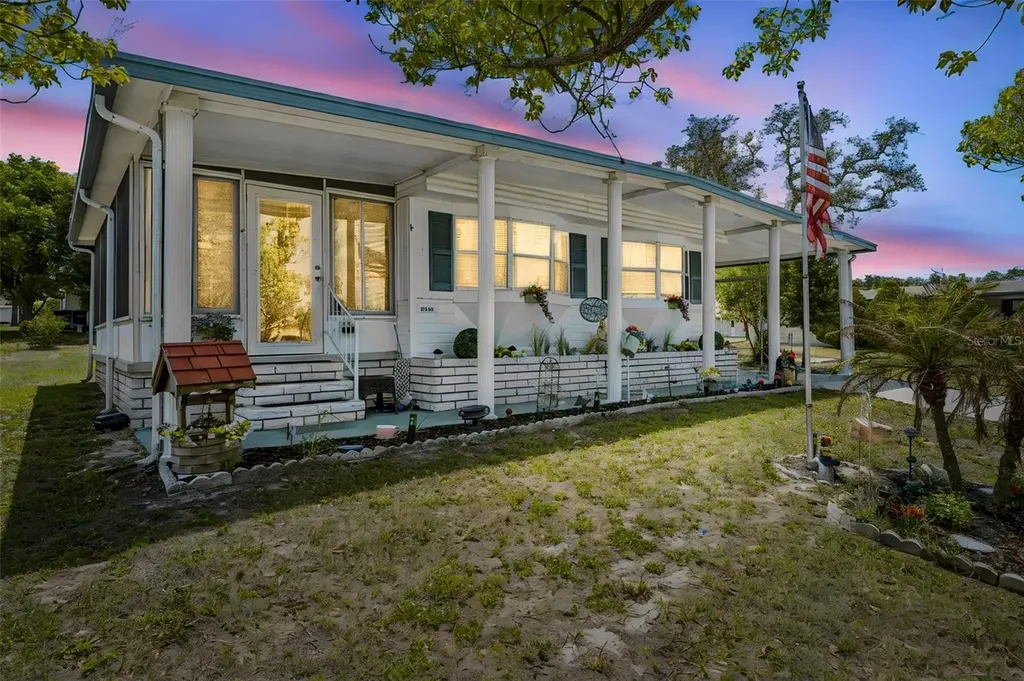
12280 Fairway Ave · High Point, FL
Flood risk 1/10 · Minimal
- FEMA flood zone
- X (unshaded)
- Chance of flooding over 30 yrs
- 0.0%
- Est. flood insurance / yr
- $507 – $1,088
Fire risk 2/10 · Minimal
- Est. fire insurance / yr
- $947 – $1,759
Heat risk 10/10 · Severe
- Hot days now (above 109°F)
- 7 days/yr
- Hot days in 30 yrs
- 24 days/yr
Wind risk 9/10 · Severe
- Chance of severe wind over 30 yrs
- 99.0%
Air-quality risk 2/10 · Minimal
- Unhealthy air days now
- 2 days/yr
- Unhealthy air days in 30 yrs
- 2 days/yr
Risk factors via First Street. Map © Google.
Why this score? — see what drove the B grade
The composite is a weighted blend of 9 inputs, each scored 0–100. Each bar is that input's sub-score; the figure is the points it added to the 100-point composite (weight × sub-score).
- Cash flow +30.0/30.0
- ARV discount +12.0/15.0
- DSCR +10.0/10.0
- 1% rule +8.8/10.0
- Schools +4.2/10.0
- Livability +3.2/5.0
- Rent growth +2.5/5.0
- Condition / age +2.5/5.0
- Appreciation +0.0/10.0
$120,000
🖨 Deal sheet 📄 Offer letter ✓ Due diligence
Listing remarks MLS
Mrs clean lives here,bright and light, berber carpet,tile , very nice home ..
Key facts
- Linen closet
- Spacious double lot
- Large pantry
Tags
Property features AI
Finance
- Financial info: Lease restrictions apply
- HOA & community: Monthly HOA fee of $46; Association amenities include clubhouse, golf course, and pool; Association approval required; Senior community; Pets allowed: cats and dogs (with number limit)
Exterior
- Parking: Parking pad; 1-car carport
- Utilities: Public water; Public sewer; Electricity connected; Cable available; Broadband/high-speed internet available; Water connected; Sewer connected
- Home design: Residential mobile home; Double wide; Single-story; Faces north; Entry level: One
- Construction: Vinyl siding; Membrane roof; Pillar/post/pier foundation; Built as mobile home
- Exterior features: Enclosed patio; Patio; Chain link fence; Storage structure on property; Paved road access
Interior
- Kitchen: Dishwasher; Disposal; Freezer; Microwave; Range; Refrigerator; Electric water heater
- Bedrooms: 2 bedrooms
- Flooring: Ceramic tile; Vinyl
- Bathrooms: 2 full bathrooms
- Heating & cooling: Central heating; Central air
- Interior features: Ceiling fans; Eat-in kitchen; Open floor plan; Other laundry setup
- Laundry & utility: Washer; Dryer; Electric water heater
Neighborhood map
What this means for you Summary
Snapshot
- This is a 2-bed/2.0-bath manufactured listed at $120k.
Deal economics
- At list price, monthly cash flow is $522 ($6k/yr) — positive.
- The deal already cash-flows at list — no discount required.
- Meets the 1% rule at list price ($2k rent vs $120k).
- Recommended offer: $116k (3.0% below list) — sets the bar for market timing.
- Cap rate 11.5% vs local median 5.8% in High Point — top-decile yield for the area; either an underpriced asset or a hidden risk that comps aren't pricing in. Stress-test before assuming the spread holds.
Location & tenants
- Location reads 64/100 on livability (#677 in FL) — a middle-class / working-renter tenant base. Strengths: cost of living A+, housing A+, crime A; Watch: health & safety C-, amenities F, commute F.
- Hernando (suburban): math 50% / reading 50% proficiency, ranked #38 of 73 in FL (top 52%) — acceptable for families but not a draw, mixed tenant base, ~2y average lease.
- Zoned schools: Pine Grove Elementary School (math 60% / reading 45%, grade C-, #976 of 2,144 statewide, top 46%, 991 students, 60% FRL); Hernando High School (math 42% / reading 42%, grade F, #275 of 667 statewide, top 42%, 1,299 students, 58% FRL) — zoned schools at 59% FRL track the district average.
- Market conditions: 691 active listings in the ZIP; 4 comparable units currently listed for rent nearby; rentals at typical pace (median 24d on market — plan ~3-4 weeks tenant-placement turnaround); 2,505 units permitted in Hernando County in 2024 (318 in 5+ unit buildings).
- This rent runs 34% of the median local income ($59k/yr) — at the standard rent-burdened threshold; future hikes will face affordability resistance.
Forward outlook
- Local home prices are declining (-3.0%/yr); year-one equity from $830 of loan paydown is wiped out by about $4k of value loss. Plan a longer hold.
- Hernando County population projected at +11% by 2050 — modest demand growth; plan on rents tracking national, not racing it.
- At projected returns (-3.0% appreciation + 3.0% rent growth), your $34k cash investment doubles in ~7 years — after that, you're playing with house money.
Negotiation context
- It's been on market 56 days — a 3% lower offer ($116k) is reasonable based on typical stale-listing flexibility.
- 3 sale attempts since 23y ago; this cycle's ask has dropped $20k (14%) from the opening price — seller is motivated, your offer sets the floor, not the list.
- Current owner paid $67k; list at $120k implies a 79% gain — meaningful room to come down on a strong offer.
Risks & watch-outs
- Climate carrying-cost: severe wind risk, 99% chance of damaging wind over 30y; extreme-heat days projected 7→24/yr by 2055 (HVAC capex compounding) — expect insurance premiums to compound above CPI over the hold.
Questions for the listing agent
- It's been on market 56 days. Have you received any prior offers? Is the seller open to a 3% concession, seller financing, or rate buy-down credit?
- Built in 1973 — when were the roof, HVAC, electrical panel, plumbing, and water heater last replaced?
- What does the HOA fee cover, when was the last increase, and are there any pending special assessments or reserve-fund shortfalls?
- Is there a deadline driving the sale (1031 exchange, divorce, estate, relocation)? That informs how much negotiation room exists.
- Schools are F-rated, which usually means shorter tenancies and higher turnover. Who's the typical renter profile here, and what's been the actual vacancy rate?
- What's the average days-on-market for RENTAL listings here right now (not sales)? A rising rental-DOM trend means longer vacancies and softer asking-rent achievability than the comps imply.
- What's the recent tenant-quality profile in this submarket — average credit score on applications, eviction rate, late-payment / NSF rate, and stable-employment percentage? A property-management company in the area should have these aggregated.
- How much new for-sale + rental construction is in the pipeline within 1–3 miles? Heavy new supply typically softens prices + rents 12–24 months out; constrained supply supports both.
Investment metrics
- 1% rule
- 1.38% ✓
- Cap rate
- 11.51%
- Cash-on-cash
- 18.65%
- DSCR
- 1.83
- GRM
- 6.0
CMA / ARV
- ARV (on-the-fly)
- $133,400
- Comps found
- 12
Show comp detail 12 sales within ~0.75 mi
| Address | Dist | Beds/Ba | Sqft | Sold | Price | $/sf | Match |
|---|---|---|---|---|---|---|---|
| 8430 Highpoint Blvd | 0.25mi | 2/2.0 | 989 (+8%) | 2mo | $144,900 | $147 | 74 |
| 8116 Weeping Willow St | 0.29mi | 3/2.0 (+1) | 960 (+4%) | 2mo | $215,000 | $224 | 73 |
| 8431 Madison St | 0.57mi | 2/2.0 | 912 (-1%) | 1mo | $155,000 | $170 | 71 |
| 12124 Thornridge St | 0.38mi | 2/2.0 | 980 (+6%) | 4mo | $130,000 | $133 | 68 |
| 8013 Eastern Circle Dr | 0.41mi | 2/2.0 | 828 (-10%) | 2mo | $120,000 | $145 | 63 |
| 12169 Club House Rd | 0.61mi | 2/2.0 | 960 (+4%) | 2mo | $130,000 | $135 | 63 |
| 12112 Sara St | 0.46mi | 2/2.0 | 1,009 (+10%) | 2mo | $114,000 | $113 | 61 |
| 9074 Highpoint Blvd | 0.67mi | 2/2.0 | 960 (+4%) | 3mo | $131,000 | $136 | 58 |
| 8348 Highpoint Blvd | 0.41mi | 2/2.0 | 805 (-12%) | 4mo | $143,000 | $178 | 57 |
| 12087 Club House Rd | 0.68mi | 2/2.0 | 984 (+7%) | 0mo | $125,000 | $127 | 56 |
| 7511 Eastern Circle Dr | 0.45mi | 2/2.0 | 1,056 (+15%) | 3mo | $138,000 | $131 | 52 |
| 9100 Highpoint Blvd | 0.68mi | 2/2.0 | 1,040 (+13%) | 2mo | $177,000 | $170 | 45 |
Match score weights: distance 35% · size 25% · config 20% · recency 20%. Top-matched comps best support the ARV.
Projected returns pro-forma
-3.0% appreciation · 3.0% rent growth · sell at horizon
- IRR
- 10.4%
- Equity multiple
- 1.41×
- Total profit
- $13,812
- Equity at exit
- $17,892
- IRR
- 19.5%
- Equity multiple
- 2.63×
- Total profit
- $54,853
- Equity at exit
- $10,375
Cash invested: $33,600 (down + closing). Projections, not guarantees.
Landlord ↔ Tenant lean methodology
- Overall (STATE)
- 87 Strongly Landlord-Friendly
- State Florida
- 87 Strongly Landlord-Friendly · R+3
- County
- — inherits STATE
- City
- — inherits STATE
ZIP-level market 34613
- Home prices YoY
- -17.2%
- Active inventory
- 691
- Price-to-rent
- 6.0×
Monthly cashflow live
- Estimated rent
- $1,661 medium interval (Pro) →
- Mortgage (P&I)
- −$629
- Tax from tax record
- −$65 /mo · $779/yr
- Insurance
- −$50
- HOA
- −$46
- Vacancy / Maint / Mgmt
- −$349
- Net cashflow
- $522
Break-even live
UW: 25.0% down · 7.5% · 30yr · 1.5% tax · 5.0% vac · 8.0% maint · 8.0% mgmt
Financing live
Cash to close
- Down payment
- $30,000
- Closing costs
- $3,600
- Reserves months
- —
- Total cash needed
- —
Loan-product check · same deal, 3 products live
Conventional
25% down · 7.5% · 30yr
- Down + closing
- —
- Monthly P&I
- —
- Monthly cashflow
- —
- DSCR
- —
- Eligible?
- —
Personal DTI + credit; lowest rate.
DSCR
20% down · 8.5% · 30yr
- Down + closing
- —
- Monthly P&I
- —
- Monthly cashflow
- —
- DSCR
- —
- Eligible?
- —
No personal income docs; deal must DSCR.
Hard money
10% down · 12.0% · 12mo
- Down + closing
- —
- Monthly P&I
- —
- Monthly cashflow
- —
- DSCR
- —
- Eligible?
- —
Short-term bridge; refi at stabilization.
Rent comps 4 comps
| Address | Beds | Baths | Sqft | Rent | $/sqft | DOM | Units | Dist |
|---|---|---|---|---|---|---|---|---|
| 12136 Fairway Ave Brooksville, FL | 2.0 | 2.0 | 920 | $1,650 | $1.79 | 24d | 1 | 0.31mi |
| 12103 Fairway Ave Brooksville, FL | 2.0 | 2.0 | 864 | $1,725 | $2.00 | 1d | 1 | 0.38mi |
| 7402 Eastern Circle Dr Brooksville, FL | 2.0 | 1.0 | 720 | $1,200 | $1.67 | 24d | 1 | 0.62mi |
| 7513 Highpoint Blvd Brooksville, FL | 2.0 | 1.0 | 672 | $1,150 | $1.71 | 24d | 1 | 0.76mi |
HOA detail
- Monthly dues
- $46 · $552/yr
Listing history 21 events
-
2026-06-18days on market $120,000 Active 56 DOM
-
2026-06-17days on market $120,000 Active 55 DOM
-
2026-06-16days on market $120,000 Active 54 DOM
-
2026-06-15days on market $120,000 Active 53 DOM
-
2026-06-13days on market $120,000 Active 51 DOM
-
2026-06-13days on market $120,000 Active 50 DOM
-
2026-06-09days on market $120,000 Active 47 DOM
-
2026-06-08pricedays on market $120,000 Active 46 DOM
-
2026-06-07days on market $130,000 Active 45 DOM
-
2026-06-04days on market $130,000 Active 42 DOM
-
2026-06-03days on market $130,000 Active 41 DOM
-
2026-06-02days on market $130,000 Active 40 DOM
-
2026-06-01days on market $130,000 Active 39 DOM
-
2026-05-31days on market $130,000 Active 38 DOM
-
2026-05-17price $130,000
-
2026-04-23$140,000 Active
-
2019-11-11historical
-
2010-08-27soldstatus $67,000
-
2009-11-12$69,900
-
2003-10-09soldstatus $33,750 77-char remark
Show marketing remark (77 chars)
Mrs clean lives here,bright and light, berber carpet,tile , very nice home ..
-
2003-06-24$39,500 77-char remark
Show marketing remark (77 chars)
Mrs clean lives here,bright and light, berber carpet,tile , very nice home ..
ⓘ Source: listings_history table (triggers on properties + properties_extension) + one-shot
backfill from property_details.listing_events for pre-trigger history.
Tax reassessment forecast FL · Resets to sale price
- Current annual tax
- $779 · $65/mo
- Projected year-2 tax
- $996 · $83/mo
- Expected delta
- +$217/yr (+$18/mo · 27.8%)
ⓘ Screening estimate from a state-policy table — verify with the county assessor before closing.
Climate risk First Street
- Flood 1/10 Low FEMA zone X (unshaded) · 0% chance over 30 yrs
- Wildfire 2/10 Low
- Heat 10/10 Extreme 7 d/yr ≥109°F today · 24 d/yr by 30 yrs out
- Wind 9/10 Extreme 99% chance of damaging wind over 30 yrs
- Air quality 2/10 Low 2 unhealthy d/yr today · 2 by 30 yrs out
Nearby sold comps map
Loading sold comps map…
Walkable amenities ~0.75 mi
Loading nearby amenities…
Taxation est. · year 1
- Rental income
- $19,935
- − Mortgage interest
- −$6,722
- − Property taxes
- −$779
- − Insurance
- −$600
- − Repairs & maintenance
- −$1,595
- − Management
- −$1,595
- − HOA
- −$552
- − Depreciation
- −$3,491
- Taxable income
- $4,601
- Est. tax owed @ 24.0%
- −$1,104
- After-tax cash flow
- $5,161/yr
For passive investors: Depreciation is non-cash, so a rental often shows a tax loss while cash-flowing — sheltering income. Rental losses are passive: they offset passive income freely, and up to $25,000/yr can offset ordinary (W-2) income if you actively participate and your MAGI is under $100k (phasing out to $0 by $150k); unused losses carry forward. On sale, claimed depreciation is recaptured at up to 25%, and gains may owe capital-gains tax (a 1031 exchange can defer both). Figures are a year-1 estimate at your 24.0% rate — not tax advice; consult a CPA.
Schools (NCES district)
- District
- Hernando
- NCES district ID
- 1200810
- Math proficiency
- 50% ▼ -8.00%
- Reading proficiency
- 50% ▼ -4.00%
- Median HH income
- $41,985
- Composite
- 42.03/100
- National rank
- #3329
- State rank
- #38 of 73 in FL
Livability — High Point
- Score
- 64/100
- State rank
- #677
- US rank
- #14099
Category grades
Schools grade is shown separately in the Schools card above.
Census & demographics
- Census place
- High Point, FL
- County
- Hernando County · 169,677 people
- Metro
- Tampa-St. Petersburg-Clearwater, FL
- Population (ZIP)
- 19,337
- Household income
- $58,596
- Rent vs Own
- Severe rent burden
- 307.0
Population outlook (Hernando County) Hauer SSP2
- Today (2025)
- 189,218 people
- By 2030
- 194,367 · +2.7%
- By 2040
- 203,398 · +7.5%
- By 2050
- 209,589 · +10.8%
- By 2075
- 218,452 · +15.4%
- By 2100
- 205,923 · +8.8%
Race, ethnicity, and origin ACS 2023
- Neighborhood character
- Predominantly White (88%)
- Race & ethnicity
- White 88% Hispanic / Latino 6% Two or more races 4% Black 2% Asian 1%
- Hispanic origin (detail)
- Mexican 1% Puerto Rican 2% Cuban 1%
- Common ancestry
- Romanian 4% Lithuanian 3% Slovak 2%
- Foreign-born
- 8% · Canada, Vietnam
- Languages at home
- 92% English-only · Spanish 3% French/Haitian/Cajun 1% Russian/Polish/Slavic 1%
Political lean MEDSL · Hernando
- 2024 margin
- Solid R (+37.0) · D 31.1% · R 68.2%
- 2008→2024 swing
- -33.5pp toward R · 2008: -3.6pp · 2024: -37.0pp
- All cycles
- 2024: R+37.0 2020: R+30.2 2016: R+29.0 2012: R+8.5 2008: R+3.6
Not yet ingested
- Civics
- —
Market trends
- HPI YoY
- ▼ -57.51%
- Current HPI
- 276.2229
- Rent YoY
- —
- Metro
- Tampa-St. Petersburg-Clearwater, FL
- State GDP YoY
- ▲ 3.28%
- F500 in state
- 36
Industry mix (Fortune 500 HQ in FL)
| Industry | F500 HQs | Revenue |
|---|---|---|
| Industrial Technology | 2 | $29B |
|
||
| Insurance | 2 | $17B |
|
||
| Retail | 1 | $60B |
|
||
| Technology Distribution | 1 | $58B |
|
||
| Homebuilding | 1 | $35B |
|
||
| Technology Manufacturing | 1 | $35B |
|
||
Price history
+229.1% since first listed7 events — show timeline
- 2026-05-17 Price Changed $130,000 Stellar MLS as Distributed by MLS Grid
- 2026-04-23 Listed $140,000 Stellar MLS as Distributed by MLS Grid
- 2019-11-11 Listing Removed — HCAR
- 2010-08-27 Sold (Public Records) $67,000 Public Records
- 2009-11-12 Listed $69,900 HCAR
- 2003-10-09 Sold (MLS) $33,750 HCAR
- 2003-06-24 Listed $39,500 HCAR
Property tax history
+11.2%/yrLatest (2025): $779 · +0.5% YoY. Source: county tax records.
Cash-flow waterfall
monthlySold comps — $/sqft
last 12 mo · ≤1 miLoading sold comps…