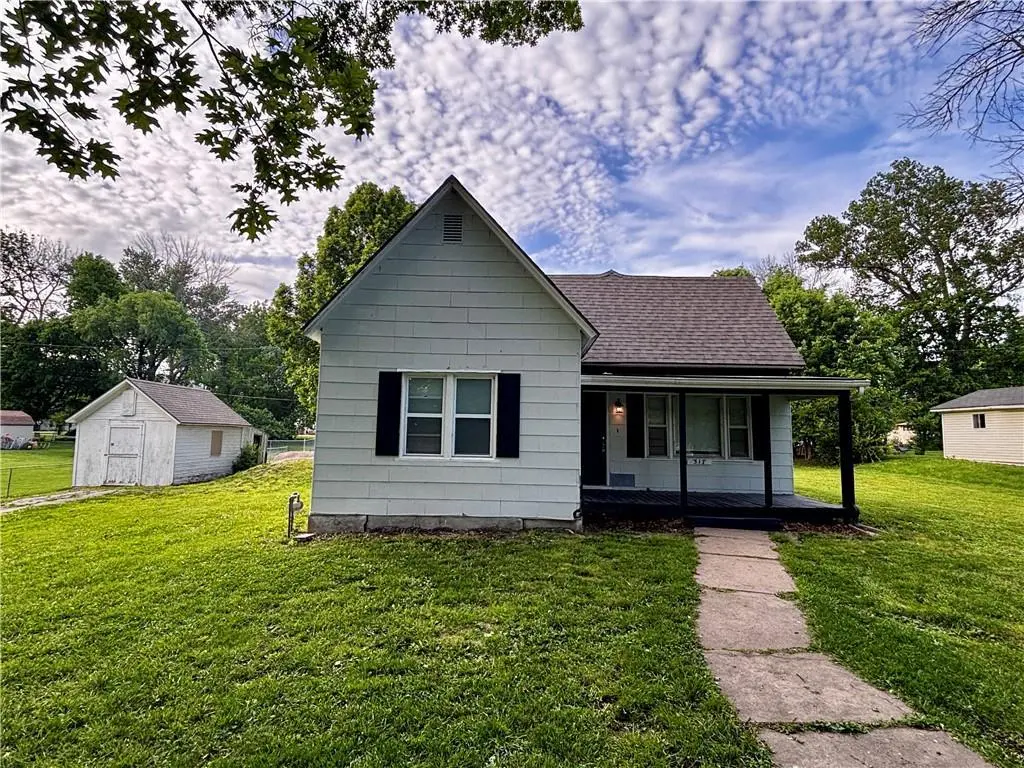
317 E Pine St · Drexel, MO
Flood risk 1/10 · Minimal
- FEMA flood zone
- X (unshaded)
- Chance of flooding over 30 yrs
- 0.0%
- Est. flood insurance / yr
- $507 – $1,088
Fire risk 2/10 · Minimal
- Est. fire insurance / yr
- $1,054 – $1,958
Heat risk 4/10 · Minor
- Hot days now (above 108°F)
- 7 days/yr
- Hot days in 30 yrs
- 17 days/yr
Wind risk 2/10 · Minimal
- Chance of severe wind over 30 yrs
- —
Air-quality risk 2/10 · Minimal
- Unhealthy air days now
- 2 days/yr
- Unhealthy air days in 30 yrs
- 2 days/yr
Risk factors via First Street. Map © Google.
Why this score? — see what drove the D grade
The composite is a weighted blend of 9 inputs, each scored 0–100. Each bar is that input's sub-score; the figure is the points it added to the 100-point composite (weight × sub-score).
- ARV discount +15.0/15.0
- Cash flow +11.2/30.0
- DSCR +3.3/10.0
- Schools +3.1/10.0
- Livability +2.7/5.0
- Rent growth +2.5/5.0
- Condition / age +2.5/5.0
- 1% rule +2.4/10.0
- Appreciation +0.0/10.0
$149,900
🖨 Deal sheet 📄 Offer letter ✓ Due diligence
Listing remarks
Welcome home to this charming, move-in ready 3-bedroom, 1-bath bungalow in the heart of Drexel! Situated on a spacious double lot, this property offers the perfect blend of character, updates, and outdoor space. Inside, you’ll love the beautifully refinished hardwood floors that add warmth and timeless appeal throughout. The home has been thoughtfully updated with fresh interior and exterior paint and a new roof, giving you peace of mind and a clean, modern feel. The layout is cozy yet functional, featuring three comfortable bedrooms, a full bath, and abundant natural light throughout the main living spaces. Step outside to enjoy the expansive yard—ideal for gardening, entertain
Key facts
- 0.34 acre lot
- Built 1910
- Listed 34 days
Property features AI
Finance
- Other: Lot approximately 99' x 152' (14,985 sq ft); Above-grade finished area reported from public records
- HOA & community: No association fees; No community maintenance provided
Exterior
- Parking: Off-street parking
- Utilities: Public water; Public sewer
- Home design: Single-family residence; Residential property; 1.5-story floor plan; Approximately 101+ years old
- Construction: Asbestos construction materials; Composition roof
- Exterior features: Front porch; Shed(s) on property; Located inside city limits; City lot with paved road access (public maintenance)
Interior
- Kitchen: Microwave; Refrigerator; Free-standing electric oven
- Bedrooms: 3 bedrooms (two on main level, one on upper level)
- Flooring: Carpet; Luxury vinyl; Wood
- Bathrooms: 1 full bathroom (main level)
- Heating & cooling: Natural gas heating with forced air; Electric cooling
- Interior features: Ceiling fans; Painted cabinets; Crawl space basement
- Laundry & utility: Main-level laundry room; Electric dryer hookup
Neighborhood map
What this means for you Summary
Snapshot
- This is a 3-bed/1.0-bath single-family listed at $150k.
Deal economics
- At list price, monthly cash flow is $-59 ($-706/yr) — negative.
- To cash-flow at today's rent, offer at most $140k (6.9% below list).
- To meet the 1% rule (rent ≥ 1% of price), the offer needs to be $111k (26.1% below list).
- Recommended offer: $111k (26.1% below list) — sets the bar for 1% rule.
Location & tenants
- Location reads 53/100 on livability (#822 in MO) — a working-class tenant base; expect higher turnover. Strengths: cost of living A+, housing B; Watch: employment D+, schools F, crime F.
- Drexel R-IV (rural): math 25% / reading 40% proficiency, ranked #412 of 535 in MO (top 77%) — families likely to look elsewhere, expect single-tenant / working-renter base with shorter leases.
- Market conditions: 33 active listings in the ZIP; 588 units permitted in Cass County in 2024 (0 in 5+ unit buildings).
Forward outlook
- Local home prices are declining (-3.0%/yr); year-one equity from $1k of loan paydown is wiped out by about $4k of value loss. Plan a longer hold.
- Cass County population projected to shrink 3% by 2050 — rents likely to lag national; underwrite the cash flow, not the appreciation.
Negotiation context
- It's been on market 35 days — a 3% lower offer ($145k) is reasonable based on typical stale-listing flexibility.
Risks & watch-outs
- Watch-outs: built in 1910 — expect roof / HVAC / electrical / plumbing capex.
Questions for the listing agent
- What do current leases actually rent for vs. the listed asking? Can we see a recent rent roll and the last 12 months of T-12 income?
- It's been on market 35 days. Have you received any prior offers? Is the seller open to a 26% concession, seller financing, or rate buy-down credit?
- Built in 1910 — when were the roof, HVAC, electrical panel, plumbing, and water heater last replaced?
- Is there a deadline driving the sale (1031 exchange, divorce, estate, relocation)? That informs how much negotiation room exists.
- Schools are F-rated, which usually means shorter tenancies and higher turnover. Who's the typical renter profile here, and what's been the actual vacancy rate?
- Crime grade is F in this area — have there been break-ins, vandalism, or insurance claims at this property in the last 3 years? What carrier currently insures it and at what premium?
- The area grade is low — what's the realistic commute time and amenity access for the typical tenant pool here? Any planned neighborhood developments (good or bad) we should know about?
- What's the average days-on-market for RENTAL listings here right now (not sales)? A rising rental-DOM trend means longer vacancies and softer asking-rent achievability than the comps imply.
- What's the recent tenant-quality profile in this submarket — average credit score on applications, eviction rate, late-payment / NSF rate, and stable-employment percentage? A property-management company in the area should have these aggregated.
- How much new for-sale + rental construction is in the pipeline within 1–3 miles? Heavy new supply typically softens prices + rents 12–24 months out; constrained supply supports both.
Investment metrics
- 1% rule
- 0.74% ✗
- Cap rate
- 5.82%
- Cash-on-cash
- -1.68%
- DSCR
- 0.93
- GRM
- 11.3
CMA / ARV
- ARV (median comp)
- $180,216
- List price
- $149,900
- Delta
- -16.82%
- Verdict
- UNDERPRICED
- Comps
- 20 within 1.0 mi
Show comp detail 12 sales within ~0.75 mi
| Address | Dist | Beds/Ba | Sqft | Sold | Price | $/sf | Match |
|---|---|---|---|---|---|---|---|
| 402 N 3rd St | 0.08mi | 3/1.5 | 1,238 (+5%) | 7mo | $115,000 | $93 | 80 |
| 221 S 3rd St | 0.26mi | 4/2.0 (+1) | 1,154 (-2%) | 1mo | $275,000 | $238 | 74 |
| 445 E Hickory St | 0.30mi | 3/1.0 | 1,092 (-7%) | 2mo | $228,000 | $209 | 72 |
| 444 E Ash St | 0.23mi | 3/1.0 | 1,056 (-10%) | 1mo | $250,000 | $237 | 71 |
| 414 Wisteria Ln | 0.36mi | 3/2.0 | 1,146 (-3%) | 8mo | $298,000 | $260 | 68 |
| 325 E Hickory St | 0.26mi | 3/1.5 | 1,346 (+14%) | 2mo | $239,000 | $178 | 60 |
| 120 S 3rd St | 0.22mi | 3/2.0 | 1,032 (-12%) | 7mo | $164,900 | $160 | 59 |
| 441 E Bates St | 0.31mi | 3/1.5 | 1,334 (+13%) | 10mo | $249,000 | $187 | 54 |
| 213 E Bates St | 0.29mi | 2/1.0 (-1) | 1,043 (-12%) | 12mo | $194,900 | $187 | 53 |
| E Willetta St | 0.40mi | 3/2.0 | 1,345 (+14%) | 13mo | $295,000 | $219 | 43 |
| 119 N State St. St | 0.33mi | 3/2.0 | 1,345 (+14%) | 19mo | $274,900 | $204 | 41 |
| 312 E Frazier St | 0.42mi | 3/2.0 | 1,350 (+15%) | 18mo | $299,900 | $222 | 37 |
Match score weights: distance 35% · size 25% · config 20% · recency 20%. Top-matched comps best support the ARV.
Projected returns pro-forma
-3.0% appreciation · 3.0% rent growth · sell at horizon
- IRR
- -19.1%
- Equity multiple
- 0.33×
- Total profit
- $-28,084
- Equity at exit
- $22,351
- IRR
- -11.8%
- Equity multiple
- 0.30×
- Total profit
- $-29,469
- Equity at exit
- $12,961
Cash invested: $41,972 (down + closing). Projections, not guarantees.
Landlord ↔ Tenant lean methodology
- Overall (STATE)
- 81 Strongly Landlord-Friendly
- State Missouri
- 81 Strongly Landlord-Friendly · R+10
- County
- — inherits STATE
- City
- — inherits STATE
ZIP-level market 64742
- Home prices YoY
- -11.0%
- Active inventory
- 33
- Price-to-rent
- 11.3×
Monthly cashflow live
- Estimated rent
- $1,107 medium interval (Pro) →
- Mortgage (P&I)
- −$786
- Tax from tax record
- −$85 /mo · $1,022/yr
- Insurance
- −$62
- HOA
- −$0
- Vacancy / Maint / Mgmt
- −$233
- Net cashflow
- $-59
Break-even live
UW: 25.0% down · 7.5% · 30yr · 1.5% tax · 5.0% vac · 8.0% maint · 8.0% mgmt
Financing live
Cash to close
- Down payment
- $37,475
- Closing costs
- $4,497
- Reserves months
- —
- Total cash needed
- —
Loan-product check · same deal, 3 products live
Conventional
25% down · 7.5% · 30yr
- Down + closing
- —
- Monthly P&I
- —
- Monthly cashflow
- —
- DSCR
- —
- Eligible?
- —
Personal DTI + credit; lowest rate.
DSCR
20% down · 8.5% · 30yr
- Down + closing
- —
- Monthly P&I
- —
- Monthly cashflow
- —
- DSCR
- —
- Eligible?
- —
No personal income docs; deal must DSCR.
Hard money
10% down · 12.0% · 12mo
- Down + closing
- —
- Monthly P&I
- —
- Monthly cashflow
- —
- DSCR
- —
- Eligible?
- —
Short-term bridge; refi at stabilization.
Listing history 16 events
-
2026-06-18days on market $149,900 Active 35 DOM
-
2026-06-17days on market $149,900 Active 34 DOM
-
2026-06-16days on market $149,900 Active 33 DOM
-
2026-06-15days on market $149,900 Active 32 DOM
-
2026-06-13days on market $149,900 Active 30 DOM
-
2026-06-12pricedays on market $149,900 Active 29 DOM
-
2026-06-09days on market $159,900 Active 26 DOM
-
2026-06-08days on market $159,900 Active 25 DOM
-
2026-06-07pricedays on market $159,900 Active 24 DOM
-
2026-06-05days on market $169,900 Active 22 DOM
-
2026-06-04days on market $169,900 Active 20 DOM
-
2026-06-02days on market $169,900 Active 19 DOM
-
2026-06-01days on market $169,900 Active 18 DOM
-
2026-05-31days on market $169,900 Active 17 DOM
-
2026-05-15$179,900 Active 1214-char remark
-
2026-05-15historical $179,900 1214-char remark
ⓘ Source: listings_history table (triggers on properties + properties_extension) + one-shot
backfill from property_details.listing_events for pre-trigger history.
Tax reassessment forecast MO · Resets to sale price
- Current annual tax
- $1,022 · $85/mo
- Projected year-2 tax
- $1,454 · $121/mo
- Expected delta
- +$432/yr (+$36/mo · 42.3%)
ⓘ Screening estimate from a state-policy table — verify with the county assessor before closing.
Climate risk First Street
- Flood 1/10 Low FEMA zone X (unshaded) · 0% chance over 30 yrs
- Wildfire 2/10 Low
- Heat 4/10 Moderate 7 d/yr ≥108°F today · 17 d/yr by 30 yrs out
- Wind 2/10 Low
- Air quality 2/10 Low 2 unhealthy d/yr today · 2 by 30 yrs out
Nearby sold comps map
Loading sold comps map…
Walkable amenities ~0.75 mi
Loading nearby amenities…
Taxation est. · year 1
- Rental income
- $13,289
- − Mortgage interest
- −$8,397
- − Property taxes
- −$1,022
- − Insurance
- −$750
- − Repairs & maintenance
- −$1,063
- − Management
- −$1,063
- − Depreciation
- −$4,361
- Taxable loss
- −$3,366
- Est. tax savings @ 24.0%
- +$808
- After-tax cash flow
- $102/yr
For passive investors: Depreciation is non-cash, so a rental often shows a tax loss while cash-flowing — sheltering income. Rental losses are passive: they offset passive income freely, and up to $25,000/yr can offset ordinary (W-2) income if you actively participate and your MAGI is under $100k (phasing out to $0 by $150k); unused losses carry forward. On sale, claimed depreciation is recaptured at up to 25%, and gains may owe capital-gains tax (a 1031 exchange can defer both). Figures are a year-1 estimate at your 24.0% rate — not tax advice; consult a CPA.
Schools (NCES district)
- District
- Drexel R-IV
- NCES district ID
- 2911070
- Math proficiency
- 25% ▼ -5.00%
- Reading proficiency
- 40% ▬ 0.00%
- Median HH income
- $49,749
- Composite
- 30.96/100
- National rank
- #11331
- State rank
- #412 of 535 in MO
Livability — Drexel
- Score
- 53/100
- State rank
- #822
- US rank
- #24458
Category grades
Schools grade is shown separately in the Schools card above.
Census & demographics
- Census place
- Drexel, MO
- Population (ZIP)
- 2,348
Population outlook (Cass County) Hauer SSP2
- Today (2025)
- 105,292 people
- By 2030
- 106,109 · +0.8%
- By 2040
- 105,786 · +0.5%
- By 2050
- 102,062 · -3.1%
- By 2075
- 88,569 · -15.9%
- By 2100
- 68,293 · -35.1%
Race, ethnicity, and origin ACS 2023
- Neighborhood character
- Predominantly White (93%)
- Race & ethnicity
- White 93% Two or more races 5% Hispanic / Latino 3%
- Common ancestry
- Slovak 2% Iranian 2% Italian 1%
- Foreign-born
- 1%
- Languages at home
- 99% English-only · French/Haitian/Cajun 1%
Political lean MEDSL · Cass
- 2024 margin
- Solid R (+32.1) · D 33.3% · R 65.4% · Other 1.3%
- 2008→2024 swing
- -12.5pp toward R · 2008: -19.6pp · 2024: -32.1pp
- All cycles
- 2024: R+32.1 2020: R+31.6 2016: R+35.9 2012: R+28.4 2008: R+19.6
Not yet ingested
- Civics
- —
Market trends
- HPI YoY
- ▼ -26.68%
- Current HPI
- 215.8936
- Rent YoY
- —
- Metro
- —
- State GDP YoY
- ▲ 1.84%
- F500 in state
- 20
Industry mix (Fortune 500 HQ in MO)
| Industry | F500 HQs | Revenue |
|---|---|---|
| Healthcare | 1 | $163B |
|
||
| Insurance | 1 | $21B |
|
||
| Industrial Technology | 1 | $17B |
|
||
| Retail | 1 | $16B |
|
||
| Industrial Distribution | 1 | $10B |
|
||
| Utilities | 1 | $9B |
|
||
Price history
-16.7% since first listed5 events — show timeline
- 2026-06-12 Price Changed $149,900 Heartland MLS as Distributed by MLS Grid
- 2026-06-05 Price Changed $159,900 Heartland MLS as Distributed by MLS Grid
- 2026-05-27 Price Changed $169,900 Heartland MLS as Distributed by MLS Grid
- 2026-05-15 Listed $179,900 Heartland MLS as Distributed by MLS Grid
- 2026-05-15 Coming Soon $179,900 Heartland MLS as Distributed by MLS Grid
Property tax history
+5.8%/yrLatest (2025): $1,022 · +99.2% YoY. Source: county tax records.
Cash-flow waterfall
monthlySold comps — $/sqft
last 12 mo · ≤1 miLoading sold comps…