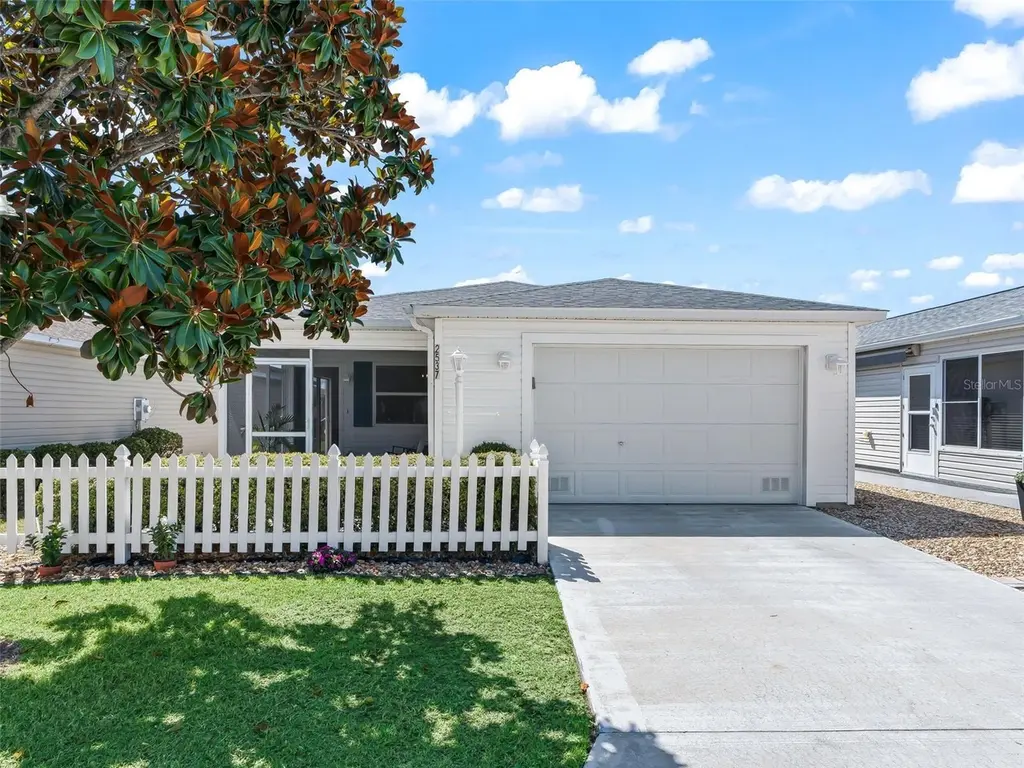
2537 Birch Ave · The Villages, FL
Flood risk 1/10 · Minimal
- FEMA flood zone
- X (unshaded)
- Chance of flooding over 30 yrs
- 0.0%
- Est. flood insurance / yr
- $507 – $1,088
Fire risk 4/10 · Minor
- Est. fire insurance / yr
- $947 – $1,759
Heat risk 9/10 · Severe
- Hot days now (above 108°F)
- 7 days/yr
- Hot days in 30 yrs
- 23 days/yr
Wind risk 9/10 · Severe
- Chance of severe wind over 30 yrs
- 99.0%
Air-quality risk 3/10 · Minor
- Unhealthy air days now
- 2 days/yr
- Unhealthy air days in 30 yrs
- 3 days/yr
Risk factors via First Street. Map © Google.
Why this score? — see what drove the F grade
The composite is a weighted blend of 9 inputs, each scored 0–100. Each bar is that input's sub-score; the figure is the points it added to the 100-point composite (weight × sub-score).
- Cash flow +12.3/30.0
- Schools +5.2/10.0
- DSCR +3.6/10.0
- Rent growth +3.5/5.0
- Livability +3.5/5.0
- 1% rule +3.1/10.0
- Condition / age +2.5/5.0
- ARV discount +0.0/15.0
- Appreciation +0.0/10.0
$325,000
🖨 Deal sheet (PDF) 📄 Offer letter ✓ Due diligence
Listing remarks
Under contract-accepting backup offers. COMPLETELY RENOVATED and move-in ready! This beautifully Remolded 2-bedroom, 2-bath home has been redone from floor to ceiling with quality finishes throughout. Enjoy peace of mind with a BRAND NEW ROOF, AC, and WATER HEATER—all completed in 2026. Beautiful LUXURY VINYL PLANK flooring runs seamlessly throughout the home, offering both style and durability with easy maintenance. Modern knock-down ceilings add a clean, updated finish with no popcorn ceilings in sight. The beautifully renovated kitchen features Corian countertops, brand new soft-closing cabinets, stainless steel appliances, extra cabinetry for added storage, and plenty of counter s
Key facts
- New water heater
- Renovated kitchen
- New ac
Tags
Property features AI
Finance
- Other: CDD present
- HOA & community: Senior community; Pets allowed
Exterior
- Parking: Attached garage with 1 garage space
- Utilities: Public water; Public sewer; Cable connected; Electricity connected
- Home design: Villa (residential); One story; Faces west; Situated on approximately 0.08 acre
- Construction: Vinyl siding; Shingle roof; Slab foundation; Built area approximately 1,627 square feet
- Exterior features: Paved road access; Irrigation equipment; Community pool; Golf course access; Deed-restricted community; Golf carts allowed
Interior
- Kitchen: Dishwasher; Disposal; Refrigerator
- Bedrooms: 2 bedrooms
- Flooring: Laminate
- Bathrooms: 2 full bathrooms
- Heating & cooling: Central heating; Central air conditioning
- Interior features: Ceiling fans
- Laundry & utility: Washer; Dryer; Laundry located in the kitchen
Neighborhood map
What this means for you Summary
Snapshot
- This is a 2-bed/2.0-bath single-family listed at $325k.
Deal economics
- At list price, monthly cash flow is $-62 ($-745/yr) — negative.
- To cash-flow at today's rent, offer at most $314k (3.4% below list).
- To meet the 1% rule (rent ≥ 1% of price), the offer needs to be $263k (19.0% below list).
- Recommended offer: $263k (19.0% below list) — sets the bar for 1% rule.
- Cap rate 6.1% vs local median 5.0% in The Villages — meaningfully above typical; check what's discounted (condition, days-on-market, listing class) to confirm the premium yield is real.
Location & tenants
- Location reads 70/100 on livability (#431 in FL) — a middle-class / working-renter tenant base. Strengths: crime A+, housing A, employment B+; Watch: amenities F, commute F, health & safety F.
- Sumter (rural): math 61% / reading 61% proficiency, ranked #11 of 73 in FL (top 15%) — acceptable for families but not a draw, mixed tenant base, ~2y average lease.
- Zoned schools: Wildwood Elementary School (math 49% / reading 52%, grade D+, #1,055 of 2,144 statewide, top 50%, 940 students, 76% FRL); South Sumter Middle School (math 55% / reading 54%, grade B-, #183 of 571 statewide, top 34%, 897 students, 61% FRL) — zoned schools average 68% FRL vs 51% district-wide (18 pts higher); higher-poverty schools than district average — tighter screening recommended.
- Market conditions: Rents rising (+3.9%/yr); 551 active listings in the ZIP; 9 comparable units currently listed for rent nearby; rentals at typical pace (median 23d on market — plan ~3-4 weeks tenant-placement turnaround); 3,961 units permitted in Sumter County in 2024 (248 in 5+ unit buildings).
- This rent runs 43% of the median local income ($74k/yr) — at the standard rent-burdened threshold; future hikes will face affordability resistance.
Forward outlook
- Local home prices are declining (-3.0%/yr); year-one equity from $2k of loan paydown is wiped out by about $10k of value loss. Plan a longer hold.
- Sumter County population projected at +45% by 2050 — long-run rental-demand tailwind backs the buy-and-hold thesis.
Negotiation context
- Only 14 days on market — expect competitive offers; lowballing is unlikely to land.
- Current owner paid $202k; list at $325k implies a 61% gain — meaningful room to come down on a strong offer.
Risks & watch-outs
- Climate carrying-cost: severe wind risk, 99% chance of damaging wind over 30y; extreme-heat days projected 7→23/yr by 2055 (HVAC capex compounding) — expect insurance premiums to compound above CPI over the hold.
Questions for the listing agent
- What do current leases actually rent for vs. the listed asking? Can we see a recent rent roll and the last 12 months of T-12 income?
- Is there a deadline driving the sale (1031 exchange, divorce, estate, relocation)? That informs how much negotiation room exists.
- Schools are A-rated — typically a magnet for longer-tenancy family renters. What's the average tenant stay here, and is there a school-zone premium baked into asking?
- The area grade is low — what's the realistic commute time and amenity access for the typical tenant pool here? Any planned neighborhood developments (good or bad) we should know about?
- What's the average days-on-market for RENTAL listings here right now (not sales)? A rising rental-DOM trend means longer vacancies and softer asking-rent achievability than the comps imply.
- What's the recent tenant-quality profile in this submarket — average credit score on applications, eviction rate, late-payment / NSF rate, and stable-employment percentage? A property-management company in the area should have these aggregated.
- How much new for-sale + rental construction is in the pipeline within 1–3 miles? Heavy new supply typically softens prices + rents 12–24 months out; constrained supply supports both.
Investment metrics
- 1% rule
- 0.81% ✗
- Cap rate
- 6.06%
- Cash-on-cash
- -0.82%
- DSCR
- 0.96
- GRM
- 10.3
CMA / ARV
- ARV (on-the-fly)
- $278,596
- Comps found
- 12
Show comp detail 12 sales within ~0.75 mi
| Address | Dist | Beds/Ba | Sqft | Sold | Price | $/sf | Match |
|---|---|---|---|---|---|---|---|
| 1358 Hollyberry Pl | 0.10mi | 2/2.0 | 1,156 (0%) | 3mo | $280,000 | $242 | 92 |
| 2507 Everwood Ct | 0.06mi | 2/2.0 | 1,188 (+3%) | 3mo | $305,000 | $257 | 90 |
| 2543 Raintree Dr | 0.06mi | 2/2.0 | 1,100 (-5%) | 1mo | $285,500 | $260 | 88 |
| 2376 Branchville Ter | 0.25mi | 2/2.0 | 1,156 (0%) | 1mo | $250,000 | $216 | 88 |
| 2369 Travis Pl | 0.27mi | 2/2.0 | 1,156 (0%) | 4mo | $235,000 | $203 | 84 |
| 2672 Sandhill Ct | 0.35mi | 2/2.0 | 1,156 (0%) | 2mo | $260,000 | $225 | 82 |
| 2371 Camden Ter | 0.21mi | 2/2.0 | 1,182 (+2%) | 5mo | $285,000 | $241 | 82 |
| 2677 English Ivy Cir | 0.20mi | 3/2.0 (+1) | 1,240 (+7%) | 1mo | $299,900 | $242 | 72 |
| 1814 Hallandale Ln | 0.69mi | 2/2.0 | 1,156 (0%) | 1mo | $280,000 | $242 | 67 |
| 1808 Hallandale Ln | 0.69mi | 2/2.0 | 1,156 (0%) | 1mo | $275,000 | $238 | 67 |
| 1858 Endsley Ct | 0.74mi | 2/2.0 | 1,156 (0%) | 1mo | $270,000 | $234 | 65 |
| 1380 Tallowtree Dr | 0.33mi | 3/2.0 (+1) | 1,240 (+7%) | 7mo | $245,000 | $198 | 62 |
Match score weights: distance 35% · size 25% · config 20% · recency 20%. Top-matched comps best support the ARV.
Projected returns pro-forma
-3.0% appreciation · 3.92% rent growth · sell at horizon
- IRR
- -16.7%
- Equity multiple
- 0.40×
- Total profit
- $-54,184
- Equity at exit
- $48,459
- IRR
- -7.0%
- Equity multiple
- 0.54×
- Total profit
- $-42,098
- Equity at exit
- $28,100
Cash invested: $91,000 (down + closing). Projections, not guarantees.
Landlord ↔ Tenant lean methodology
- Overall (STATE)
- 87 Strongly Landlord-Friendly
- State Florida
- 87 Strongly Landlord-Friendly · R+3
- County
- — inherits STATE
- City
- — inherits STATE
ZIP-level market 32162
- Home prices YoY
- -6.9%
- Rents YoY
- 3.9%
- Active inventory
- 551
- Price-to-rent
- 10.3×
Monthly cashflow live
- Estimated rent
- $2,631 high interval (Pro) →
- Mortgage (P&I)
- −$1,704
- Tax from tax record
- −$301 /mo · $3,612/yr
- Insurance
- −$135
- HOA
- −$0
- Vacancy / Maint / Mgmt
- −$553
- Net cashflow
- $-62
Break-even live
Sensitivity live
| Price | -10% $122 | -5% $30 | +0% $-62 | +5% $-154 | +10% $-246 |
|---|---|---|---|---|---|
| Rent | -10% $-270 | -5% $-166 | +0% $-62 | +5% $42 | +10% $146 |
| Rate | -1.0pp $102 | -0.5pp $21 | base $-62 | +0.5pp $-146 | +1.0pp $-232 |
UW: 25.0% down · 7.5% · 30yr · 1.5% tax · 5.0% vac · 8.0% maint · 8.0% mgmt
Financing live
Cash to close
- Down payment
- $81,250
- Closing costs
- $9,750
- Reserves months
- —
- Total cash needed
- —
Loan-product check · same deal, 3 products live
Conventional
25% down · 7.5% · 30yr
- Down + closing
- —
- Monthly P&I
- —
- Monthly cashflow
- —
- DSCR
- —
- Eligible?
- —
Personal DTI + credit; lowest rate.
DSCR
20% down · 8.5% · 30yr
- Down + closing
- —
- Monthly P&I
- —
- Monthly cashflow
- —
- DSCR
- —
- Eligible?
- —
No personal income docs; deal must DSCR.
Hard money
10% down · 12.0% · 12mo
- Down + closing
- —
- Monthly P&I
- —
- Monthly cashflow
- —
- DSCR
- —
- Eligible?
- —
Short-term bridge; refi at stabilization.
Rent comps 9 comps
| Address | Beds | Baths | Sqft | Rent | $/sqft | DOM | Units | Dist |
|---|---|---|---|---|---|---|---|---|
| 2383 Camden Ter The Villages, FL | 2.0 | 2.0 | 1182 | $2,500 | $2.12 | 23d | 1 | 0.22mi |
| 2372 Travis Pl The Villages, FL | 2.0 | 2.0 | 1188 | $2,000 | $1.68 | 23d | 1 | 0.30mi |
| 2368 McClellanville Ter The Villages, FL | 2.0 | 2.0 | 1142 | $4,800 | $4.20 | 23d | 1 | 0.40mi |
| 1607 Allendale Pl The Villages, FL | 2.0 | 2.0 | 1156 | $2,800 | $2.42 | 23d | 1 | 0.45mi |
| 2014 Johnson Ct The Villages, FL | 2.0 | 2.0 | 1156 | $2,000 | $1.73 | 23d | 1 | 0.99mi |
| 7730 Wilds Loop Wildwood, FL | 3.0 | 1.0–2.0 | 1084 | $2,054 | $1.89 | 23d | 28 | 1.17mi |
| 2290 Nackman Pl The Villages, FL | 3.0 | 2.0 | 1427 | $3,800 | $2.66 | 23d | 1 | 1.26mi |
| 2272 Vassar Ln The Villages, FL | 3.0 | 2.0 | 1416 | $2,500 | $1.77 | 23d | 1 | 1.29mi |
| 2280 Biscayne Ave The Villages, FL | 3.0 | 2.0 | 1400 | $4,000 | $2.86 | 23d | 1 | 1.33mi |
Listing history 6 events
-
2026-05-30remarks 693-char remark
-
2026-05-30statusdays on market $325,000 Pending 14 DOM
-
2026-05-16$325,000 Active
-
2025-11-20soldstatus $202,000
-
2012-04-12soldstatus $128,500
-
2010-04-07soldstatus $131,000
ⓘ Source: listings_history table (triggers on properties + properties_extension) + one-shot
backfill from property_details.listing_events for pre-trigger history.
Tax reassessment forecast FL · Resets to sale price
- Current annual tax
- $3,612 · $301/mo
- Projected year-2 tax
- $3,612 · $301/mo
- Expected delta
- $0/yr ($0/mo · 0.0%)
ⓘ Screening estimate from a state-policy table — verify with the county assessor before closing.
Climate risk First Street
- Flood 1/10 Low FEMA zone X (unshaded) · 0% chance over 30 yrs
- Wildfire 4/10 Moderate
- Heat 9/10 Extreme 7 d/yr ≥108°F today · 23 d/yr by 30 yrs out
- Wind 9/10 Extreme 99% chance of damaging wind over 30 yrs
- Air quality 3/10 Moderate 2 unhealthy d/yr today · 3 by 30 yrs out
Nearby sold comps map
Loading sold comps map…
Walkable amenities ~0.75 mi
Loading nearby amenities…
Taxation est. · year 1
- Rental income
- $31,575
- − Mortgage interest
- −$18,205
- − Property taxes
- −$3,612
- − Insurance
- −$1,625
- − Repairs & maintenance
- −$2,526
- − Management
- −$2,526
- − Depreciation
- −$9,455
- Taxable loss
- −$6,374
- Est. tax savings @ 24.0%
- +$1,530
- After-tax cash flow
- $785/yr
For passive investors: Depreciation is non-cash, so a rental often shows a tax loss while cash-flowing — sheltering income. Rental losses are passive: they offset passive income freely, and up to $25,000/yr can offset ordinary (W-2) income if you actively participate and your MAGI is under $100k (phasing out to $0 by $150k); unused losses carry forward. On sale, claimed depreciation is recaptured at up to 25%, and gains may owe capital-gains tax (a 1031 exchange can defer both). Figures are a year-1 estimate at your 24.0% rate — not tax advice; consult a CPA.
Schools (NCES district)
- District
- Sumter
- NCES district ID
- 1201800
- Math proficiency
- 61% ▼ -4.00%
- Reading proficiency
- 61% ▼ -2.00%
- Median HH income
- $48,240
- Composite
- 51.74/100
- National rank
- #1682
- State rank
- #11 of 73 in FL
Livability — The Villages
- Score
- 70/100
- State rank
- #431
- US rank
- #7363
Category grades
Schools grade is shown separately in the Schools card above.
Census & demographics
- Census place
- The Villages, FL
- County
- Sumter County · 110,591 people
- City population
- 83,973
- Metro
- The Villages, FL
- Population (ZIP)
- 55,424
- Household income
- $74,119
- Rent vs Own
- Severe rent burden
- 987.0
Population outlook (Sumter County) Hauer SSP2
- Today (2025)
- 161,172 people
- By 2030
- 180,083 · +11.7%
- By 2040
- 209,892 · +30.2%
- By 2050
- 234,186 · +45.3%
- By 2075
- 284,602 · +76.6%
- By 2100
- 317,039 · +96.7%
Race, ethnicity, and origin ACS 2023
- Neighborhood character
- Predominantly White (95%)
- Race & ethnicity
- White 95% Two or more races 2% Hispanic / Latino 2% Asian 1% Black 1%
- Common ancestry
- Romanian 7% Slovak 4% Lithuanian 4%
- Foreign-born
- 5% · Canada
- Languages at home
- 96% English-only · Spanish 1% Tagalog/Filipino 1%
Political lean MEDSL · Sumter
- 2024 margin
- Solid R (+37.6) · D 30.9% · R 68.6%
- 2008→2024 swing
- -10.6pp toward R · 2008: -27.0pp · 2024: -37.6pp
- All cycles
- 2024: R+37.6 2020: R+36.1 2016: R+39.2 2012: R+34.9 2008: R+27.0
Not yet ingested
- Civics
- —
Market trends
- HPI YoY
- ▼ -16.16%
- Current HPI
- 218.1956
- Rent YoY
- ▲ 3.92%
- Metro
- The Villages, FL
- State GDP YoY
- ▲ 3.28%
- F500 in state
- 36
Industry mix (Fortune 500 HQ in FL)
| Industry | F500 HQs | Revenue |
|---|---|---|
| Industrial Technology | 2 | $29B |
|
||
| Insurance | 2 | $17B |
|
||
| Retail | 1 | $60B |
|
||
| Technology Distribution | 1 | $58B |
|
||
| Homebuilding | 1 | $35B |
|
||
| Technology Manufacturing | 1 | $35B |
|
||
Price history
+148.1% since first listed4 events — show timeline
- 2026-05-16 Listed $325,000 Stellar MLS as Distributed by MLS Grid
- 2025-11-20 Sold (Public Records) $202,000 Public Records
- 2012-04-12 Sold (Public Records) $128,500 Public Records
- 2010-04-07 Sold (Public Records) $131,000 Public Records
Property tax history
+5.1%/yrLatest (2025): $3,612 · +2.3% YoY. Source: county tax records.
Cash-flow waterfall
monthlySold comps — $/sqft
last 12 mo · ≤1 miLoading sold comps…