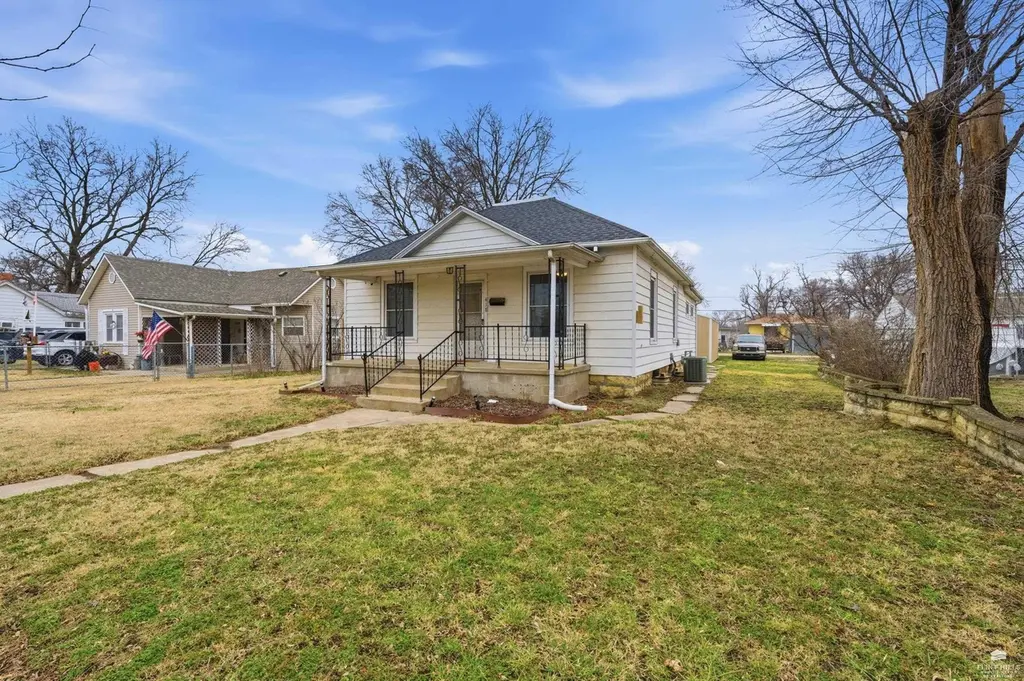
418 W 11th St · Junction City, KS
Flood risk 1/10 · Minimal
- FEMA flood zone
- X (unshaded)
- Chance of flooding over 30 yrs
- 0.0%
- Est. flood insurance / yr
- $473 – $860
Fire risk 5/10 · Moderate
- Est. fire insurance / yr
- $1,154 – $2,142
Heat risk 4/10 · Minor
- Hot days now (above 107°F)
- 7 days/yr
- Hot days in 30 yrs
- 16 days/yr
Wind risk 2/10 · Minimal
- Chance of severe wind over 30 yrs
- —
Air-quality risk 3/10 · Minor
- Unhealthy air days now
- 2 days/yr
- Unhealthy air days in 30 yrs
- 3 days/yr
Risk factors via First Street. Map © Google.
Why this score? — see what drove the D grade
The composite is a weighted blend of 9 inputs, each scored 0–100. Each bar is that input's sub-score; the figure is the points it added to the 100-point composite (weight × sub-score).
- Cash flow +12.5/30.0
- ARV discount +7.5/15.0
- Rent growth +4.0/5.0
- 1% rule +3.7/10.0
- DSCR +3.7/10.0
- Livability +3.3/5.0
- Schools +3.0/10.0
- Condition / age +2.5/5.0
- Appreciation +0.0/10.0
$135,000
🖨 Deal sheet 📄 Offer letter ✓ Due diligence
Key facts
- 8,321 sq ft lot
- 4 garage spots
- Built 1920
Property features AI
Exterior
- Parking: Detached garage with 4 garage spaces; Additional garage structures on property
- Utilities: Public water; Public sewer
- Home design: Single-family residence; Residential property
- Construction: Vinyl siding; Asphalt roof; Built area includes above-grade finished living space
- Exterior features: Patio; Concrete road access; No pool
Interior
- Kitchen: Dishwasher; Microwave; Oven; Range; Refrigerator
- Bedrooms: Two main-level bedrooms
- Bathrooms: One full bathroom
- Heating & cooling: Natural gas forced-air heating; Central air conditioning; Ceiling fans
- Interior features: Pantry; Ceiling fans
- Laundry & utility: Washer; Dryer; Basement present
Neighborhood map
What this means for you Summary
Snapshot
- This is a 2-bed/1.0-bath single-family listed at $135k.
Deal economics
- At list price, monthly cash flow is $-20 ($-244/yr) — negative.
- To cash-flow at today's rent, offer at most $131k (2.7% below list).
- To meet the 1% rule (rent ≥ 1% of price), the offer needs to be $118k (12.7% below list).
- Recommended offer: $118k (12.7% below list) — sets the bar for 1% rule.
Location & tenants
- Location reads 66/100 on livability (#266 in KS) — a middle-class / working-renter tenant base. Strengths: cost of living A+, housing A+, health & safety A+; Watch: schools D+, crime F, amenities F.
- Geary County Schools (town): math 32% / reading 39% proficiency, ranked #60 of 169 in KS (top 36%) — families likely to look elsewhere, expect single-tenant / working-renter base with shorter leases.
- Market conditions: Rents rising fast (+6.0%/yr); 260 active listings in the ZIP; 93 units permitted in Geary County in 2024 (0 in 5+ unit buildings).
Forward outlook
- Local home prices are declining (-3.0%/yr); year-one equity from $933 of loan paydown is wiped out by about $4k of value loss. Plan a longer hold.
- Geary County population projected at +8% by 2050 — modest demand growth; plan on rents tracking national, not racing it.
Negotiation context
- Only 4 days on market — expect competitive offers; lowballing is unlikely to land.
- 3 sale attempts since 5y ago with the ask held roughly flat each time — persistent listings suggest the price (not the market) is what's stuck; bring a comps-based counter.
Risks & watch-outs
- Watch-outs: built in 1920 — expect roof / HVAC / electrical / plumbing capex.
- Climate carrying-cost: moderate wildfire risk — expect insurance premiums to compound above CPI over the hold.
Questions for the listing agent
- What do current leases actually rent for vs. the listed asking? Can we see a recent rent roll and the last 12 months of T-12 income?
- Built in 1920 — when were the roof, HVAC, electrical panel, plumbing, and water heater last replaced?
- Is there a deadline driving the sale (1031 exchange, divorce, estate, relocation)? That informs how much negotiation room exists.
- Schools are D-rated, which usually means shorter tenancies and higher turnover. Who's the typical renter profile here, and what's been the actual vacancy rate?
- Crime grade is F in this area — have there been break-ins, vandalism, or insurance claims at this property in the last 3 years? What carrier currently insures it and at what premium?
- The area grade is low — what's the realistic commute time and amenity access for the typical tenant pool here? Any planned neighborhood developments (good or bad) we should know about?
- What's the average days-on-market for RENTAL listings here right now (not sales)? A rising rental-DOM trend means longer vacancies and softer asking-rent achievability than the comps imply.
- What's the recent tenant-quality profile in this submarket — average credit score on applications, eviction rate, late-payment / NSF rate, and stable-employment percentage? A property-management company in the area should have these aggregated.
- How much new for-sale + rental construction is in the pipeline within 1–3 miles? Heavy new supply typically softens prices + rents 12–24 months out; constrained supply supports both.
Investment metrics
- 1% rule
- 0.87% ✗
- Cap rate
- 6.11%
- Cash-on-cash
- -0.64%
- DSCR
- 0.97
- GRM
- 9.5
CMA / ARV
No comps found within radius.
Projected returns pro-forma
-3.0% appreciation · 6.05% rent growth · sell at horizon
- IRR
- -13.9%
- Equity multiple
- 0.49×
- Total profit
- $-19,412
- Equity at exit
- $20,129
- IRR
- -0.7%
- Equity multiple
- 0.94×
- Total profit
- $-2,166
- Equity at exit
- $11,672
Cash invested: $37,800 (down + closing). Projections, not guarantees.
Landlord ↔ Tenant lean methodology
- Overall (STATE)
- 83 Strongly Landlord-Friendly
- State Kansas
- 83 Strongly Landlord-Friendly · R+10
- County
- — inherits STATE
- City
- — inherits STATE
ZIP-level market 66441
- Rents YoY
- 6.0%
- Active inventory
- 260
- Price-to-rent
- 9.5×
Monthly cashflow live
- Estimated rent
- $1,179 medium interval (Pro) →
- Mortgage (P&I)
- −$708
- Tax from tax record
- −$187 /mo · $2,247/yr
- Insurance
- −$56
- HOA
- −$0
- Vacancy / Maint / Mgmt
- −$248
- Net cashflow
- $-20
Break-even live
UW: 25.0% down · 7.5% · 30yr · 1.5% tax · 5.0% vac · 8.0% maint · 8.0% mgmt
Financing live
Cash to close
- Down payment
- $33,750
- Closing costs
- $4,050
- Reserves months
- —
- Total cash needed
- —
Loan-product check · same deal, 3 products live
Conventional
25% down · 7.5% · 30yr
- Down + closing
- —
- Monthly P&I
- —
- Monthly cashflow
- —
- DSCR
- —
- Eligible?
- —
Personal DTI + credit; lowest rate.
DSCR
20% down · 8.5% · 30yr
- Down + closing
- —
- Monthly P&I
- —
- Monthly cashflow
- —
- DSCR
- —
- Eligible?
- —
No personal income docs; deal must DSCR.
Hard money
10% down · 12.0% · 12mo
- Down + closing
- —
- Monthly P&I
- —
- Monthly cashflow
- —
- DSCR
- —
- Eligible?
- —
Short-term bridge; refi at stabilization.
Listing history 13 events
-
2026-04-14status Pending
-
2026-04-03$135,000 Active
-
2024-06-01price $129,999
-
2024-06-01price $129,999
-
2024-02-10price $134,900
-
2024-02-08price $134,900
-
2024-02-01price $137,000
-
2023-04-18soldstatus Closed
-
2023-03-09status Pending
-
2023-03-07price $125,000
-
2023-02-07$130,000 Active
-
2022-02-18soldstatus
-
2021-11-10$89,000
ⓘ Source: listings_history table (triggers on properties + properties_extension) + one-shot
backfill from property_details.listing_events for pre-trigger history.
Tax reassessment forecast KS · Resets to sale price
- Current annual tax
- $2,247 · $187/mo
- Projected year-2 tax
- $2,247 · $187/mo
- Expected delta
- $0/yr ($0/mo · 0.0%)
ⓘ Screening estimate from a state-policy table — verify with the county assessor before closing.
Climate risk First Street
- Flood 1/10 Low FEMA zone X (unshaded) · 0% chance over 30 yrs
- Wildfire 5/10 Major
- Heat 4/10 Moderate 7 d/yr ≥107°F today · 16 d/yr by 30 yrs out
- Wind 2/10 Low
- Air quality 3/10 Moderate 2 unhealthy d/yr today · 3 by 30 yrs out
Nearby sold comps map
Loading sold comps map…
Walkable amenities ~0.75 mi
Loading nearby amenities…
Taxation est. · year 1
- Rental income
- $14,144
- − Mortgage interest
- −$7,562
- − Property taxes
- −$2,247
- − Insurance
- −$675
- − Repairs & maintenance
- −$1,132
- − Management
- −$1,132
- − Depreciation
- −$3,927
- Taxable loss
- −$2,530
- Est. tax savings @ 24.0%
- +$607
- After-tax cash flow
- $364/yr
For passive investors: Depreciation is non-cash, so a rental often shows a tax loss while cash-flowing — sheltering income. Rental losses are passive: they offset passive income freely, and up to $25,000/yr can offset ordinary (W-2) income if you actively participate and your MAGI is under $100k (phasing out to $0 by $150k); unused losses carry forward. On sale, claimed depreciation is recaptured at up to 25%, and gains may owe capital-gains tax (a 1031 exchange can defer both). Figures are a year-1 estimate at your 24.0% rate — not tax advice; consult a CPA.
Schools (NCES district)
- District
- Geary County Schools
- NCES district ID
- 2007890
- Math proficiency
- 32% ▲ 1.00%
- Reading proficiency
- 39% ▲ 2.00%
- Median HH income
- $44,319
- Composite
- 30.2/100
- National rank
- #6306
- State rank
- #60 of 169 in KS
Livability — Junction City
- Score
- 66/100
- State rank
- #266
- US rank
- #11965
Category grades
Schools grade is shown separately in the Schools card above.
Census & demographics
- Census place
- Junction City, KS
- County
- Geary County · 25,828 people
- City population
- 25,828
- Metro
- Manhattan, KS
- Population (ZIP)
- 25,828
- Household income
- $59,522
- Rent vs Own
- Severe rent burden
- 950.0
Population outlook (Geary County) Hauer SSP2
- Today (2025)
- 37,364 people
- By 2030
- 38,234 · +2.3%
- By 2040
- 39,727 · +6.3%
- By 2050
- 40,314 · +7.9%
- By 2075
- 44,283 · +18.5%
- By 2100
- 46,935 · +25.6%
Race, ethnicity, and origin ACS 2023
- Neighborhood character
- Diverse neighborhood (Simpson 0.66)
- Race & ethnicity
- White 53% Black 19% Two or more races 15% Hispanic / Latino 15% Asian 3%
- Hispanic origin (detail)
- Mexican 8% Puerto Rican 4%
- Common ancestry
- Lithuanian 3% Italian 2% Portuguese 2%
- Foreign-born
- 8% · Canada, South Korea, Vietnam
- Languages at home
- 85% English-only · Spanish 9% German/W. Germanic 1% Korean 1%
Political lean MEDSL · Geary
- 2024 margin
- R (+17.6) · D 40.1% · R 57.7% · Other 2.2%
- 2008→2024 swing
- -5.2pp toward R · 2008: -12.4pp · 2024: -17.6pp
- All cycles
- 2024: R+17.6 2020: R+14.7 2016: R+21.7 2012: R+14.4 2008: R+12.4
Not yet ingested
- Civics
- —
Market trends
- HPI YoY
- ▼ -152.25%
- Current HPI
- 137.9936
- Rent YoY
- ▲ 6.05%
- Metro
- Manhattan, KS
- State GDP YoY
- —
- F500 in state
- 0
Price history
+51.7% since first listed13 events — show timeline
- 2026-04-14 Pending — FHAOR as distributed by MLS GRID
- 2026-04-03 Listed $135,000 FHAOR as distributed by MLS GRID
- 2024-06-01 Price Changed $129,999 Sunflower MLS as distributed by MLS GRID
- 2024-06-01 Price Changed $129,999 FHAOR as distributed by MLS GRID
- 2024-02-10 Price Changed $134,900 Sunflower MLS as distributed by MLS GRID
- 2024-02-08 Price Changed $134,900 FHAOR as distributed by MLS GRID
- 2024-02-01 Price Changed $137,000 FHAOR as distributed by MLS GRID
- 2023-04-18 Sold (MLS) — FHAOR as distributed by MLS GRID
- 2023-03-09 Pending — FHAOR as distributed by MLS GRID
- 2023-03-07 Price Changed $125,000 FHAOR as distributed by MLS GRID
- 2023-02-07 Listed $130,000 FHAOR as distributed by MLS GRID
- 2022-02-18 Sold (MLS) — FHAOR as distributed by MLS GRID
- 2021-11-10 Listed $89,000 FHAOR as distributed by MLS GRID
Property tax history
+5.5%/yrLatest (2025): $2,247 · +8.7% YoY. Source: county tax records.
Cash-flow waterfall
monthlySold comps — $/sqft
last 12 mo · ≤1 miLoading sold comps…