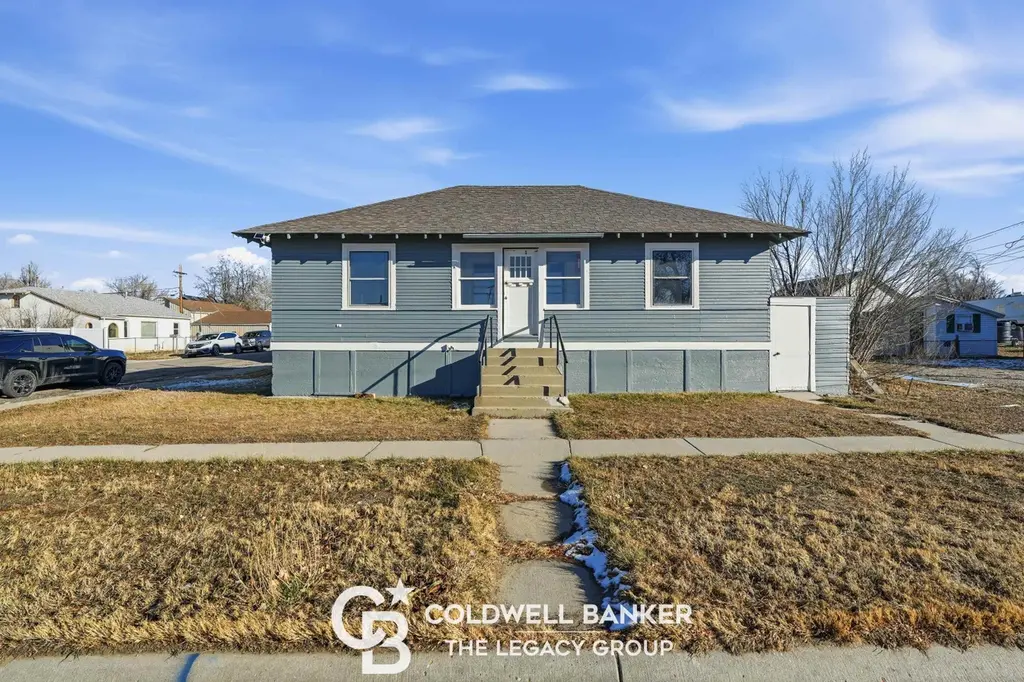
241 N Mckinley St · Casper, WY
Flood risk 1/10 · Minimal
- FEMA flood zone
- X (unshaded)
- Chance of flooding over 30 yrs
- 0.0%
- Est. flood insurance / yr
- $473 – $860
Fire risk 6/10 · Moderate
- Est. fire insurance / yr
- $564 – $1,046
Heat risk 3/10 · Minor
- Hot days now (above 91°F)
- 6 days/yr
- Hot days in 30 yrs
- 17 days/yr
Wind risk 1/10 · Minimal
- Chance of severe wind over 30 yrs
- —
Air-quality risk 2/10 · Minimal
- Unhealthy air days now
- 1 days/yr
- Unhealthy air days in 30 yrs
- 1 days/yr
Risk factors via First Street. Map © Google.
Why this score? — see what drove the C grade
The composite is a weighted blend of 9 inputs, each scored 0–100. Each bar is that input's sub-score; the figure is the points it added to the 100-point composite (weight × sub-score).
- Cash flow +18.2/30.0
- ARV discount +15.0/15.0
- DSCR +5.7/10.0
- Rent growth +4.7/5.0
- Schools +4.2/10.0
- 1% rule +4.0/10.0
- Livability +3.9/5.0
- Condition / age +2.5/5.0
- Appreciation +0.0/10.0
$140,000
🖨 Deal sheet 📄 Offer letter ✓ Due diligence
Listing remarks MLS
This Property offers opportunities for rental growth through updates, improved management, and operational efficiencies. Units are currently vacant. This property provides flexibility for a wide range of buyers from first-time multi-family investors to those expanding an existing portfolio.
Key facts
- 3,920 sq ft lot
- Built 1923
- Listed 101 days
Neighborhood map
What this means for you Summary
Snapshot
- This is a 2-bed/2.0-bath single-family listed at $140k.
Deal economics
- At list price, monthly cash flow is $126 ($2k/yr) — positive.
- The deal already cash-flows at list — no discount required.
- To meet the 1% rule (rent ≥ 1% of price), the offer needs to be $126k (10.2% below list).
- Recommended offer: $126k (10.2% below list) — sets the bar for 1% rule.
- Cap rate 7.4% vs local median 3.0% in Casper — top-decile yield for the area; either an underpriced asset or a hidden risk that comps aren't pricing in. Stress-test before assuming the spread holds.
Location & tenants
- Location reads 78/100 on livability (#8 in WY, #2,629 nationally) — a middle-class / working-renter tenant base. Strengths: commute A+, cost of living A+, housing A+; Watch: amenities D, health & safety F.
- Natrona County School District #1 (urban): math 44% / reading 52% proficiency, ranked #32 of 41 in WY (top 78%) — families likely to look elsewhere, expect single-tenant / working-renter base with shorter leases.
- Market conditions: Rents rising fast (+9.0%/yr); 220 active listings in the ZIP; 310 units permitted in Natrona County in 2024 (104 in 5+ unit buildings).
Forward outlook
- Local home prices are declining (-3.0%/yr); year-one equity from $968 of loan paydown is wiped out by about $4k of value loss. Plan a longer hold.
- Natrona County population projected at +46% by 2050 — long-run rental-demand tailwind backs the buy-and-hold thesis.
- At projected returns (-3.0% appreciation + 8.0% rent growth), your $39k cash investment doubles in ~10 years — after that, you're playing with house money.
Negotiation context
- It's been on market 102 days — a 9% lower offer ($127k) is reasonable based on typical stale-listing flexibility.
- 3 sale attempts with the ask held roughly flat each time — persistent listings suggest the price (not the market) is what's stuck; bring a comps-based counter.
Risks & watch-outs
- Watch-outs: built in 1923 — expect roof / HVAC / electrical / plumbing capex.
- Climate carrying-cost: major wildfire risk — expect insurance premiums to compound above CPI over the hold.
Questions for the listing agent
- It's been on market 102 days. Have you received any prior offers? Is the seller open to a 10% concession, seller financing, or rate buy-down credit?
- Built in 1923 — when were the roof, HVAC, electrical panel, plumbing, and water heater last replaced?
- Why hasn't it sold? Are there any deal-killer items the seller is aware of (foundation, flood, title, zoning, code violations)?
- Is there a deadline driving the sale (1031 exchange, divorce, estate, relocation)? That informs how much negotiation room exists.
- What's the average days-on-market for RENTAL listings here right now (not sales)? A rising rental-DOM trend means longer vacancies and softer asking-rent achievability than the comps imply.
- What's the recent tenant-quality profile in this submarket — average credit score on applications, eviction rate, late-payment / NSF rate, and stable-employment percentage? A property-management company in the area should have these aggregated.
- How much new for-sale + rental construction is in the pipeline within 1–3 miles? Heavy new supply typically softens prices + rents 12–24 months out; constrained supply supports both.
Investment metrics
- 1% rule
- 0.90% ✗
- Cap rate
- 7.37%
- Cash-on-cash
- 3.85%
- DSCR
- 1.17
- GRM
- 9.3
CMA / ARV
- ARV (median comp)
- $259,701
- List price
- $140,000
- Delta
- -46.09%
- Verdict
- UNDERPRICED
- Comps
- 18 within 1.0 mi
Show comp detail 12 sales within ~0.75 mi
| Address | Dist | Beds/Ba | Sqft | Sold | Price | $/sf | Match |
|---|---|---|---|---|---|---|---|
| 246 S Jackson St | 0.31mi | 3/2.0 (+1) | 1,924 (-1%) | 9mo | $319,000 | $166 | 72 |
| 415 S Lincoln St | 0.43mi | 2/1.5 | 1,987 (+3%) | 6mo | $314,000 | $158 | 68 |
| 239 S Mckinley St | 0.30mi | 3/2.0 (+1) | 1,782 (-8%) | 2mo | $260,000 | $146 | 66 |
| 501 S Jackson St | 0.46mi | 2/2.0 | 1,844 (-5%) | 5mo | $185,000 | $100 | 66 |
| 919 E 5th | 0.48mi | 2/2.0 | 1,805 (-7%) | 8mo | $221,000 | $122 | 60 |
| 329 S Mckinley St | 0.36mi | 3/1.5 (+1) | 1,814 (-6%) | 9mo | $265,000 | $146 | 58 |
| 631 E 5th St | 0.53mi | 3/1.8 (+1) | 1,794 (-7%) | 0mo | $349,900 | $195 | 57 |
| 701 S Beech St | 0.74mi | 2/2.0 | 1,834 (-5%) | 3mo | $320,000 | $174 | 54 |
| 263 S Kenwood St | 0.54mi | 3/1.0 (+1) | 1,824 (-6%) | 4mo | $153,000 | $84 | 52 |
| 718 E 5th St | 0.48mi | 2/1.8 | 1,697 (-12%) | 6mo | $249,900 | $147 | 51 |
| 740 N Jefferson St | 0.43mi | 3/1.0 (+1) | 1,720 (-11%) | 4mo | $155,000 | $90 | 49 |
| 432 S Park St | 0.54mi | 3/2.0 (+1) | 2,204 (+14%) | 5mo | $315,000 | $143 | 43 |
Match score weights: distance 35% · size 25% · config 20% · recency 20%. Top-matched comps best support the ARV.
Projected returns pro-forma
-3.0% appreciation · 8.0% rent growth · sell at horizon
- IRR
- -5.3%
- Equity multiple
- 0.79×
- Total profit
- $-8,077
- Equity at exit
- $20,874
- IRR
- 9.2%
- Equity multiple
- 1.85×
- Total profit
- $33,352
- Equity at exit
- $12,105
Cash invested: $39,200 (down + closing). Projections, not guarantees.
Landlord ↔ Tenant lean methodology
- Overall (STATE)
- 90 Strongly Landlord-Friendly
- State Wyoming
- 90 Strongly Landlord-Friendly · R+25
- County
- — inherits STATE
- City
- — inherits STATE
ZIP-level market 82601
- Rents YoY
- 9.0%
- Active inventory
- 220
- Price-to-rent
- 9.3×
Monthly cashflow live
- Estimated rent
- $1,258 medium interval (Pro) →
- Mortgage (P&I)
- −$734
- Tax from tax record
- −$75 /mo · $903/yr
- Insurance
- −$58
- HOA
- −$0
- Vacancy / Maint / Mgmt
- −$264
- Net cashflow
- $126
Break-even live
UW: 25.0% down · 7.5% · 30yr · 1.5% tax · 5.0% vac · 8.0% maint · 8.0% mgmt
Financing live
Cash to close
- Down payment
- $35,000
- Closing costs
- $4,200
- Reserves months
- —
- Total cash needed
- —
Loan-product check · same deal, 3 products live
Conventional
25% down · 7.5% · 30yr
- Down + closing
- —
- Monthly P&I
- —
- Monthly cashflow
- —
- DSCR
- —
- Eligible?
- —
Personal DTI + credit; lowest rate.
DSCR
20% down · 8.5% · 30yr
- Down + closing
- —
- Monthly P&I
- —
- Monthly cashflow
- —
- DSCR
- —
- Eligible?
- —
No personal income docs; deal must DSCR.
Hard money
10% down · 12.0% · 12mo
- Down + closing
- —
- Monthly P&I
- —
- Monthly cashflow
- —
- DSCR
- —
- Eligible?
- —
Short-term bridge; refi at stabilization.
Listing history 20 events
-
2026-06-19days on market $140,000 Active 102 DOM
-
2026-06-18days on market $140,000 Active 101 DOM
-
2026-06-17days on market $140,000 Active 100 DOM
-
2026-06-17days on market $140,000 Active 99 DOM
-
2026-06-15days on market $140,000 Active 98 DOM
-
2026-06-14days on market $140,000 Active 96 DOM
-
2026-06-13days on market $140,000 Active 95 DOM
-
2026-06-10days on market $140,000 Active 93 DOM
-
2026-06-09days on market $140,000 Active 92 DOM
-
2026-06-08days on market $140,000 Active 91 DOM
-
2026-06-07days on market $140,000 Active 90 DOM
-
2026-06-05days on market $140,000 Active 87 DOM
-
2026-06-03days on market $140,000 Active 86 DOM
-
2026-06-02days on market $140,000 Active 85 DOM
-
2026-06-01days on market $140,000 Active 84 DOM
-
2026-05-31days on market $140,000 Active 83 DOM
-
2026-05-30days on market $140,000 Active 82 DOM
-
2026-03-09$140,000 Active 291-char remark
Show marketing remark (291 chars)
This Property offers opportunities for rental growth through updates, improved management, and operational efficiencies. Units are currently vacant. This property provides flexibility for a wide range of buyers from first-time multi-family investors to those expanding an existing portfolio.
-
2026-01-14$395,000 Active
-
2025-09-02$178,000 Active
ⓘ Source: listings_history table (triggers on properties + properties_extension) + one-shot
backfill from property_details.listing_events for pre-trigger history.
Tax reassessment forecast WY · Resets to sale price
- Current annual tax
- $903 · $75/mo
- Projected year-2 tax
- $903 · $75/mo
- Expected delta
- $0/yr ($0/mo · 0.0%)
ⓘ Screening estimate from a state-policy table — verify with the county assessor before closing.
Climate risk First Street
- Flood 1/10 Low FEMA zone X (unshaded) · 0% chance over 30 yrs
- Wildfire 6/10 Major
- Heat 3/10 Moderate 6 d/yr ≥91°F today · 17 d/yr by 30 yrs out
- Wind 1/10 Low
- Air quality 2/10 Low 1 unhealthy d/yr today · 1 by 30 yrs out
Nearby sold comps map
Loading sold comps map…
Walkable amenities ~0.75 mi
Loading nearby amenities…
Taxation est. · year 1
- Rental income
- $15,091
- − Mortgage interest
- −$7,842
- − Property taxes
- −$903
- − Insurance
- −$700
- − Repairs & maintenance
- −$1,207
- − Management
- −$1,207
- − Depreciation
- −$4,073
- Taxable loss
- −$842
- Est. tax savings @ 24.0%
- +$202
- After-tax cash flow
- $1,710/yr
For passive investors: Depreciation is non-cash, so a rental often shows a tax loss while cash-flowing — sheltering income. Rental losses are passive: they offset passive income freely, and up to $25,000/yr can offset ordinary (W-2) income if you actively participate and your MAGI is under $100k (phasing out to $0 by $150k); unused losses carry forward. On sale, claimed depreciation is recaptured at up to 25%, and gains may owe capital-gains tax (a 1031 exchange can defer both). Figures are a year-1 estimate at your 24.0% rate — not tax advice; consult a CPA.
Schools (NCES district)
- District
- Natrona County School District #1
- NCES district ID
- 5604510
- Math proficiency
- 44% ▼ -4.00%
- Reading proficiency
- 52% ▼ -2.00%
- Median HH income
- $55,217
- Composite
- 41.6/100
- National rank
- #3437
- State rank
- #32 of 41 in WY
Livability — Casper
- Score
- 78/100
- State rank
- #8
- US rank
- #2629
Category grades
Schools grade is shown separately in the Schools card above.
Census & demographics
- Census place
- Casper, WY
- County
- Natrona County · 72,922 people
- City population
- 72,922
- Metro
- Casper, WY
- Population (ZIP)
- 26,721
- Household income
- $67,642
- Rent vs Own
- Severe rent burden
- 749.0
Population outlook (Natrona County) Hauer SSP2
- Today (2025)
- 98,530 people
- By 2030
- 107,084 · +8.7%
- By 2040
- 124,838 · +26.7%
- By 2050
- 143,617 · +45.8%
- By 2075
- 192,378 · +95.2%
- By 2100
- 228,435 · +131.8%
Race, ethnicity, and origin ACS 2023
- Neighborhood character
- Predominantly White (84%)
- Race & ethnicity
- White 84% Hispanic / Latino 12% Two or more races 7%
- Hispanic origin (detail)
- Mexican 8%
- Common ancestry
- Slovak 4% Lithuanian 4% Portuguese 4%
- Foreign-born
- 3% · Canada
- Languages at home
- 94% English-only · Spanish 4%
Political lean MEDSL · Natrona
- 2024 margin
- Solid R (+48.6) · D 24.8% · R 73.5% · Other 1.7%
- 2008→2024 swing
- -14.3pp toward R · 2008: -34.4pp · 2024: -48.6pp
- All cycles
- 2024: R+48.6 2020: R+47.6 2016: R+52.2 2012: R+41.1 2008: R+34.4
Not yet ingested
- Civics
- —
Market trends
- HPI YoY
- ▼ -190.42%
- Current HPI
- 181.2192
- Rent YoY
- ▲ 8.97%
- Metro
- Casper, WY
- State GDP YoY
- —
- F500 in state
- 0
Price history
-21.3% since first listed3 events — show timeline
- 2026-03-09 Listed $140,000 WMLS
- 2026-01-14 Listed $395,000 WMLS
- 2025-09-02 Listed $178,000 WMLS
Property tax history
+4.8%/yrLatest (2025): $903 · -22.8% YoY. Source: county tax records.
Cash-flow waterfall
monthlySold comps — $/sqft
last 12 mo · ≤1 miLoading sold comps…