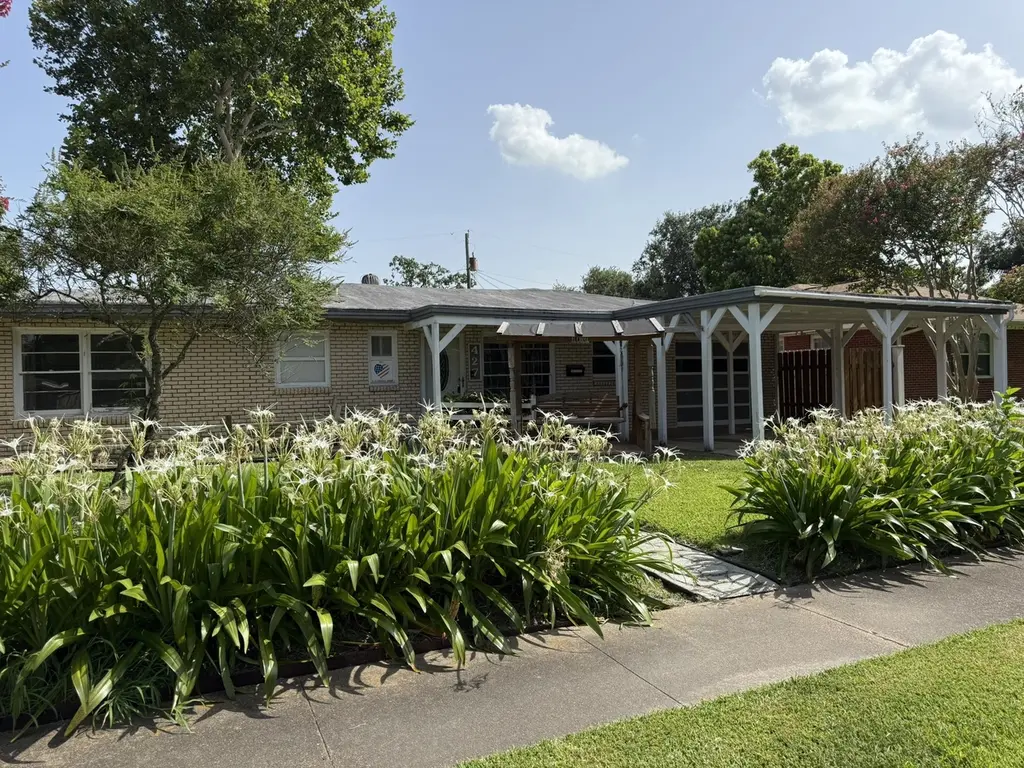
427 22nd Ave N · Texas City, TX
Flood risk 8/10 · Major
- FEMA flood zone
- X
- Chance of flooding over 30 yrs
- 0.6%
- Est. flood insurance / yr
- $507 – $1,088
Fire risk 3/10 · Minor
- Est. fire insurance / yr
- $1,222 – $2,270
Heat risk 10/10 · Severe
- Hot days now (above 108°F)
- 7 days/yr
- Hot days in 30 yrs
- 25 days/yr
Wind risk 10/10 · Severe
- Chance of severe wind over 30 yrs
- 99.0%
Air-quality risk 2/10 · Minimal
- Unhealthy air days now
- 2 days/yr
- Unhealthy air days in 30 yrs
- 2 days/yr
Risk factors via First Street. Map © Google.
Why this score? — see what drove the C- grade
The composite is a weighted blend of 9 inputs, each scored 0–100. Each bar is that input's sub-score; the figure is the points it added to the 100-point composite (weight × sub-score).
- ARV discount +15.0/15.0
- Cash flow +14.8/30.0
- 1% rule +4.7/10.0
- DSCR +4.5/10.0
- Rent growth +3.7/5.0
- Livability +3.1/5.0
- Condition / age +2.5/5.0
- Schools +2.4/10.0
- Appreciation +0.0/10.0
$209,000
🖨 Deal sheet 📄 Offer letter ✓ Due diligence
Listing remarks
Mid-Century Modern 4-bedroom, 2.5-bath home featuring a versatile game room and a generously sized yard. This classic property offers a great mix of character, space, and opportunity. The game room includes a cozy fireplace and wet bar—perfect for a home office, playroom, or additional living area. The 1-car garage provides ample shelving for storage, plus a covered carport for extra parking. Washer, dryer, refrigerator, and generator all convey with the home. With solid construction and great bones, it’s ready for your personal updates to truly make it shine. Enjoy the spacious outdoor area—ideal for entertaining, gardening, or relaxing in a peaceful setting. Conveniently
Key facts
- Wet bar
- Covered carport
- Cozy fireplace
Tags
Property features AI
Exterior
- Parking: Attached garage (2 spaces); Driveway
- Utilities: Public water; Public sewer; Electric with generator
- Home design: Residential property; Full ownership; Slab foundation; Built in 1954; Composition roof; Concrete road/access; Subdivision lot — 75x120
- Construction: Brick and wood siding construction
- Exterior features: Covered patio; Patio and deck; Fenced back yard; Storage shed
Interior
- Kitchen: Dishwasher; Electric oven; Electric range
- Bedrooms: Primary bedroom (First floor) — 14x13; Bedroom (First floor) — 11x11; Bedroom (First floor) — 11x10; Bedroom (First floor) — 10x9
- Flooring: Tile; Wood
- Bathrooms: 2 full bathrooms; 1 half bathroom; Primary bathroom — 10x10; Bathroom — 7x5; Bathroom — 6x4
- Heating & cooling: Central heating (Gas); Central air (Electric)
- Interior features: Wet bar; Kitchen/family room combo; Laminate counters; Primary bathroom; Tub with shower; Window treatments; Ceiling fans; Kitchen/dining combo; Wood-burning fireplace (1)
- Laundry & utility: Washer hookup; Electric dryer hookup; Utility room (First floor) — 10x5
Neighborhood map
What this means for you Summary
Snapshot
- This is a 4-bed/2.5-bath single-family listed at $209k.
Deal economics
- At list price, monthly cash flow is $-11 ($-127/yr) — negative.
- To cash-flow at today's rent, offer at most $207k (0.9% below list).
- To meet the 1% rule (rent ≥ 1% of price), the offer needs to be $202k (3.1% below list).
- Recommended offer: $202k (3.1% below list) — sets the bar for 1% rule.
- Cap rate 6.6% vs local median 4.3% in Texas City — top-decile yield for the area; either an underpriced asset or a hidden risk that comps aren't pricing in. Stress-test before assuming the spread holds.
Location & tenants
- Location reads 62/100 on livability (#907 in TX) — a middle-class / working-renter tenant base. Strengths: cost of living A+, housing A+; Watch: crime D+, amenities F, commute F.
- Texas City ISD (suburban): math 28% / reading 29% proficiency, ranked #655 of 826 in TX (top 79%) — low school quality limits family demand, transient renter base, plan for 1-2y turnover; 66% free/reduced lunch — lower-income household profile, screen leases tightly.
- Zoned schools: Roosevelt-Wilson El (math 36% / reading 34%, grade F, #1,965 of 4,322 statewide, top 46%, 492 students, 77% FRL); Blocker Middle (math 33% / reading 36%, grade F, #858 of 1,662 statewide, top 54%, 865 students, 80% FRL); Texas City H S (math 32% / reading 36%, grade F, #1,002 of 1,632 statewide, top 62%, 1,718 students, 72% FRL).
- Market conditions: Rents rising fast (+4.9%/yr); 292 active listings in the ZIP; 3 comparable units currently listed for rent nearby; rentals at typical pace (median 24d on market — plan ~3-4 weeks tenant-placement turnaround); 3,258 units permitted in Galveston County in 2024 (0 in 5+ unit buildings).
- This rent runs 37% of the median local income ($66k/yr) — at the standard rent-burdened threshold; future hikes will face affordability resistance.
Forward outlook
- Local home prices are declining (-3.0%/yr); year-one equity from $1k of loan paydown is wiped out by about $6k of value loss. Plan a longer hold.
- Galveston County population projected at +43% by 2050 — long-run rental-demand tailwind backs the buy-and-hold thesis.
Negotiation context
- It's been on market 40 days — a 3% lower offer ($203k) is reasonable based on typical stale-listing flexibility.
- 2 sale attempts with the ask held roughly flat each time — persistent listings suggest the price (not the market) is what's stuck; bring a comps-based counter.
Risks & watch-outs
- Watch-outs: flood insurance adds $66/mo; built in 1954 — expect roof / HVAC / electrical / plumbing capex.
- Climate carrying-cost: severe flood risk; severe wind risk, 99% chance of damaging wind over 30y; extreme-heat days projected 7→25/yr by 2055 (HVAC capex compounding) — expect insurance premiums to compound above CPI over the hold.
Questions for the listing agent
- What do current leases actually rent for vs. the listed asking? Can we see a recent rent roll and the last 12 months of T-12 income?
- It's been on market 40 days. Have you received any prior offers? Is the seller open to a 3% concession, seller financing, or rate buy-down credit?
- Built in 1954 — when were the roof, HVAC, electrical panel, plumbing, and water heater last replaced?
- What's the actual annual flood-insurance premium (NFIP or private), and is the property in a SFHA with mandatory coverage?
- Is there a deadline driving the sale (1031 exchange, divorce, estate, relocation)? That informs how much negotiation room exists.
- Schools are F-rated, which usually means shorter tenancies and higher turnover. Who's the typical renter profile here, and what's been the actual vacancy rate?
- Crime grade is D in this area — have there been break-ins, vandalism, or insurance claims at this property in the last 3 years? What carrier currently insures it and at what premium?
- What's the average days-on-market for RENTAL listings here right now (not sales)? A rising rental-DOM trend means longer vacancies and softer asking-rent achievability than the comps imply.
- What's the recent tenant-quality profile in this submarket — average credit score on applications, eviction rate, late-payment / NSF rate, and stable-employment percentage? A property-management company in the area should have these aggregated.
- How much new for-sale + rental construction is in the pipeline within 1–3 miles? Heavy new supply typically softens prices + rents 12–24 months out; constrained supply supports both.
Investment metrics
- 1% rule
- 0.97% ✗
- Cap rate
- 6.61%
- Cash-on-cash
- 1.15%
- DSCR
- 1.05
- GRM
- 8.6
CMA / ARV
- ARV (on-the-fly)
- $256,904
- Comps found
- 12
Show comp detail 12 sales within ~0.75 mi
| Address | Dist | Beds/Ba | Sqft | Sold | Price | $/sf | Match |
|---|---|---|---|---|---|---|---|
| 425 20th Ave N | 0.11mi | 4/2.0 | 1,978 (+5%) | 3mo | $279,999 | $142 | 82 |
| 629 18th Ave N | 0.30mi | 4/3.0 | 1,875 (-1%) | 5mo | $187,000 | $100 | 78 |
| 516 23rd Ave N | 0.10mi | 4/2.5 | 1,634 (-14%) | 0mo | $229,999 | $141 | 73 |
| 1939 1st St N | 0.37mi | 4/2.0 | 1,773 (-6%) | 8mo | $298,000 | $168 | 64 |
| 2435 9th St N | 0.45mi | 4/2.0 | 1,863 (-1%) | 16mo | $287,500 | $154 | 61 |
| 122 22nd Ave N | 0.23mi | 3/2.0 (-1) | 1,683 (-11%) | 11mo | $159,900 | $95 | 55 |
| 1222 Sunset Ln | 0.73mi | 3/2.0 (-1) | 1,875 (-1%) | 4mo | $264,999 | $141 | 54 |
| 924 22nd Ave N | 0.45mi | 3/2.0 (-1) | 1,987 (+5%) | 12mo | $240,000 | $121 | 54 |
| 125 21st Ave N | 0.29mi | 4/2.0 | 2,137 (+13%) | 13mo | $289,000 | $135 | 52 |
| 223 24th Ave N | 0.23mi | 3/2.0 (-1) | 1,611 (-15%) | 10mo | $219,900 | $136 | 49 |
| 620 White Ibis Ave | 0.52mi | 3/2.0 (-1) | 2,148 (+14%) | 0mo | $260,000 | $121 | 46 |
| 18 12th Ave N | 0.73mi | 3/2.0 (-1) | 1,834 (-3%) | 13mo | $199,800 | $109 | 44 |
Match score weights: distance 35% · size 25% · config 20% · recency 20%. Top-matched comps best support the ARV.
Projected returns pro-forma
-3.0% appreciation · 4.91% rent growth · sell at horizon
- IRR
- -14.2%
- Equity multiple
- 0.48×
- Total profit
- $-30,445
- Equity at exit
- $31,163
- IRR
- -2.3%
- Equity multiple
- 0.83×
- Total profit
- $-9,928
- Equity at exit
- $18,071
Cash invested: $58,520 (down + closing). Projections, not guarantees.
Landlord ↔ Tenant lean methodology
- Overall (STATE)
- 87 Strongly Landlord-Friendly
- State Texas
- 87 Strongly Landlord-Friendly · R+5
- County
- — inherits STATE
- City
- — inherits STATE
ZIP-level market 77590
- Home prices YoY
- -19.3%
- Rents YoY
- 4.9%
- Active inventory
- 292
- Price-to-rent
- 8.6×
Monthly cashflow live
- Estimated rent
- $2,024 medium interval (Pro) →
- Mortgage (P&I)
- −$1,096
- Tax from tax record
- −$360 /mo · $4,323/yr
- Insurance
- −$87
- Flood insurance flood zone
- −$66 /mo · $798/yr
- HOA
- −$0
- Vacancy / Maint / Mgmt
- −$425
- Net cashflow
- $-11
Break-even live
UW: 25.0% down · 7.5% · 30yr · 1.5% tax · 5.0% vac · 8.0% maint · 8.0% mgmt
Financing live
Cash to close
- Down payment
- $52,250
- Closing costs
- $6,270
- Reserves months
- —
- Total cash needed
- —
Loan-product check · same deal, 3 products live
Conventional
25% down · 7.5% · 30yr
- Down + closing
- —
- Monthly P&I
- —
- Monthly cashflow
- —
- DSCR
- —
- Eligible?
- —
Personal DTI + credit; lowest rate.
DSCR
20% down · 8.5% · 30yr
- Down + closing
- —
- Monthly P&I
- —
- Monthly cashflow
- —
- DSCR
- —
- Eligible?
- —
No personal income docs; deal must DSCR.
Hard money
10% down · 12.0% · 12mo
- Down + closing
- —
- Monthly P&I
- —
- Monthly cashflow
- —
- DSCR
- —
- Eligible?
- —
Short-term bridge; refi at stabilization.
Rent comps 3 comps
| Address | Beds | Baths | Sqft | Rent | $/sqft | DOM | Units | Dist |
|---|---|---|---|---|---|---|---|---|
| 625 26th Ave N Texas City, TX | 4.0 | 2.0 | 1782 | $1,945 | $1.09 | 43d | 1 | 0.33mi |
| 1139 Mainland Dr Texas City, TX | 3.0 | 2.0 | 2500 | $2,100 | $0.84 | 1d | 1 | 0.70mi |
| 1137 1st Ave N Texas City, TX | 5.0 | 2.0 | 1786 | $1,775 | $0.99 | 24d | 1 | 1.47mi |
Listing history 8 events
-
2026-05-10status Pending
-
2026-04-28status Pending
-
2026-03-30$209,000 Active
-
2026-03-28historical
-
2026-03-25price $209,000
-
2025-11-12price $219,000
-
2025-09-02price $229,000
-
2025-07-10$239,000 Active
ⓘ Source: listings_history table (triggers on properties + properties_extension) + one-shot
backfill from property_details.listing_events for pre-trigger history.
Tax reassessment forecast TX · Resets to sale price
- Current annual tax
- $4,323 · $360/mo
- Projected year-2 tax
- $4,323 · $360/mo
- Expected delta
- $0/yr ($0/mo · 0.0%)
ⓘ Screening estimate from a state-policy table — verify with the county assessor before closing.
Climate risk First Street
- Flood 8/10 Severe FEMA zone X · 60% chance over 30 yrs
- Wildfire 3/10 Moderate
- Heat 10/10 Extreme 7 d/yr ≥108°F today · 25 d/yr by 30 yrs out
- Wind 10/10 Extreme 99% chance of damaging wind over 30 yrs
- Air quality 2/10 Low 2 unhealthy d/yr today · 2 by 30 yrs out
Nearby sold comps map
Loading sold comps map…
Walkable amenities ~0.75 mi
Loading nearby amenities…
Taxation est. · year 1
- Rental income
- $24,291
- − Mortgage interest
- −$11,707
- − Property taxes
- −$4,323
- − Insurance
- −$1,842
- − Repairs & maintenance
- −$1,943
- − Management
- −$1,943
- − Depreciation
- −$6,080
- Taxable loss
- −$3,548
- Est. tax savings @ 24.0%
- +$851
- After-tax cash flow
- $724/yr
For passive investors: Depreciation is non-cash, so a rental often shows a tax loss while cash-flowing — sheltering income. Rental losses are passive: they offset passive income freely, and up to $25,000/yr can offset ordinary (W-2) income if you actively participate and your MAGI is under $100k (phasing out to $0 by $150k); unused losses carry forward. On sale, claimed depreciation is recaptured at up to 25%, and gains may owe capital-gains tax (a 1031 exchange can defer both). Figures are a year-1 estimate at your 24.0% rate — not tax advice; consult a CPA.
Schools (NCES district)
- District
- Texas City ISD
- NCES district ID
- 4842510
- Math proficiency
- 28% ▼ -10.00%
- Reading proficiency
- 29% ▼ -4.00%
- Median HH income
- $44,875
- Composite
- 24.47/100
- National rank
- #7664
- State rank
- #655 of 826 in TX
Livability — Texas City
- Score
- 62/100
- State rank
- #907
- US rank
- #16268
Category grades
Schools grade is shown separately in the Schools card above.
Census & demographics
- Census place
- Texas City, TX
- County
- Galveston County · 357,330 people
- City population
- 49,936
- Metro
- Houston-The Woodlands-Sugar Land, TX
- Population (ZIP)
- 31,642
- Household income
- $65,801
- Rent vs Own
- Severe rent burden
- 1821.0
Population outlook (Galveston County) Hauer SSP2
- Today (2025)
- 390,640 people
- By 2030
- 425,226 · +8.9%
- By 2040
- 493,765 · +26.4%
- By 2050
- 559,698 · +43.3%
- By 2075
- 719,260 · +84.1%
- By 2100
- 819,628 · +109.8%
Race, ethnicity, and origin ACS 2023
- Neighborhood character
- Diverse neighborhood (Simpson 0.66)
- Race & ethnicity
- White 41% Hispanic / Latino 38% Two or more races 20% Black 17% Asian 2%
- Hispanic origin (detail)
- Mexican 33% Puerto Rican 1%
- Common ancestry
- Lithuanian 2% Slovak 1% Italian 1%
- Foreign-born
- 9% · Canada, Vietnam
- Languages at home
- 72% English-only · Spanish 26% Other Indo-European 1%
Political lean MEDSL · Galveston
- 2024 margin
- Strong R (+27.4) · D 35.7% · R 63.1% · Other 1.2%
- 2008→2024 swing
- -7.9pp toward R · 2008: -19.5pp · 2024: -27.4pp
- All cycles
- 2024: R+27.4 2020: R+22.6 2016: R+22.6 2012: R+26.9 2008: R+19.5
Not yet ingested
- Civics
- —
Market trends
- HPI YoY
- ▼ -58.35%
- Current HPI
- 244.5809
- Rent YoY
- ▲ 4.91%
- Metro
- Houston-The Woodlands-Sugar Land, TX
- State GDP YoY
- ▲ 3.95%
- F500 in state
- 110
Industry mix (Fortune 500 HQ in TX)
| Industry | F500 HQs | Revenue |
|---|---|---|
| Energy | 16 | $1,198B |
|
||
| Technology | 5 | $198B |
|
||
| Engineering / Construction | 4 | $72B |
|
||
| Energy Services | 3 | $60B |
|
||
| Utilities | 3 | $41B |
|
||
| Healthcare | 2 | $330B |
|
||
Price history
-12.6% since first listed8 events — show timeline
- 2026-05-10 Pending — HARMLS
- 2026-04-28 Pending — HARMLS
- 2026-03-30 Listed $209,000 HARMLS
- 2026-03-28 Listing Removed — HARMLS
- 2026-03-25 Price Changed $209,000 HARMLS
- 2025-11-12 Price Changed $219,000 HARMLS
- 2025-09-02 Price Changed $229,000 HARMLS
- 2025-07-10 Listed $239,000 HARMLS
Property tax history
+5.9%/yrLatest (2025): $4,323 · +11.6% YoY. Source: county tax records.
Cash-flow waterfall
monthlySold comps — $/sqft
last 12 mo · ≤1 miLoading sold comps…