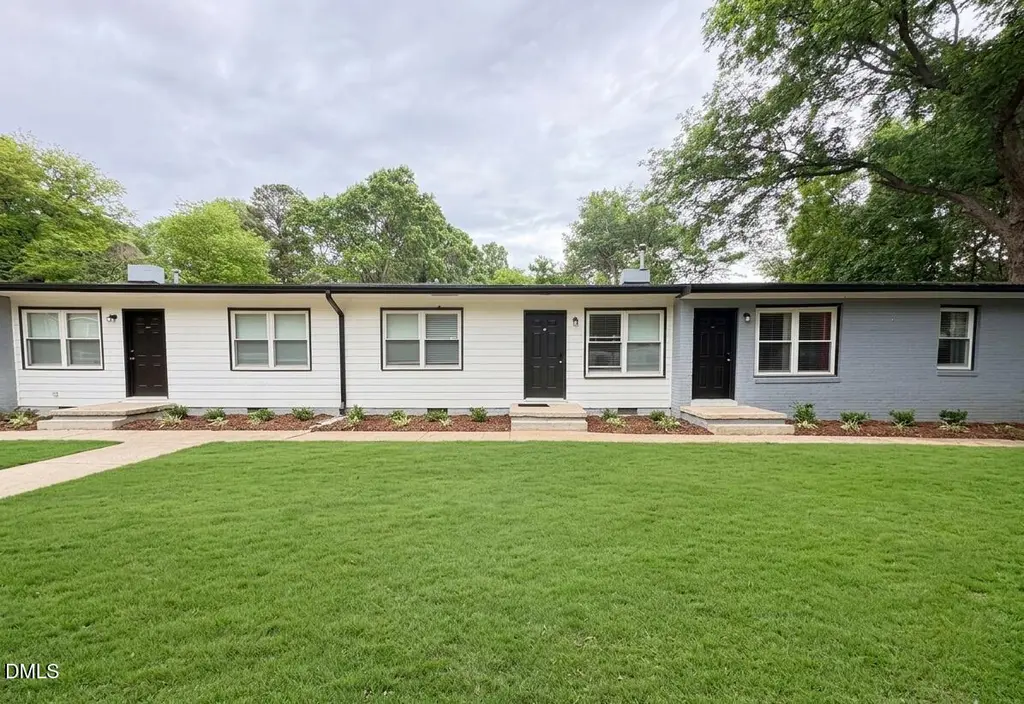
 Fourplex
None · Raleigh, NC
Flood risk 9/10 · Severe
- FEMA flood zone
- X (unshaded)
- Chance of flooding over 30 yrs
- 0.99%
- Est. flood insurance / yr
- $507 – $1,088
Fire risk 3/10 · Minor
- Est. fire insurance / yr
- $906 – $1,684
Heat risk 7/10 · Major
- Hot days now (above 105°F)
- 7 days/yr
- Hot days in 30 yrs
- 17 days/yr
Wind risk 6/10 · Moderate
- Chance of severe wind over 30 yrs
- 53.0%
Air-quality risk 2/10 · Minimal
- Unhealthy air days now
- 1 days/yr
- Unhealthy air days in 30 yrs
- 1 days/yr
Risk factors via First Street. Map © Google.
Why this score? — see what drove the C grade
The composite is a weighted blend of 9 inputs, each scored 0–100. Each bar is that input's sub-score; the figure is the points it added to the 100-point composite (weight × sub-score).
- Cash flow +21.5/30.0
- ARV discount +7.5/15.0
- DSCR +6.9/10.0
- Schools +4.9/10.0
- 1% rule +4.6/10.0
- Livability +4.2/5.0
- Rent growth +2.9/5.0
- Condition / age +2.5/5.0
- Appreciation +0.0/10.0
$660,000
🖨 Deal sheet 📄 Offer letter ✓ Due diligence
Multi-family units
County records classify this as Multi-Family (2-4 Unit). Listing-text estimate: 4 units. confirmed
Listing remarks MLS
R-10/NB ZONING (WEST HALF OF PROPERTY APPROVED FOR 4 ADDITIONAL UNITS AS PER CITY)(ZONING CASE Z90-98) Super investment property with great cash flow, All units currently rented, large lot . 87 ACRES!!! Tenants pay utilities/ separate meter
Key facts
- Spacious lot
- Outdoor space
- Updated kitchens
Tags
Property features AI
Finance
- Other: Annual tax amount available (not included per instructions)
- Financial info: 4 total units; Owner pays: None
- HOA & community: No association
Exterior
- Parking: Off-street parking; 4 open parking spaces
- Utilities: Public water; Public sewer
- Home design: Quadruplex; Single-story; One building
- Construction: Brick construction; Shingle roof; Slab foundation; Built area about 2,792 (above grade finished)
- Exterior features: Deck; Lot is approximately 0.87 acres; Publicly maintained road access
Interior
- Bedrooms: 8 bedrooms total
- Flooring: Luxury vinyl
- Bathrooms: 4 full bathrooms
- Heating & cooling: Forced air heating; Central air conditioning; Ceiling fans; Zoned cooling
- Interior features: Luxury vinyl flooring
Neighborhood map
What this means for you Summary
Snapshot
- This is a 4 × 2-bed/1.0-bath units multifamily listed at $660k.
Deal economics
- At list price, monthly cash flow is $929 ($11k/yr) — positive. Per door: $232/mo.
- The deal already cash-flows at list — no discount required.
- To meet the 1% rule (rent ≥ 1% of price), the offer needs to be $634k (4.0% below list).
- Recommended offer: $634k (4.0% below list) — sets the bar for 1% rule.
- Cap rate 8.1% vs local median 2.7% in Raleigh — top-decile yield for the area; either an underpriced asset or a hidden risk that comps aren't pricing in. Stress-test before assuming the spread holds.
Location & tenants
- Location reads 83/100 on livability (#10 in NC, #1,028 nationally) — a professional / high-income tenant draw. Strengths: amenities A+, commute A+, housing A+; Watch: crime F.
- Wake County Schools (suburban): math 52% / reading 60% proficiency, ranked #35 of 178 in NC (top 20%) — acceptable for families but not a draw, mixed tenant base, ~2y average lease.
- Market conditions: Rents rising (+1.6%/yr); 490 active listings in the ZIP; solid renter incomes; 15,249 units permitted in Wake County in 2024 (5,568 in 5+ unit buildings).
- At $6,337/mo this rent would consume 84% of the median local household income ($90k/yr) (locally 1914% of renters already pay >50% of income on rent) — very limited rent-growth headroom before tenants either downsize or default.
Forward outlook
- Local home prices are declining (-3.0%/yr); year-one equity from $5k of loan paydown is wiped out by about $20k of value loss. Plan a longer hold.
- Wake County population projected at +51% by 2050 — long-run rental-demand tailwind backs the buy-and-hold thesis.
Negotiation context
- It's been on market 31 days — a 3% lower offer ($640k) is reasonable based on typical stale-listing flexibility.
- 11 sale attempts since 16y ago with the ask held roughly flat each time — persistent listings suggest the price (not the market) is what's stuck; bring a comps-based counter.
- Current owner paid $213k; list at $660k implies a 210% gain — meaningful room to come down on a strong offer.
Risks & watch-outs
- Watch-outs: flood insurance adds $66/mo; built in 1952 — expect roof / HVAC / electrical / plumbing capex.
- Climate carrying-cost: severe flood risk; major wind risk, 53% chance of damaging wind over 30y; extreme-heat days projected 7→17/yr by 2055 (HVAC capex compounding) — expect insurance premiums to compound above CPI over the hold.
Questions for the listing agent
- It's been on market 31 days. Have you received any prior offers? Is the seller open to a 4% concession, seller financing, or rate buy-down credit?
- Can we see the unit-by-unit rent roll, current vacancy, and any below-market leases? What's the average tenancy length?
- What capital expenditures (roof, boiler, parking lot, exteriors) have been made in the last 5 years, and what's planned in the next 2?
- Built in 1952 — when were the roof, HVAC, electrical panel, plumbing, and water heater last replaced?
- What's the actual annual flood-insurance premium (NFIP or private), and is the property in a SFHA with mandatory coverage?
- Is there a deadline driving the sale (1031 exchange, divorce, estate, relocation)? That informs how much negotiation room exists.
- Schools are B-rated — typically a magnet for longer-tenancy family renters. What's the average tenant stay here, and is there a school-zone premium baked into asking?
- Crime grade is F in this area — have there been break-ins, vandalism, or insurance claims at this property in the last 3 years? What carrier currently insures it and at what premium?
- What's the average days-on-market for RENTAL listings here right now (not sales)? A rising rental-DOM trend means longer vacancies and softer asking-rent achievability than the comps imply.
- What's the recent tenant-quality profile in this submarket — average credit score on applications, eviction rate, late-payment / NSF rate, and stable-employment percentage? A property-management company in the area should have these aggregated.
- How much new apartment / multifamily construction is in the pipeline within 1–3 miles? Heavy new supply (>2% of stock underway) typically softens rents 12–24 months out; light construction supports rent growth.
Investment metrics
- 1% rule
- 0.96% ✗
- Cap rate
- 8.10%
- Cash-on-cash
- 6.47%
- DSCR
- 1.29
- GRM
- 8.7
CMA / ARV
No comps found within radius.
Projected returns pro-forma
-3.0% appreciation · 1.59% rent growth · sell at horizon
- IRR
- -8.5%
- Equity multiple
- 0.69×
- Total profit
- $-56,824
- Equity at exit
- $98,408
- IRR
- -0.8%
- Equity multiple
- 0.95×
- Total profit
- $-9,447
- Equity at exit
- $57,065
Cash invested: $184,800 (down + closing). Projections, not guarantees.
Landlord ↔ Tenant lean methodology
- Overall (STATE)
- 85 Strongly Landlord-Friendly
- State North Carolina
- 85 Strongly Landlord-Friendly · R+3
- County
- — inherits STATE
- City
- — inherits STATE
ZIP-level market 27603
- Rents YoY
- 1.6%
- Active inventory
- 490
- Price-to-rent
- 34.7×
Monthly cashflow live
- Estimated rent
- $6,337 high interval (Pro) →
- Mortgage (P&I)
- −$3,461
- Tax from tax record
- −$274 /mo · $3,291/yr
- Insurance
- −$275
- Flood insurance flood zone
- −$66 /mo · $798/yr
- HOA
- −$0
- Vacancy / Maint / Mgmt
- −$1,331
- Net cashflow
- $929
Break-even live
4-unit breakdown (identical units grouped — click to expand)
| Units | Beds | Baths | Est. rent |
|---|---|---|---|
| 4× units | 2 | 1 | $6,336 |
| #1 | 2 | 1 | $1,584 |
| #2 | 2 | 1 | $1,584 |
| #3 | 2 | 1 | $1,584 |
| #4 | 2 | 1 | $1,584 |
| Total (4 units) | $6,337 | ||
UW: 25.0% down · 7.5% · 30yr · 1.5% tax · 5.0% vac · 8.0% maint · 8.0% mgmt
Financing live
Cash to close
- Down payment
- $165,000
- Closing costs
- $19,800
- Reserves months
- —
- Total cash needed
- —
Loan-product check · same deal, 3 products live
Conventional
25% down · 7.5% · 30yr
- Down + closing
- —
- Monthly P&I
- —
- Monthly cashflow
- —
- DSCR
- —
- Eligible?
- —
Personal DTI + credit; lowest rate.
DSCR
20% down · 8.5% · 30yr
- Down + closing
- —
- Monthly P&I
- —
- Monthly cashflow
- —
- DSCR
- —
- Eligible?
- —
No personal income docs; deal must DSCR.
Hard money
10% down · 12.0% · 12mo
- Down + closing
- —
- Monthly P&I
- —
- Monthly cashflow
- —
- DSCR
- —
- Eligible?
- —
Short-term bridge; refi at stabilization.
Listing history 50 events
-
2026-06-18days on market $660,000 Active 31 DOM
-
2026-06-17days on market $660,000 Active 30 DOM
-
2026-06-16days on market $660,000 Active 29 DOM
-
2026-06-15days on market $660,000 Active 28 DOM
-
2026-06-13days on market $660,000 Active 26 DOM
-
2026-06-13days on market $660,000 Active 25 DOM
-
2026-06-09days on market $660,000 Active 22 DOM
-
2026-06-08days on market $660,000 Active 21 DOM
-
2026-06-07days on market $660,000 Active 20 DOM
-
2026-06-05days on market $660,000 Active 17 DOM
-
2026-06-03days on market $660,000 Active 16 DOM
-
2026-06-02days on market $660,000 Active 15 DOM
-
2026-06-01days on market $660,000 Active 14 DOM
-
2026-05-31days on market $660,000 Active 13 DOM
-
2026-05-18$660,000 Active
-
2025-12-10historical $990
-
2025-11-24historical $990
-
2025-11-08$990
-
2025-11-05historical $990
-
2025-10-22price $990
-
2025-10-22price $980
-
2025-09-20price $1,070
-
2025-09-20price $1,060
-
2025-09-10price $1,085
-
2025-09-10price $1,075
-
2025-09-10historical $1,095
-
2025-07-21price $1,095
-
2025-06-12$1,120
-
2025-05-24$1,125
-
2025-05-06historical $1,085
-
2025-05-04$1,085
-
2025-05-04historical $1,085
-
2025-04-26price $1,085
-
2025-04-26price $1,115
-
2025-03-17price $1,125
-
2025-03-17price $1,095
-
2025-02-20$1,185
-
2025-02-20$1,195
-
2025-02-20historical $1,185
-
2025-02-18$1,185
-
2013-04-04soldstatus $213,000 Closed 240-char remark
Show marketing remark (240 chars)
R-10/NB ZONING (WEST HALF OF PROPERTY APPROVED FOR 4 ADDITIONAL UNITS AS PER CITY)(ZONING CASE Z90-98) Super investment property with great cash flow, All units currently rented, large lot . 87 ACRES!!! Tenants pay utilities/ separate meter
-
2013-04-04soldstatus $213,000 240-char remark
Show marketing remark (240 chars)
R-10/NB ZONING (WEST HALF OF PROPERTY APPROVED FOR 4 ADDITIONAL UNITS AS PER CITY)(ZONING CASE Z90-98) Super investment property with great cash flow, All units currently rented, large lot . 87 ACRES!!! Tenants pay utilities/ separate meter
-
2013-04-04soldstatus $213,000
Show marketing remark (240 chars)
R-10/NB ZONING (WEST HALF OF PROPERTY APPROVED FOR 4 ADDITIONAL UNITS AS PER CITY)(ZONING CASE Z90-98) Super investment property with great cash flow, All units currently rented, large lot . 87 ACRES!!! Tenants pay utilities/ separate meter
-
2013-03-28status Pending 240-char remark
Show marketing remark (240 chars)
R-10/NB ZONING (WEST HALF OF PROPERTY APPROVED FOR 4 ADDITIONAL UNITS AS PER CITY)(ZONING CASE Z90-98) Super investment property with great cash flow, All units currently rented, large lot . 87 ACRES!!! Tenants pay utilities/ separate meter
-
2013-03-06historical Contingent 240-char remark
Show marketing remark (240 chars)
R-10/NB ZONING (WEST HALF OF PROPERTY APPROVED FOR 4 ADDITIONAL UNITS AS PER CITY)(ZONING CASE Z90-98) Super investment property with great cash flow, All units currently rented, large lot . 87 ACRES!!! Tenants pay utilities/ separate meter
-
2013-02-06price $235,000 240-char remark
Show marketing remark (240 chars)
R-10/NB ZONING (WEST HALF OF PROPERTY APPROVED FOR 4 ADDITIONAL UNITS AS PER CITY)(ZONING CASE Z90-98) Super investment property with great cash flow, All units currently rented, large lot . 87 ACRES!!! Tenants pay utilities/ separate meter
-
2012-09-26$250,000 Active 240-char remark
Show marketing remark (240 chars)
R-10/NB ZONING (WEST HALF OF PROPERTY APPROVED FOR 4 ADDITIONAL UNITS AS PER CITY)(ZONING CASE Z90-98) Super investment property with great cash flow, All units currently rented, large lot . 87 ACRES!!! Tenants pay utilities/ separate meter
-
2012-09-26$235,000 240-char remark
Show marketing remark (240 chars)
R-10/NB ZONING (WEST HALF OF PROPERTY APPROVED FOR 4 ADDITIONAL UNITS AS PER CITY)(ZONING CASE Z90-98) Super investment property with great cash flow, All units currently rented, large lot . 87 ACRES!!! Tenants pay utilities/ separate meter
-
2012-05-21historical
-
2010-10-14$250,000
ⓘ Source: listings_history table (triggers on properties + properties_extension) + one-shot
backfill from property_details.listing_events for pre-trigger history.
Tax reassessment forecast NC · Resets to sale price
- Current annual tax
- $3,291 · $274/mo
- Projected year-2 tax
- $5,412 · $451/mo
- Expected delta
- +$2,121/yr (+$177/mo · 64.4%)
ⓘ Screening estimate from a state-policy table — verify with the county assessor before closing.
Climate risk First Street
- Flood 9/10 Extreme FEMA zone X (unshaded) · 99% chance over 30 yrs
- Wildfire 3/10 Moderate
- Heat 7/10 Severe 7 d/yr ≥105°F today · 17 d/yr by 30 yrs out
- Wind 6/10 Major 53% chance of damaging wind over 30 yrs
- Air quality 2/10 Low 1 unhealthy d/yr today · 1 by 30 yrs out
Nearby sold comps map
Loading sold comps map…
Walkable amenities ~0.75 mi
Loading nearby amenities…
Taxation est. · year 1
- Rental income
- $76,044
- − Mortgage interest
- −$36,970
- − Property taxes
- −$3,291
- − Insurance
- −$4,098
- − Repairs & maintenance
- −$6,084
- − Management
- −$6,084
- − Depreciation
- −$19,200
- Taxable income
- $318
- Est. tax owed @ 24.0%
- −$76
- After-tax cash flow
- $11,076/yr
For passive investors: Depreciation is non-cash, so a rental often shows a tax loss while cash-flowing — sheltering income. Rental losses are passive: they offset passive income freely, and up to $25,000/yr can offset ordinary (W-2) income if you actively participate and your MAGI is under $100k (phasing out to $0 by $150k); unused losses carry forward. On sale, claimed depreciation is recaptured at up to 25%, and gains may owe capital-gains tax (a 1031 exchange can defer both). Figures are a year-1 estimate at your 24.0% rate — not tax advice; consult a CPA.
Schools (NCES district)
- District
- Wake County Schools
- NCES district ID
- 3704720
- Math proficiency
- 52% ▲ 2.00%
- Reading proficiency
- 60% ▲ 4.00%
- Median HH income
- $67,509
- Composite
- 49.41/100
- National rank
- #2010
- State rank
- #35 of 178 in NC
Livability — Raleigh
- Score
- 83/100
- State rank
- #10
- US rank
- #1028
Category grades
Schools grade is shown separately in the Schools card above.
Census & demographics
- Census place
- Raleigh, NC
- County
- Wake County · 1,216,256 people
- City population
- 569,344
- Metro
- Raleigh-Cary, NC
- Population (ZIP)
- 53,972
- Household income
- $90,484
- Rent vs Own
- Severe rent burden
- 1914.0
Population outlook (Wake County) Hauer SSP2
- Today (2025)
- 1,293,152 people
- By 2030
- 1,428,223 · +10.4%
- By 2040
- 1,698,188 · +31.3%
- By 2050
- 1,955,807 · +51.2%
- By 2075
- 2,520,273 · +94.9%
- By 2100
- 2,893,335 · +123.7%
Race, ethnicity, and origin ACS 2023
- Neighborhood character
- Diverse neighborhood (Simpson 0.57)
- Race & ethnicity
- White 62% Black 17% Hispanic / Latino 14% Two or more races 10% Asian 2%
- Hispanic origin (detail)
- Mexican 9% Puerto Rican 1%
- Common ancestry
- Serbian 3% Slovak 2% Italian 2%
- Foreign-born
- 10% · Canada, China
- Languages at home
- 85% English-only · Spanish 10% Other Indo-European 1% Arabic 1%
Political lean MEDSL · Wake
- 2024 margin
- Strong D (+25.5) · D 61.9% · R 36.4% · Other 1.7%
- 2008→2024 swing
- +11.1pp toward D · 2008: 14.4pp · 2024: 25.5pp
- All cycles
- 2024: D+25.5 2020: D+26.4 2016: D+20.5 2012: D+10.2 2008: D+14.4
Not yet ingested
- Civics
- —
Market trends
- HPI YoY
- ▼ -132.00%
- Current HPI
- 243.2963
- Rent YoY
- ▲ 1.59%
- Metro
- Raleigh-Cary, NC
- State GDP YoY
- ▲ 3.28%
- F500 in state
- 26
Industry mix (Fortune 500 HQ in NC)
| Industry | F500 HQs | Revenue |
|---|---|---|
| Financial Services | 2 | $213B |
|
||
| Retail | 2 | $95B |
|
||
| Industrial Conglomerate | 1 | $38B |
|
||
| Metals / Steel | 1 | $35B |
|
||
| Utilities | 1 | $30B |
|
||
| Industrial Machinery | 1 | $19B |
|
||
Price history
+3566.7% since first listed39 events — show timeline
- 2026-05-18 Listed $660,000 TMLS
- 2025-12-10 Rental Removed $990 TMLS
- 2025-11-24 Rental Removed $990 TMLS
- 2025-11-08 Listed for Rent $990 TMLS
- 2025-11-05 Rental Removed $990 TMLS
- 2025-10-22 Price Changed $990 TMLS
- 2025-10-22 Price Changed $980 TMLS
- 2025-09-20 Price Changed $1,070 TMLS
- 2025-09-20 Price Changed $1,060 TMLS
- 2025-09-10 Price Changed $1,085 TMLS
- 2025-09-10 Price Changed $1,075 TMLS
- 2025-09-10 Rental Removed $1,095 TMLS
- 2025-07-21 Price Changed $1,095 TMLS
- 2025-06-12 Listed for Rent $1,120 TMLS
- 2025-05-24 Listed for Rent $1,125 TMLS
- 2025-05-06 Rental Removed $1,085 APPFOLIO
- 2025-05-04 Listed for Rent $1,085 APPFOLIO
- 2025-05-04 Rental Removed $1,085 TMLS
- 2025-04-26 Price Changed $1,085 TMLS
- 2025-04-26 Price Changed $1,115 TMLS
- 2025-03-17 Price Changed $1,125 TMLS
- 2025-03-17 Price Changed $1,095 TMLS
- 2025-02-20 Listed for Rent $1,185 TMLS
- 2025-02-20 Listed for Rent $1,195 TMLS
- 2025-02-20 Rental Removed $1,185 APPFOLIO
- 2025-02-18 Listed for Rent $1,185 APPFOLIO
- 2013-04-04 Sold (Public Records) $213,000 Public Records
- 2013-04-04 Sold (MLS) $213,000 AMLSNC
- 2013-04-04 Sold (MLS) $213,000 TMLS
- 2013-03-28 Pending — TMLS
- 2013-03-06 Contingent — TMLS
- 2013-02-06 Price Changed $235,000 TMLS
- 2012-09-26 Listed $235,000 AMLSNC
- 2012-09-26 Listed $250,000 TMLS
- 2012-05-21 Listing Removed — TMLS
- 2010-10-14 Listed $250,000 TMLS
- 1998-07-01 Sold (Public Records) $425,000 Public Records
- 1988-12-30 Sold (Public Records) $18,000 Public Records
- 1968-12-30 Sold (Public Records) $18,000 Public Records
Property tax history
+5.6%/yrLatest (2025): $3,291 · +0.4% YoY. Source: county tax records.
Cash-flow waterfall
monthlySold comps — $/sqft
last 12 mo · ≤1 miLoading sold comps…