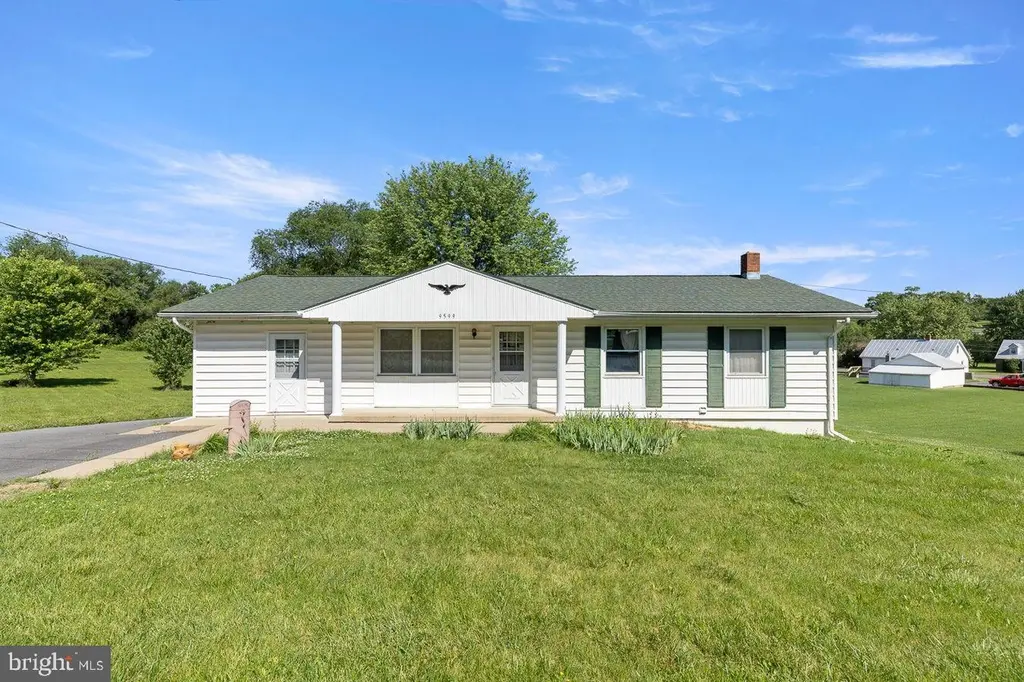
9599 Jackson Ave · New Market, VA
Flood risk 1/10 · Minimal
- FEMA flood zone
- X (unshaded)
- Chance of flooding over 30 yrs
- 0.0%
- Est. flood insurance / yr
- $507 – $1,088
Fire risk 3/10 · Minor
- Est. fire insurance / yr
- $666 – $1,236
Heat risk 5/10 · Moderate
- Hot days now (above 94°F)
- 7 days/yr
- Hot days in 30 yrs
- 17 days/yr
Wind risk 2/10 · Minimal
- Chance of severe wind over 30 yrs
- 1.0%
Air-quality risk 1/10 · Minimal
- Unhealthy air days now
- 0 days/yr
- Unhealthy air days in 30 yrs
- 0 days/yr
Risk factors via First Street. Map © Google.
Why this score? — see what drove the D+ grade
The composite is a weighted blend of 9 inputs, each scored 0–100. Each bar is that input's sub-score; the figure is the points it added to the 100-point composite (weight × sub-score).
- ARV discount +15.0/15.0
- Appreciation +9.9/10.0
- Cash flow +7.8/30.0
- Schools +4.4/10.0
- Livability +3.2/5.0
- Rent growth +2.5/5.0
- Condition / age +2.5/5.0
- DSCR +1.8/10.0
- 1% rule +1.3/10.0
$225,000
🖨 Deal sheet (PDF) 📄 Offer letter ✓ Due diligence
Listing remarks
Investment opportunity with great potential! This home experienced water damage from busted pipes during the winter, and professional remediation was completed by Paul Davis Restoration. Damaged flooring, cabinets, and drywall have already been removed, providing a clean slate and ready for renovation. Make it your own with the finishes and design you choose. Situated on two lots (Lots 61 & 62), this property offers added space and possibilities. Conveniently located close to I-81 and the town of New Market for easy access to shopping, dining, and commuting.
Key facts
- Two lots
- Close to i-81
- 0.33 acre lot
Tags
Property features AI
Exterior
- Parking: Driveway
- Utilities: Public water; Public sewer; Electric service; Oil heating
- Home design: Detached single-family home
- Construction: Aluminum siding; Block foundation; Above-grade living area of 1,424 (assessor); Below-grade area of 1,424 (unfinished, estimated)
- Exterior features: Additional lot(s)
Interior
- Bedrooms: Three bedrooms on the main level
- Bathrooms: One full bathroom on the main level; One half bathroom on the main level
- Heating & cooling: 90% forced air heating (oil-fired); Central air conditioning (electric); Electric hot water
- Interior features: Unfinished walkout basement
Neighborhood map
What this means for you Summary
Snapshot
- This is a 3-bed/1.5-bath single-family listed at $225k.
Deal economics
- At list price, monthly cash flow is $-254 ($-3k/yr) — negative.
- To cash-flow at today's rent, offer at most $180k (20.0% below list).
- To meet the 1% rule (rent ≥ 1% of price), the offer needs to be $141k (37.3% below list).
- Recommended offer: $141k (37.3% below list) — sets the bar for 1% rule.
- Cap rate 4.9% vs local median 2.5% in New Market — top-decile yield for the area; either an underpriced asset or a hidden risk that comps aren't pricing in. Stress-test before assuming the spread holds.
Location & tenants
- Location reads 63/100 on livability (#372 in VA) — a middle-class / working-renter tenant base. Strengths: crime A+, cost of living A, health & safety A; Watch: employment D, amenities F, commute F.
- Shenandoah County Public School District (town): math 46% / reading 58% proficiency, ranked #91 of 131 in VA (top 70%) — acceptable for families but not a draw, mixed tenant base, ~2y average lease.
- Zoned schools: North Fork Middle (math 42% / reading 52%, grade D+, #257 of 342 statewide, top 77%, 350 students, 73% FRL) — zoned schools average 73% FRL vs 37% district-wide (36 pts higher); higher-poverty schools than district average — tighter screening recommended.
- Market conditions: 41 active listings in the ZIP; 3 comparable units currently listed for rent nearby; rentals lingering (median 45d on market — plan ~5-8 weeks vacancy on turnover, expect pricing pressure); 67% of comp listings sitting > 30 days — soft ceiling on asking rent; 224 units permitted in Shenandoah County in 2024 (0 in 5+ unit buildings).
Forward outlook
- In year one you build about $24k of equity ($2k loan paydown + $22k appreciation (9.8% local appreciation)).
- Shenandoah County population projected at +5% by 2050 — modest demand growth; plan on rents tracking national, not racing it.
- By year 2, paydown + projected appreciation supports a ~$38k cash-out refi (75% LTV) — recoverable capital for the next deal without selling this one.
Negotiation context
- Only 3 days on market — expect competitive offers; lowballing is unlikely to land.
Risks & watch-outs
- Climate carrying-cost: extreme-heat days projected 7→17/yr by 2055 (HVAC capex compounding) — expect insurance premiums to compound above CPI over the hold.
Questions for the listing agent
- What do current leases actually rent for vs. the listed asking? Can we see a recent rent roll and the last 12 months of T-12 income?
- Built in 1973 — when were the roof, HVAC, electrical panel, plumbing, and water heater last replaced?
- Is there a deadline driving the sale (1031 exchange, divorce, estate, relocation)? That informs how much negotiation room exists.
- Schools are F-rated, which usually means shorter tenancies and higher turnover. Who's the typical renter profile here, and what's been the actual vacancy rate?
- The area grade is low — what's the realistic commute time and amenity access for the typical tenant pool here? Any planned neighborhood developments (good or bad) we should know about?
- What's the average days-on-market for RENTAL listings here right now (not sales)? A rising rental-DOM trend means longer vacancies and softer asking-rent achievability than the comps imply.
- What's the recent tenant-quality profile in this submarket — average credit score on applications, eviction rate, late-payment / NSF rate, and stable-employment percentage? A property-management company in the area should have these aggregated.
- How much new for-sale + rental construction is in the pipeline within 1–3 miles? Heavy new supply typically softens prices + rents 12–24 months out; constrained supply supports both.
Investment metrics
- 1% rule
- 0.63% ✗
- Cap rate
- 4.94%
- Cash-on-cash
- -4.85%
- DSCR
- 0.78
- GRM
- 13.3
CMA / ARV
- ARV (on-the-fly)
- $328,944
- Comps found
- 3
Show comp detail 3 sales within ~0.75 mi
| Address | Dist | Beds/Ba | Sqft | Sold | Price | $/sf | Match |
|---|---|---|---|---|---|---|---|
| 469 Old Cross Rd W | 0.15mi | 3/2.0 | 1,302 (-9%) | 14mo | $310,000 | $238 | 66 |
| 192 Jackson Ave | 0.11mi | 4/2.0 (+1) | 1,584 (+11%) | 9mo | $325,000 | $205 | 62 |
| 9859 Massanutten Ave | 0.73mi | 3/2.0 | 1,380 (-3%) | 14mo | $318,500 | $231 | 47 |
Match score weights: distance 35% · size 25% · config 20% · recency 20%. Top-matched comps best support the ARV.
Projected returns pro-forma
9.78% appreciation · 3.0% rent growth · sell at horizon
- IRR
- 20.4%
- Equity multiple
- 2.63×
- Total profit
- $102,917
- Equity at exit
- $199,156
- IRR
- 18.6%
- Equity multiple
- 6.00×
- Total profit
- $314,761
- Equity at exit
- $425,772
Cash invested: $63,000 (down + closing). Projections, not guarantees.
Landlord ↔ Tenant lean methodology
- Overall (STATE)
- 55 Moderately Landlord-Leaning
- State Virginia
- 55 Moderately Landlord-Leaning · D+2
- County
- — inherits STATE
- City
- — inherits STATE
ZIP-level market 22844
- Home prices YoY
- 3.1%
- Active inventory
- 41
- Price-to-rent
- 13.3×
Monthly cashflow live
- Estimated rent
- $1,410 medium interval (Pro) →
- Mortgage (P&I)
- −$1,180
- Tax from tax record
- −$95 /mo · $1,136/yr
- Insurance
- −$94
- HOA
- −$0
- Vacancy / Maint / Mgmt
- −$296
- Net cashflow
- $-254
Break-even live
Sensitivity live
| Price | -10% $-127 | -5% $-191 | +0% $-254 | +5% $-318 | +10% $-382 |
|---|---|---|---|---|---|
| Rent | -10% $-366 | -5% $-310 | +0% $-254 | +5% $-199 | +10% $-143 |
| Rate | -1.0pp $-141 | -0.5pp $-197 | base $-254 | +0.5pp $-313 | +1.0pp $-372 |
UW: 25.0% down · 7.5% · 30yr · 1.5% tax · 5.0% vac · 8.0% maint · 8.0% mgmt
Financing live
Cash to close
- Down payment
- $56,250
- Closing costs
- $6,750
- Reserves months
- —
- Total cash needed
- —
Loan-product check · same deal, 3 products live
Conventional
25% down · 7.5% · 30yr
- Down + closing
- —
- Monthly P&I
- —
- Monthly cashflow
- —
- DSCR
- —
- Eligible?
- —
Personal DTI + credit; lowest rate.
DSCR
20% down · 8.5% · 30yr
- Down + closing
- —
- Monthly P&I
- —
- Monthly cashflow
- —
- DSCR
- —
- Eligible?
- —
No personal income docs; deal must DSCR.
Hard money
10% down · 12.0% · 12mo
- Down + closing
- —
- Monthly P&I
- —
- Monthly cashflow
- —
- DSCR
- —
- Eligible?
- —
Short-term bridge; refi at stabilization.
Rent comps 3 comps
| Address | Beds | Baths | Sqft | Rent | $/sqft | DOM | Units | Dist |
|---|---|---|---|---|---|---|---|---|
| 9570 Shenandoah Dr New Market, VA | 2.0 | 1.0 | 1070 | $1,295 | $1.21 | 44d | 1 | 0.12mi |
| 132 W Seminary Ln New Market, VA | 3.0 | 2.0 | 1848 | $1,700 | $0.92 | 44d | 1 | 0.61mi |
| 213 Pelham Dr New Market, VA | 2.0 | 1.5 | 1320 | $1,695 | $1.28 | 6d | 1 | 0.70mi |
Listing history 4 events
-
2026-06-02statusdays on market $225,000 Pending 3 DOM
-
2026-06-01days on market $225,000 Active 2 DOM
-
2026-05-31remarks 566-char remark
-
2026-05-31$225,000 Active 1 DOM
ⓘ Source: listings_history table (triggers on properties + properties_extension) + one-shot
backfill from property_details.listing_events for pre-trigger history.
Tax reassessment forecast VA · Resets to sale price
- Current annual tax
- $1,136 · $95/mo
- Projected year-2 tax
- $1,845 · $154/mo
- Expected delta
- +$709/yr (+$59/mo · 62.4%)
ⓘ Screening estimate from a state-policy table — verify with the county assessor before closing.
Climate risk First Street
- Flood 1/10 Low FEMA zone X (unshaded) · 0% chance over 30 yrs
- Wildfire 3/10 Moderate
- Heat 5/10 Major 7 d/yr ≥94°F today · 17 d/yr by 30 yrs out
- Wind 2/10 Low 100% chance of damaging wind over 30 yrs
- Air quality 1/10 Low 0 unhealthy d/yr today · 0 by 30 yrs out
Nearby sold comps map
Loading sold comps map…
Walkable amenities ~0.75 mi
Loading nearby amenities…
Taxation est. · year 1
- Rental income
- $16,921
- − Mortgage interest
- −$12,603
- − Property taxes
- −$1,136
- − Insurance
- −$1,125
- − Repairs & maintenance
- −$1,354
- − Management
- −$1,354
- − Depreciation
- −$6,545
- Taxable loss
- −$7,196
- Est. tax savings @ 24.0%
- +$1,727
- After-tax cash flow
- $-1,325/yr
For passive investors: Depreciation is non-cash, so a rental often shows a tax loss while cash-flowing — sheltering income. Rental losses are passive: they offset passive income freely, and up to $25,000/yr can offset ordinary (W-2) income if you actively participate and your MAGI is under $100k (phasing out to $0 by $150k); unused losses carry forward. On sale, claimed depreciation is recaptured at up to 25%, and gains may owe capital-gains tax (a 1031 exchange can defer both). Figures are a year-1 estimate at your 24.0% rate — not tax advice; consult a CPA.
Schools (NCES district)
- District
- Shenandoah County Public School District
- NCES district ID
- 5103510
- Math proficiency
- 46% ▼ -30.00%
- Reading proficiency
- 58% ▼ -9.00%
- Median HH income
- $50,207
- Composite
- 44.42/100
- National rank
- #2811
- State rank
- #91 of 131 in VA
Livability — New Market
- Score
- 63/100
- State rank
- #372
- US rank
- #15038
Category grades
Schools grade is shown separately in the Schools card above.
Census & demographics
- Census place
- New Market, VA
- Population (ZIP)
- 4,674
Population outlook (Shenandoah County) Hauer SSP2
- Today (2025)
- 44,891 people
- By 2030
- 45,630 · +1.6%
- By 2040
- 46,708 · +4.0%
- By 2050
- 47,072 · +4.9%
- By 2075
- 47,418 · +5.6%
- By 2100
- 43,707 · -2.6%
Race, ethnicity, and origin ACS 2023
- Neighborhood character
- Predominantly White (92%)
- Race & ethnicity
- White 92% Hispanic / Latino 4% Black 3% Two or more races 3%
- Common ancestry
- Lithuanian 2% Slovak 2% Danish 2%
- Foreign-born
- 2% · Canada
- Languages at home
- 94% English-only · Spanish 4% German/W. Germanic 1% Other Indo-European 1%
Political lean MEDSL · Shenandoah
- 2024 margin
- Solid R (+42.2) · D 28.4% · R 70.6% · Other 1.0%
- 2008→2024 swing
- -15.8pp toward R · 2008: -26.5pp · 2024: -42.2pp
- All cycles
- 2024: R+42.2 2020: R+40.6 2016: R+43.3 2012: R+31.4 2008: R+26.5
Not yet ingested
- Civics
- —
Market trends
- HPI YoY
- ▲ 9.78%
- Current HPI
- 328.5512
- Rent YoY
- —
- Metro
- —
- State GDP YoY
- ▲ 2.40%
- F500 in state
- 50
Industry mix (Fortune 500 HQ in VA)
| Industry | F500 HQs | Revenue |
|---|---|---|
| Aerospace / Defense | 4 | $236B |
|
||
| Technology / Defense | 3 | $32B |
|
||
| Financial Services | 2 | $176B |
|
||
| Utilities | 2 | $27B |
|
||
| Insurance | 2 | $25B |
|
||
| Technology | 2 | $15B |
|
||
Price history
1 event — show timeline
- 2026-05-30 Listed $225,000 BRIGHT MLS
Property tax history
+3.5%/yrLatest (2025): $1,136 · +0.0% YoY. Source: county tax records.
Cash-flow waterfall
monthlySold comps — $/sqft
last 12 mo · ≤1 miLoading sold comps…