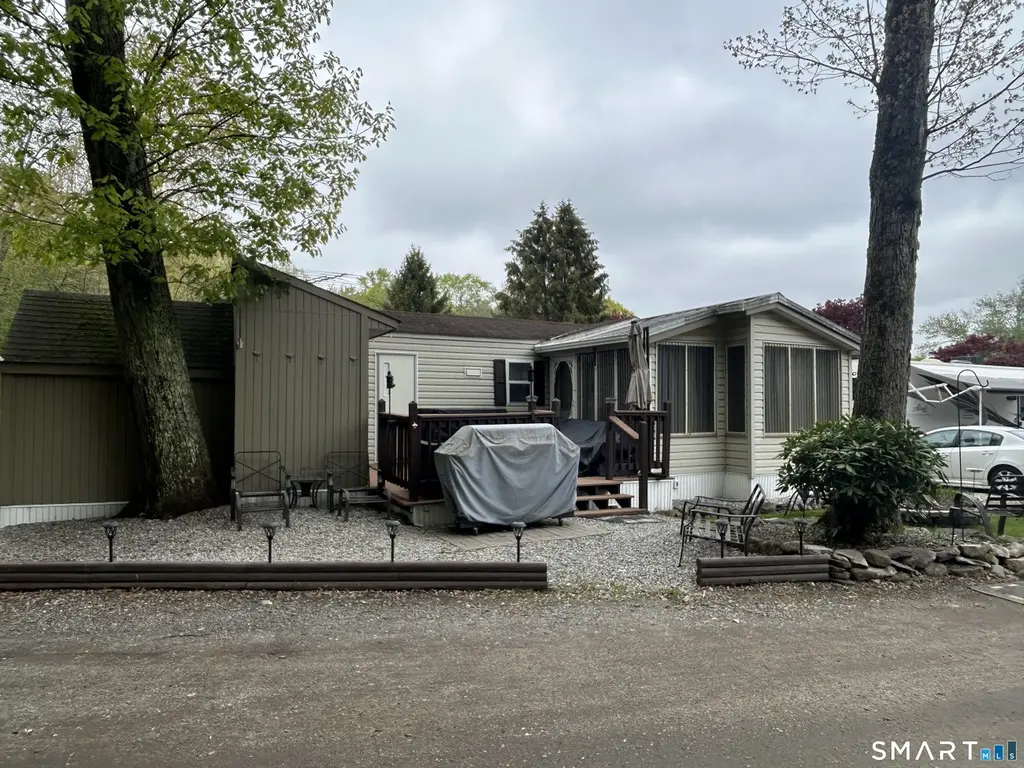
306 Old Colchester Rd #181 · Colchester, CT
Flood risk No data
- FEMA flood zone
- —
- Chance of flooding over 30 yrs
- —
- Est. flood insurance / yr
- —
Fire risk No data
- Est. fire insurance / yr
- —
Heat risk No data
- Hot days now (above threshold)
- —
- Hot days in 30 yrs
- —
Wind risk No data
- Chance of severe wind over 30 yrs
- —
Air-quality risk No data
- Unhealthy air days now
- —
- Unhealthy air days in 30 yrs
- —
Risk factors via First Street. Map © Google.
Why this score? — see what drove the B grade
The composite is a weighted blend of 9 inputs, each scored 0–100. Each bar is that input's sub-score; the figure is the points it added to the 100-point composite (weight × sub-score).
- Cash flow +30.0/30.0
- 1% rule +10.0/10.0
- DSCR +10.0/10.0
- ARV discount +7.5/15.0
- Schools +6.4/10.0
- Livability +3.9/5.0
- Rent growth +2.5/5.0
- Condition / age +2.5/5.0
- Appreciation +0.0/10.0
$74,900
🖨 Deal sheet (PDF) 📄 Offer letter ✓ Due diligence
Listing remarks
Welcome to your perfect summer escape at Indianfield Co-Op on beautiful Gardner Lake! This charming seasonal home offers approximately 800 square feet of comfortable living space, thoughtfully designed for relaxation and making lasting memories. Featuring 1 spacious bedroom plus a cozy loft for additional sleeping, this home easily accommodates family and guests alike. Step inside to find a bright kitchen, inviting living room, and a sunroom that's perfect for morning coffee or winding down after a day at the lake. Outside, enjoy your private porch complete with a fun tiki hut-ideal for entertaining or simply soaking in the summer vibes. A golf cart is included, and the 2026 season has alre
Key facts
- Fishing dock
- Private porch
- On site laundry room
Tags
Property features AI
Finance
- Other: Pets allowed (dogs must be leashed); Part of a multi-unit complex with 212 units; listed unit is an end unit
- HOA & community: Unit owners association with annual HOA; HOA fee paid annually; Association provides clubhouse, front desk receptionist, lake/beach access, grounds maintenance, trash pickup, water, property management, and road maintenance; Association amenities include basketball court, bocci court, guest parking, and playground/tot lot
Exterior
- Parking: Unpaved parking; 2 parking spaces
- Utilities: Shared well water; Septic system; Propane fuel (above-ground tank)
- Home design: Condo/Co-op (Co-Op); Seasonal property; Walk to water with dock or mooring; association access (seasonal)
- Construction: Other construction type
- Exterior features: Vinyl siding; Shed; Deck; Corner lot
Interior
- Kitchen: Oven/Range; Microwave; Refrigerator
- Bedrooms: 1 bedroom
- Bathrooms: 1 full bathroom
- Heating & cooling: Hot air heat; Propane hot water
- Interior features: Cable available; Window unit cooling
- Laundry & utility: Coin-operated common laundry in main building
Neighborhood map
What this means for you Summary
Snapshot
- This is a 1-bed/1.0-bath condo listed at $75k.
Deal economics
- At list price, monthly cash flow is $872 ($10k/yr) — positive.
- The deal already cash-flows at list — no discount required.
- Meets the 1% rule at list price ($2k rent vs $75k).
- Cap rate 20.3% vs local median 2.9% in Colchester — top-decile yield for the area; either an underpriced asset or a hidden risk that comps aren't pricing in. Stress-test before assuming the spread holds.
Location & tenants
- Location reads 77/100 on livability (#43 in CT, #3,018 nationally) — a middle-class / working-renter tenant base. Strengths: housing A+, health & safety A+, crime A; Watch: amenities F, commute F.
- Salem School District (rural): math 64% / reading 76% proficiency, ranked #17 of 153 in CT (top 11%) — strong family-tenant draw, lease renewals of 3-5y typical; only 9% free/reduced lunch — higher-income household profile.
- Zoned schools: Salem Elementary School (math 65% / reading 77%, grade A-, #73 of 553 statewide, top 13%, 397 students, 19% FRL).
- Market conditions: 29 active listings in the ZIP; 487 units permitted in Southeastern Connecticut Planning Region in 2024 (244 in 5+ unit buildings).
Forward outlook
- Local home prices are declining (-3.0%/yr); year-one equity from $518 of loan paydown is wiped out by about $2k of value loss. Plan a longer hold.
- At projected returns (-3.0% appreciation + 3.0% rent growth), your $21k cash investment doubles in ~3 years — after that, you're playing with house money.
Negotiation context
- Only 14 days on market — expect competitive offers; lowballing is unlikely to land.
- 2 sale attempts since 9y ago; this cycle's ask has dropped $10k (12%) from the opening price — seller is motivated, your offer sets the floor, not the list.
Questions for the listing agent
- What does the HOA fee cover, when was the last increase, and are there any pending special assessments or reserve-fund shortfalls?
- Any open or pending special assessments — roof, HVAC, plumbing, elevator, façade? What's the per-unit balance and payoff schedule, and is the seller paying it off at close or rolling it to the buyer?
- Is there a deadline driving the sale (1031 exchange, divorce, estate, relocation)? That informs how much negotiation room exists.
- Schools are A-rated — typically a magnet for longer-tenancy family renters. What's the average tenant stay here, and is there a school-zone premium baked into asking?
- What's the average days-on-market for RENTAL listings here right now (not sales)? A rising rental-DOM trend means longer vacancies and softer asking-rent achievability than the comps imply.
- What's the recent tenant-quality profile in this submarket — average credit score on applications, eviction rate, late-payment / NSF rate, and stable-employment percentage? A property-management company in the area should have these aggregated.
- How much new apartment / multifamily construction is in the pipeline within 1–3 miles? Heavy new supply (>2% of stock underway) typically softens rents 12–24 months out; light construction supports rent growth.
Investment metrics
- 1% rule
- 2.69% ✓
- Cap rate
- 20.26%
- Cash-on-cash
- 49.89%
- DSCR
- 3.22
- GRM
- 3.1
CMA / ARV
No comps found within radius.
Projected returns pro-forma
-3.0% appreciation · 3.0% rent growth · sell at horizon
- IRR
- 47.7%
- Equity multiple
- 3.08×
- Total profit
- $43,549
- Equity at exit
- $11,168
- IRR
- 53.4%
- Equity multiple
- 6.25×
- Total profit
- $110,061
- Equity at exit
- $6,476
Cash invested: $20,972 (down + closing). Projections, not guarantees.
Landlord ↔ Tenant lean methodology
- Overall (STATE)
- 27 Tenant-Leaning
- State Connecticut
- 27 Tenant-Leaning · D+7
- County
- — inherits STATE
- City
- — inherits STATE
ZIP-level market 06420
- Home prices YoY
- -10.2%
- Active inventory
- 29
- Price-to-rent
- 3.1×
Monthly cashflow live
- Estimated rent
- $2,018 medium interval (Pro) →
- Mortgage (P&I)
- −$393
- Tax est. 1.5%
- −$94 /mo · $1,124/yr
- Insurance
- −$31
- HOA
- −$205
- Vacancy / Maint / Mgmt
- −$424
- Net cashflow
- $872
Break-even live
Sensitivity live
| Price | -10% $924 | -5% $898 | +0% $872 | +5% $846 | +10% $820 |
|---|---|---|---|---|---|
| Rent | -10% $712 | -5% $792 | +0% $872 | +5% $952 | +10% $1,031 |
| Rate | -1.0pp $910 | -0.5pp $891 | base $872 | +0.5pp $852 | +1.0pp $833 |
UW: 25.0% down · 7.5% · 30yr · 1.5% tax · 5.0% vac · 8.0% maint · 8.0% mgmt
Financing live
Cash to close
- Down payment
- $18,725
- Closing costs
- $2,247
- Reserves months
- —
- Total cash needed
- —
Loan-product check · same deal, 3 products live
Conventional
25% down · 7.5% · 30yr
- Down + closing
- —
- Monthly P&I
- —
- Monthly cashflow
- —
- DSCR
- —
- Eligible?
- —
Personal DTI + credit; lowest rate.
DSCR
20% down · 8.5% · 30yr
- Down + closing
- —
- Monthly P&I
- —
- Monthly cashflow
- —
- DSCR
- —
- Eligible?
- —
No personal income docs; deal must DSCR.
Hard money
10% down · 12.0% · 12mo
- Down + closing
- —
- Monthly P&I
- —
- Monthly cashflow
- —
- DSCR
- —
- Eligible?
- —
Short-term bridge; refi at stabilization.
HOA detail condo
- Monthly dues
- $205 · $2,460/yr
- Assessments
- None detected in remarks — confirm with the listing agent.
Listing history 5 events
-
2026-05-22price $74,900
-
2026-05-10$84,900 Active
-
2018-06-01historical
-
2018-02-06price $59,900
-
2017-08-05$65,000 Active
ⓘ Source: listings_history table (triggers on properties + properties_extension) + one-shot
backfill from property_details.listing_events for pre-trigger history.
Nearby sold comps map
Loading sold comps map…
Walkable amenities ~0.75 mi
Loading nearby amenities…
Taxation est. · year 1
- Rental income
- $24,220
- − Mortgage interest
- −$4,196
- − Property taxes
- −$1,124
- − Insurance
- −$374
- − Repairs & maintenance
- −$1,938
- − Management
- −$1,938
- − HOA
- −$2,460
- − Depreciation
- −$2,179
- Taxable income
- $10,012
- Est. tax owed @ 24.0%
- −$2,403
- After-tax cash flow
- $8,059/yr
For passive investors: Depreciation is non-cash, so a rental often shows a tax loss while cash-flowing — sheltering income. Rental losses are passive: they offset passive income freely, and up to $25,000/yr can offset ordinary (W-2) income if you actively participate and your MAGI is under $100k (phasing out to $0 by $150k); unused losses carry forward. On sale, claimed depreciation is recaptured at up to 25%, and gains may owe capital-gains tax (a 1031 exchange can defer both). Figures are a year-1 estimate at your 24.0% rate — not tax advice; consult a CPA.
Schools (NCES district)
- District
- Salem School District
- NCES district ID
- 0903900
- Math proficiency
- 64% ▼ -7.00%
- Reading proficiency
- 76% ▼ -1.00%
- Median HH income
- $97,467
- Composite
- 63.86/100
- National rank
- #590
- State rank
- #17 of 153 in CT
Livability — Colchester
- Score
- 77/100
- State rank
- #43
- US rank
- #3018
Category grades
Schools grade is shown separately in the Schools card above.
Census & demographics
- Population (ZIP)
- 4,323
Population outlook (Southeastern Connecticut County) Hauer SSP2
- By 2040
- 293,442
Race, ethnicity, and origin ACS 2023
- Neighborhood character
- Predominantly White (89%)
- Race & ethnicity
- White 89% Hispanic / Latino 4% Two or more races 4% Black 1% Asian 1%
- Common ancestry
- Romanian 7% Lithuanian 5% Russian 3%
- Foreign-born
- 7% · Canada, China, Jamaica
- Languages at home
- 93% English-only · Spanish 3% Other Indo-European 1% Other Asian/Pacific 1%
Political lean MEDSL · Southeastern Connecticut
- 2024 margin
- D (+13.0) · D 55.6% · R 42.6% · Other 1.8%
- All cycles
- 2024: D+13.0
Not yet ingested
- Civics
- —
Market trends
- HPI YoY
- ▼ -31.50%
- Current HPI
- 278.0717
- Rent YoY
- —
- Metro
- —
- State GDP YoY
- ▲ 1.06%
- F500 in state
- 38
Industry mix (Fortune 500 HQ in CT)
| Industry | F500 HQs | Revenue |
|---|---|---|
| Industrial Machinery | 4 | $38B |
|
||
| Insurance | 3 | $71B |
|
||
| Financial Services | 2 | $25B |
|
||
| Transportation / Logistics | 2 | $18B |
|
||
| Healthcare | 1 | $247B |
|
||
| Telecommunications | 1 | $55B |
|
||
Price history
+15.2% since first listed5 events — show timeline
- 2026-05-22 Price Changed $74,900 Smart MLS
- 2026-05-10 Listed $84,900 Smart MLS
- 2018-06-01 Listing Removed — Smart MLS
- 2018-02-06 Price Changed $59,900 Smart MLS
- 2017-08-05 Listed $65,000 Smart MLS
Cash-flow waterfall
monthlySold comps — $/sqft
last 12 mo · ≤1 miLoading sold comps…