6108 Abrams Rd #627 · Dallas, TX
Flood risk 1/10 · Minimal
- FEMA flood zone
- X (unshaded)
- Chance of flooding over 30 yrs
- 0.0%
- Est. flood insurance / yr
- $507 – $1,088
Fire risk 2/10 · Minimal
- Est. fire insurance / yr
- $1,222 – $2,270
Heat risk 7/10 · Major
- Hot days now (above 109°F)
- 7 days/yr
- Hot days in 30 yrs
- 23 days/yr
Wind risk 6/10 · Moderate
- Chance of severe wind over 30 yrs
- 27.0%
Air-quality risk 3/10 · Minor
- Unhealthy air days now
- 3 days/yr
- Unhealthy air days in 30 yrs
- 3 days/yr
Risk factors via First Street. Map © Google.
Why this score? — see what drove the B- grade
The composite is a weighted blend of 9 inputs, each scored 0–100. Each bar is that input's sub-score; the figure is the points it added to the 100-point composite (weight × sub-score).
- Cash flow +23.2/30.0
- ARV discount +15.0/15.0
- 1% rule +10.0/10.0
- DSCR +7.5/10.0
- Livability +4.0/5.0
- Rent growth +3.0/5.0
- Schools +2.8/10.0
- Condition / age +2.5/5.0
- Appreciation +0.0/10.0
$64,000
🖨 Deal sheet 📄 Offer letter ✓ Due diligence
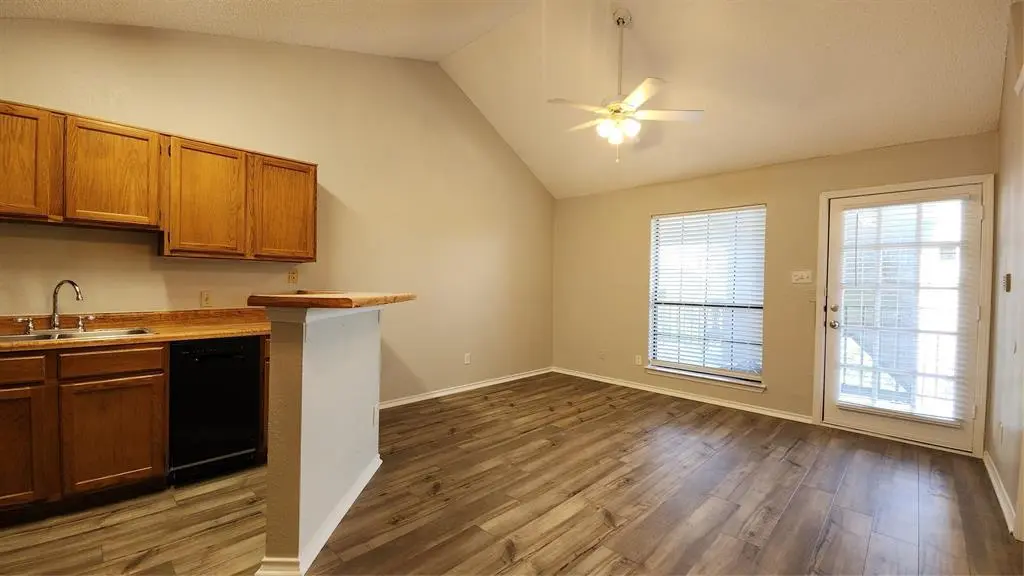
Listing remarks MLS
Freshly Painted and Updated Flooring with this Great 1 Bedroom Ready for Move in. Open Kitchen with Breakfast Bar. Refrigerator, Washer and Dryer Included. Good Size Bedroom and Bath along with Walk in Closet. Community Pool. Located Conveniently Near Loop 12 and Highway 75. Set up a Tour Today!
Key facts
- Community pool
- Updated flooring
- Walk in closet
Tags
Neighborhood map
What this means for you Summary
Snapshot
- This is a 1-bed/1.0-bath condo listed at $64k.
Deal economics
- At list price, monthly cash flow is $116 ($1k/yr) — positive.
- The deal already cash-flows at list — no discount required.
- Meets the 1% rule at list price ($1k rent vs $64k).
- Recommended offer: $60k (6.0% below list) — sets the bar for market timing.
- Cap rate 8.5% vs local median 2.3% in Dallas — top-decile yield for the area; either an underpriced asset or a hidden risk that comps aren't pricing in. Stress-test before assuming the spread holds.
Location & tenants
- Location reads 81/100 on livability (#24 in TX, #1,380 nationally) — a professional / high-income tenant draw. Strengths: amenities A+, commute A+, housing A+; Watch: schools C-, crime F.
- Dallas ISD (urban): math 31% / reading 36% proficiency, ranked #559 of 826 in TX (top 68%) — families likely to look elsewhere, expect single-tenant / working-renter base with shorter leases; 83% free/reduced lunch — lower-income household profile, screen leases tightly.
- Market conditions: Rents rising (+2.0%/yr); 213 active listings in the ZIP; 40 comparable units currently listed for rent nearby; rentals leasing fast (median 13d on market — plan ~1-2 weeks tenant-placement turnaround); 12,577 units permitted in Dallas County in 2024 (6,829 in 5+ unit buildings).
Forward outlook
- Local home prices are declining (-3.0%/yr); year-one equity from $442 of loan paydown is wiped out by about $2k of value loss. Plan a longer hold.
- Dallas County population projected at +35% by 2050 — long-run rental-demand tailwind backs the buy-and-hold thesis.
Negotiation context
- It's been on market 84 days — a 6% lower offer ($60k) is reasonable based on typical stale-listing flexibility.
- 9 sale attempts; this cycle's ask has dropped $5k (7%) from the opening price — seller is motivated, your offer sets the floor, not the list.
Risks & watch-outs
- Watch-outs: property tax is 2.8% of price; HOA is 26% of rent.
- Climate carrying-cost: major wind risk, 27% chance of damaging wind over 30y; extreme-heat days projected 7→23/yr by 2055 (HVAC capex compounding) — expect insurance premiums to compound above CPI over the hold.
Questions for the listing agent
- It's been on market 84 days. Have you received any prior offers? Is the seller open to a 6% concession, seller financing, or rate buy-down credit?
- Property tax is high relative to price — has the assessment been appealed recently, and will the sale trigger a re-assessment?
- What does the HOA fee cover, when was the last increase, and are there any pending special assessments or reserve-fund shortfalls?
- Any open or pending special assessments — roof, HVAC, plumbing, elevator, façade? What's the per-unit balance and payoff schedule, and is the seller paying it off at close or rolling it to the buyer?
- Why hasn't it sold? Are there any deal-killer items the seller is aware of (foundation, flood, title, zoning, code violations)?
- Is there a deadline driving the sale (1031 exchange, divorce, estate, relocation)? That informs how much negotiation room exists.
- Crime grade is F in this area — have there been break-ins, vandalism, or insurance claims at this property in the last 3 years? What carrier currently insures it and at what premium?
- What's the average days-on-market for RENTAL listings here right now (not sales)? A rising rental-DOM trend means longer vacancies and softer asking-rent achievability than the comps imply.
- What's the recent tenant-quality profile in this submarket — average credit score on applications, eviction rate, late-payment / NSF rate, and stable-employment percentage? A property-management company in the area should have these aggregated.
- How much new apartment / multifamily construction is in the pipeline within 1–3 miles? Heavy new supply (>2% of stock underway) typically softens rents 12–24 months out; light construction supports rent growth.
Investment metrics
- 1% rule
- 1.84% ✓
- Cap rate
- 8.47%
- Cash-on-cash
- 7.78%
- DSCR
- 1.35
- GRM
- 4.5
CMA / ARV
- ARV (median comp)
- $106,138
- List price
- $64,000
- Delta
- -39.70%
- Verdict
- UNDERPRICED
- Comps
- 20 within 1.0 mi
Projected returns pro-forma
-3.0% appreciation · 1.96% rent growth · sell at horizon
- IRR
- -6.0%
- Equity multiple
- 0.78×
- Total profit
- $-3,941
- Equity at exit
- $9,543
- IRR
- 1.8%
- Equity multiple
- 1.12×
- Total profit
- $2,198
- Equity at exit
- $5,534
Cash invested: $17,920 (down + closing). Projections, not guarantees.
Landlord ↔ Tenant lean methodology
- Overall (STATE)
- 87 Strongly Landlord-Friendly
- State Texas
- 87 Strongly Landlord-Friendly · R+5
- County
- — inherits STATE
- City
- — inherits STATE
ZIP-level market 75231
- Rents YoY
- 2.0%
- Active inventory
- 213
- Price-to-rent
- 4.5×
Monthly cashflow live
- Estimated rent
- $1,179 high interval (Pro) →
- Mortgage (P&I)
- −$336
- Tax from tax record
- −$151 /mo · $1,806/yr
- Insurance
- −$27
- HOA
- −$302
- Vacancy / Maint / Mgmt
- −$247
- Net cashflow
- $116
Break-even live
UW: 25.0% down · 7.5% · 30yr · 1.5% tax · 5.0% vac · 8.0% maint · 8.0% mgmt
Financing live
Cash to close
- Down payment
- $16,000
- Closing costs
- $1,920
- Reserves months
- —
- Total cash needed
- —
Loan-product check · same deal, 3 products live
Conventional
25% down · 7.5% · 30yr
- Down + closing
- —
- Monthly P&I
- —
- Monthly cashflow
- —
- DSCR
- —
- Eligible?
- —
Personal DTI + credit; lowest rate.
DSCR
20% down · 8.5% · 30yr
- Down + closing
- —
- Monthly P&I
- —
- Monthly cashflow
- —
- DSCR
- —
- Eligible?
- —
No personal income docs; deal must DSCR.
Hard money
10% down · 12.0% · 12mo
- Down + closing
- —
- Monthly P&I
- —
- Monthly cashflow
- —
- DSCR
- —
- Eligible?
- —
Short-term bridge; refi at stabilization.
Rent comps 40 comps
| Address | Beds | Baths | Sqft | Rent | $/sqft | DOM | Units | Dist |
|---|---|---|---|---|---|---|---|---|
| 6108 Abrams Rd Dallas, TX | 1.0–2.0 | 1.0–2.0 | 675 | $795 | $1.18 | 20d | 7 | 0.06mi |
| 6108 Abrams Rd Dallas, TX | 1.0–2.0 | 1.0–2.0 | 664 | $895 | $1.35 | 2d | 5 | 0.06mi |
| 6003 Abrams Rd Dallas, TX | 2.0 | 1.0–2.0 | 675 | $1,315 | $1.95 | 1d | 32 | 0.09mi |
| 6603 E Lovers Ln Dallas, TX | 2.0 | 1.0 | 620 | $1,017 | $1.64 | 1d | 5 | 0.31mi |
| 8910 Southwestern Blvd Dallas, TX | 1.0–3.0 | 1.0–2.0 | 974 | $1,472 | $1.51 | 1d | 30 | 0.51mi |
| 6466 Ridgecrest Rd Dallas, TX | 1.0 | 1.0 | 535 | $899 | $1.68 | 2d | 8 | 0.53mi |
| 6211 E Northwest Hwy Unit G417 Dallas, TX | 1.0 | 1.0 | 397 | $2,000 | $5.04 | 18d | 1 | 0.54mi |
| 6211 E Northwest Hwy Unit G224 Dallas, TX | 1.0 | 1.0 | 721 | $1,950 | $2.70 | 24d | 1 | 0.54mi |
| 6211 Northwest Hwy Unit G124 Dallas, TX | — | 1.0 | 390 | $1,400 | $3.59 | 43d | 1 | 0.54mi |
| 8616 Southwestern Blvd Dallas, TX | 1.0 | 1.0 | 733 | $1,950 | $2.66 | 18d | 1 | 0.63mi |
| 8616 Southwestern Blvd Dallas, TX | 1.0 | 1.0 | 733 | $1,950 | $2.66 | 43d | 1 | 0.63mi |
| 8612 Southwestern Blvd Unit 8627 Dallas, TX | 1.0 | 1.0 | 561 | $1,399 | $2.49 | 2d | 1 | 0.63mi |
| 8612 Southwestern Blvd Unit 8633 Dallas, TX | 1.0 | 1.0 | 561 | $1,321 | $2.35 | 13d | 1 | 0.63mi |
| 8780 Park Ln Dallas, TX | 2.0 | 1.0–2.0 | 642 | $1,277 | $1.99 | 3d | 56 | 0.63mi |
| 8705 Southwestern Blvd Unit 8720 Dallas, TX | 1.0 | 1.0 | 722 | $1,788 | $2.48 | 2d | 1 | 0.65mi |
| 8705 Southwestern Blvd Unit 8720 Dallas, TX | 1.0 | 1.0 | 722 | $1,992 | $2.76 | 14d | 1 | 0.65mi |
| 8705 Southwestern Blvd Unit 412 Dallas, TX | 1.0 | 1.0 | 722 | $1,780 | $2.47 | 12d | 1 | 0.65mi |
| 6760 Eastridge Dr Unit 102 Dallas, TX | 1.0 | 1.0 | 725 | $1,350 | $1.86 | 18d | 1 | 0.66mi |
| 6311 Melody Ln Dallas, TX | 1.0 | 1.0 | 653 | $915 | $1.40 | 43d | 1 | 0.70mi |
| 8612 Southwestern Blvd Dallas, TX | 1.0 | 1.0 | 561 | $1,316 | $2.35 | 13d | 1 | 0.70mi |
| 6262 Melody Ln Dallas, TX | 1.0–2.0 | 1.0–2.0 | 750 | $755 | $1.01 | 12d | 4 | 0.73mi |
| 6262 Melody Ln Dallas, TX | 2.0 | 1.0–2.0 | 750 | $1,037 | $1.38 | 3d | 4 | 0.73mi |
| 6262 Melody Ln Dallas, TX | 1.0–2.0 | 1.0–2.0 | 820 | $830 | $1.01 | 24d | 2 | 0.73mi |
| 6262 Melody Ln Dallas, TX | 1.0–2.0 | 1.0–2.0 | 865 | $850 | $0.98 | 11d | 3 | 0.73mi |
| 8611 Southwestern Blvd Unit 8626 Dallas, TX | 1.0 | 1.0 | 636 | $1,595 | $2.51 | 14d | 1 | 0.74mi |
| 8611 Southwestern Blvd Unit 412 Dallas, TX | 1.0 | 1.0 | 561 | $1,425 | $2.54 | 12d | 1 | 0.74mi |
| 8611 Southwestern Blvd Unit 8626 Dallas, TX | 1.0 | 1.0 | 561 | $1,433 | $2.55 | 2d | 1 | 0.74mi |
| 6251 Melody Ln Dallas, TX | 1.0–2.0 | 1.0–2.0 | 819 | $770 | $0.94 | 1d | 41 | 0.76mi |
| 7545 E Northwest Hwy Dallas, TX | 2.0 | 1.0–2.0 | 938 | $1,758 | $1.87 | 1d | 27 | 0.85mi |
| 8601 Park Ln #416 Dallas, TX | 1.0 | 1.0 | 618 | $1,400 | $2.27 | 24d | 1 | 0.86mi |
| 6121 Melody Ln Dallas, TX | 1.0 | 1.0 | 653 | $960 | $1.47 | 24d | 1 | 0.87mi |
| 6050 Ridgecrest Rd Dallas, TX | 2.0 | 1.0–2.0 | 732 | $1,045 | $1.43 | 2d | 14 | 0.89mi |
| 8601 Park Ln Dallas, TX | 1.0 | 1.0 | 618 | $1,350 | $2.18 | 43d | 2 | 0.89mi |
| 6808 Skillman St Dallas, TX | 1.0–3.0 | 1.0–2.0 | 968 | $1,163 | $1.20 | 2d | 21 | 0.91mi |
| 6041 Ridgecrest Rd Dallas, TX | 1.0 | 1.0 | 587 | $1,165 | $1.98 | 17d | 4 | 0.97mi |
| 6050 Melody Ln Dallas, TX | 1.0–2.0 | 1.0–2.0 | 930 | $773 | $0.83 | 1d | 9 | 0.98mi |
| 5605 Village Glen Dr Dallas, TX | 1.0–3.0 | 1.0–2.5 | 813 | $1,217 | $1.50 | 1d | 1 | 1.00mi |
| 6014 Ridgecrest Rd Dallas, TX | 1.0 | 1.0 | 734 | $975 | $1.33 | 43d | 1 | 1.02mi |
| 8510 Park Ln #201 Dallas, TX | 1.0 | 1.0 | 625 | $1,055 | $1.69 | 7d | 1 | 1.02mi |
| 8510 Park Ln #102 Dallas, TX | 1.0 | 1.0 | 700 | $1,195 | $1.71 | 10d | 1 | 1.02mi |
HOA detail condo
- Monthly dues
- $302 · $3,624/yr
- Likely covers
- pool
- Assessments
- None detected in remarks — confirm with the listing agent.
Listing history 23 events
-
2026-05-07price $64,000 298-char remark
Show marketing remark (298 chars)
Freshly Painted and Updated Flooring with this Great 1 Bedroom Ready for Move in. Open Kitchen with Breakfast Bar. Refrigerator, Washer and Dryer Included. Good Size Bedroom and Bath along with Walk in Closet. Community Pool. Located Conveniently Near Loop 12 and Highway 75. Set up a Tour Today!
-
2026-03-15status Active 298-char remark
Show marketing remark (298 chars)
Freshly Painted and Updated Flooring with this Great 1 Bedroom Ready for Move in. Open Kitchen with Breakfast Bar. Refrigerator, Washer and Dryer Included. Good Size Bedroom and Bath along with Walk in Closet. Community Pool. Located Conveniently Near Loop 12 and Highway 75. Set up a Tour Today!
-
2026-03-12historical Active Option Contract 298-char remark
Show marketing remark (298 chars)
Freshly Painted and Updated Flooring with this Great 1 Bedroom Ready for Move in. Open Kitchen with Breakfast Bar. Refrigerator, Washer and Dryer Included. Good Size Bedroom and Bath along with Walk in Closet. Community Pool. Located Conveniently Near Loop 12 and Highway 75. Set up a Tour Today!
-
2026-03-06$69,000 Active 298-char remark
Show marketing remark (298 chars)
Freshly Painted and Updated Flooring with this Great 1 Bedroom Ready for Move in. Open Kitchen with Breakfast Bar. Refrigerator, Washer and Dryer Included. Good Size Bedroom and Bath along with Walk in Closet. Community Pool. Located Conveniently Near Loop 12 and Highway 75. Set up a Tour Today!
-
2026-02-28historical
-
2025-12-11status Active
-
2025-12-10historical Active Option Contract
-
2025-11-21price $69,500
-
2025-10-17$75,000 Active
-
2025-10-17historical
-
2025-09-25historical $849
-
2025-09-19$79,000 Active
-
2025-08-23$849
-
2025-08-23historical $825
-
2025-08-21$825
-
2025-08-01historical $849
-
2025-07-15price $849
-
2025-06-18price $850
-
2025-05-13price $895
-
2025-04-25$925
-
2025-04-25historical $925
-
2025-04-17$925
-
1987-02-13soldstatus
ⓘ Source: listings_history table (triggers on properties + properties_extension) + one-shot
backfill from property_details.listing_events for pre-trigger history.
Tax reassessment forecast TX · Resets to sale price
- Current annual tax
- $1,806 · $151/mo
- Projected year-2 tax
- $1,806 · $151/mo
- Expected delta
- $0/yr ($0/mo · 0.0%)
ⓘ Screening estimate from a state-policy table — verify with the county assessor before closing.
Climate risk First Street
- Flood 1/10 Low FEMA zone X (unshaded) · 0% chance over 30 yrs
- Wildfire 2/10 Low
- Heat 7/10 Severe 7 d/yr ≥109°F today · 23 d/yr by 30 yrs out
- Wind 6/10 Major 27% chance of damaging wind over 30 yrs
- Air quality 3/10 Moderate 3 unhealthy d/yr today · 3 by 30 yrs out
Nearby sold comps map
Loading sold comps map…
Walkable amenities ~0.75 mi
Loading nearby amenities…
Taxation est. · year 1
- Rental income
- $14,143
- − Mortgage interest
- −$3,585
- − Property taxes
- −$1,806
- − Insurance
- −$320
- − Repairs & maintenance
- −$1,131
- − Management
- −$1,131
- − HOA
- −$3,624
- − Depreciation
- −$1,862
- Taxable income
- $683
- Est. tax owed @ 24.0%
- −$164
- After-tax cash flow
- $1,231/yr
For passive investors: Depreciation is non-cash, so a rental often shows a tax loss while cash-flowing — sheltering income. Rental losses are passive: they offset passive income freely, and up to $25,000/yr can offset ordinary (W-2) income if you actively participate and your MAGI is under $100k (phasing out to $0 by $150k); unused losses carry forward. On sale, claimed depreciation is recaptured at up to 25%, and gains may owe capital-gains tax (a 1031 exchange can defer both). Figures are a year-1 estimate at your 24.0% rate — not tax advice; consult a CPA.
Schools (NCES district)
- District
- Dallas ISD
- NCES district ID
- 4816230
- Math proficiency
- 31% ▼ -16.00%
- Reading proficiency
- 36% ▼ -4.00%
- Median HH income
- $42,881
- Composite
- 28.41/100
- National rank
- #6763
- State rank
- #559 of 826 in TX
Livability — Dallas
- Score
- 81/100
- State rank
- #24
- US rank
- #1380
Category grades
Schools grade is shown separately in the Schools card above.
Census & demographics
- Census place
- Dallas, TX
- County
- Dallas County · 2,612,404 people
- City population
- 1,168,437
- Metro
- Dallas-Fort Worth-Arlington, TX
- Population (ZIP)
- 38,370
- Household income
- $58,540
- Rent vs Own
- Severe rent burden
- 3482.0
Population outlook (Dallas County) Hauer SSP2
- Today (2025)
- 2,979,839 people
- By 2030
- 3,191,823 · +7.1%
- By 2040
- 3,619,611 · +21.5%
- By 2050
- 4,026,915 · +35.1%
- By 2075
- 4,957,073 · +66.4%
- By 2100
- 5,508,725 · +84.9%
Race, ethnicity, and origin ACS 2023
- Neighborhood character
- Highly diverse neighborhood (Simpson 0.74)
- Race & ethnicity
- Hispanic / Latino 33% White 29% Black 24% Two or more races 13% Asian 9%
- Hispanic origin (detail)
- Mexican 26%
- Common ancestry
- Slovak 1% Lithuanian 1% Romanian 1%
- Foreign-born
- 29% · Canada, Philippines, India
- Languages at home
- 57% English-only · Spanish 27% Other Asian/Pacific 4% Other Indo-European 3%
Political lean MEDSL · Dallas
- 2024 margin
- Strong D (+22.2) · D 60.2% · R 38.0% · Other 1.8%
- 2008→2024 swing
- +6.9pp toward D · 2008: 15.3pp · 2024: 22.2pp
- All cycles
- 2024: D+22.2 2020: D+31.6 2016: D+26.2 2012: D+15.4 2008: D+15.3
Not yet ingested
- Civics
- —
Market trends
- HPI YoY
- ▼ -359.41%
- Current HPI
- 249.5841
- Rent YoY
- ▲ 1.96%
- Metro
- Dallas-Fort Worth-Arlington, TX
- State GDP YoY
- ▲ 3.95%
- F500 in state
- 110
Industry mix (Fortune 500 HQ in TX)
| Industry | F500 HQs | Revenue |
|---|---|---|
| Energy | 16 | $1,198B |
|
||
| Technology | 5 | $198B |
|
||
| Engineering / Construction | 4 | $72B |
|
||
| Energy Services | 3 | $60B |
|
||
| Utilities | 3 | $41B |
|
||
| Healthcare | 2 | $330B |
|
||
Price history
-19.0% since first listed23 events — show timeline
- 2026-05-07 Price Changed $64,000 NTREIS
- 2026-03-15 Relisted — NTREIS
- 2026-03-12 Contingent — NTREIS
- 2026-03-06 Listed $69,000 NTREIS
- 2026-02-28 Listing Removed — NTREIS
- 2025-12-11 Relisted — NTREIS
- 2025-12-10 Contingent — NTREIS
- 2025-11-21 Price Changed $69,500 NTREIS
- 2025-10-17 Listing Removed — NTREIS
- 2025-10-17 Listed $75,000 NTREIS
- 2025-09-25 Rental Removed $849 NTREIS
- 2025-09-19 Listed $79,000 NTREIS
- 2025-08-23 Listed for Rent $849 NTREIS
- 2025-08-23 Rental Removed $825 SHOWMOJO
- 2025-08-21 Listed for Rent $825 SHOWMOJO
- 2025-08-01 Rental Removed $849 NTREIS
- 2025-07-15 Price Changed $849 NTREIS
- 2025-06-18 Price Changed $850 NTREIS
- 2025-05-13 Price Changed $895 NTREIS
- 2025-04-25 Listed for Rent $925 NTREIS
- 2025-04-25 Rental Removed $925 SHOWMOJO
- 2025-04-17 Listed for Rent $925 SHOWMOJO
- 1987-02-13 Sold (Public Records) — Public Records
Property tax history
+7.2%/yrLatest (2025): $1,806 · -6.0% YoY. Source: county tax records.
Cash-flow waterfall
monthlySold comps — $/sqft
last 12 mo · ≤1 miLoading sold comps…