3938 Surfside Blvd #1316 · Corpus Christi, TX
Flood risk No data
- FEMA flood zone
- —
- Chance of flooding over 30 yrs
- —
- Est. flood insurance / yr
- —
Fire risk No data
- Est. fire insurance / yr
- —
Heat risk No data
- Hot days now (above threshold)
- —
- Hot days in 30 yrs
- —
Wind risk No data
- Chance of severe wind over 30 yrs
- —
Air-quality risk No data
- Unhealthy air days now
- —
- Unhealthy air days in 30 yrs
- —
Risk factors via First Street. Map © Google.
Why this score? — see what drove the F grade
The composite is a weighted blend of 9 inputs, each scored 0–100. Each bar is that input's sub-score; the figure is the points it added to the 100-point composite (weight × sub-score).
- 1% rule +10.0/10.0
- Cash flow +4.6/30.0
- Livability +3.9/5.0
- Schools +2.8/10.0
- Rent growth +2.5/5.0
- Condition / age +2.5/5.0
- Appreciation +0.1/10.0
- DSCR +0.0/10.0
- ARV discount +0.0/15.0
$64,500
🖨 Deal sheet (PDF) 📄 Offer letter ✓ Due diligence
Listing remarks
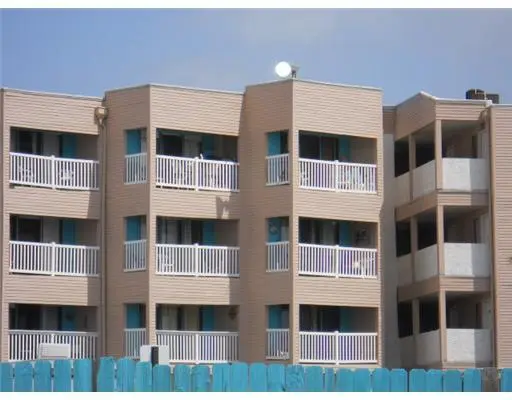
Whether you are looking for a primary residence, a short-term rental investment, or the perfect vacation/weekend getaway, this furnished condo checks all the boxes. Enjoy incredible Bay views from your private balcony or living/kitchen area, beach walks and refreshing swims-at no cost. . Just bring your personal items and settle in. The unit comfortably sleeps six, featuring a primary bedroom, hallway bunk beds, and a pull out sofa. The kitchenette is equipped with an electric stove, island with storage under it & 3 bar stools, beautiful tile back splash, microwave, and refrigerator, plus a separate coffee area-perfect for sipping your morning brew on the private balcony while watchin
Key facts
- Kitchenette
- Private balcony
- Tile back splash
Tags
Neighborhood map
What this means for you Summary
Snapshot
- This is a 1-bed/1.0-bath townhouse listed at $64k.
Deal economics
- At list price, monthly cash flow is $-164 ($-2k/yr) — negative.
- To cash-flow at today's rent, offer at most $35k (45.0% below list).
- Meets the 1% rule at list price ($1k rent vs $64k).
- Recommended offer: $35k (45.0% below list) — sets the bar for cash-flow.
Location & tenants
- Location reads 78/100 on livability (#66 in TX, #2,404 nationally) — a middle-class / working-renter tenant base. Strengths: commute A+, cost of living A+, housing A+; Watch: crime F.
- Corpus Christi ISD (urban): math 31% / reading 35% proficiency, ranked #562 of 826 in TX (top 68%) — families likely to look elsewhere, expect single-tenant / working-renter base with shorter leases; 63% free/reduced lunch — lower-income household profile, screen leases tightly.
- Zoned schools: Windsor Park G/T (math 85% / reading 90%, grade A+, #6 of 4,322 statewide, top 0%, 609 students, 29% FRL); Adkins Middle (math 40% / reading 39%, grade F, #660 of 1,662 statewide, top 41%, 956 students, 48% FRL); Roy Miller H S And Metro School of Design (math 24% / reading 32%, grade F, #1,170 of 1,632 statewide, top 72%, 1,538 students, 88% FRL).
- Zoned-school proficiency averages 52% at this address vs 33% district-wide (+19 pts) — the actual schools serving this property are materially stronger than the Corpus Christi ISD average implies; a family-tenant draw the district grade alone would hide.
- Market conditions: 76 active listings in the ZIP; 1,397 units permitted in Nueces County in 2024 (47 in 5+ unit buildings).
Forward outlook
- Local home prices are declining (-3.0%/yr); year-one equity from $446 of loan paydown is wiped out by about $2k of value loss. Plan a longer hold.
- Nueces County population projected at +36% by 2050 — long-run rental-demand tailwind backs the buy-and-hold thesis.
Negotiation context
- It's been on market 84 days — a 6% lower offer ($61k) is reasonable based on typical stale-listing flexibility.
- 5 sale attempts since 20y ago; this cycle's ask has dropped $31k (32%) from the opening price — seller is motivated, your offer sets the floor, not the list.
- Current owner paid $33k; list at $64k implies a 94% gain — meaningful room to come down on a strong offer.
Risks & watch-outs
- Watch-outs: property tax is 2.7% of price; HOA is 49% of rent.
Questions for the listing agent
- What do current leases actually rent for vs. the listed asking? Can we see a recent rent roll and the last 12 months of T-12 income?
- It's been on market 84 days. Have you received any prior offers? Is the seller open to a 45% concession, seller financing, or rate buy-down credit?
- Property tax is high relative to price — has the assessment been appealed recently, and will the sale trigger a re-assessment?
- What does the HOA fee cover, when was the last increase, and are there any pending special assessments or reserve-fund shortfalls?
- Why hasn't it sold? Are there any deal-killer items the seller is aware of (foundation, flood, title, zoning, code violations)?
- Is there a deadline driving the sale (1031 exchange, divorce, estate, relocation)? That informs how much negotiation room exists.
- Crime grade is F in this area — have there been break-ins, vandalism, or insurance claims at this property in the last 3 years? What carrier currently insures it and at what premium?
- The area grade is low — what's the realistic commute time and amenity access for the typical tenant pool here? Any planned neighborhood developments (good or bad) we should know about?
- What's the average days-on-market for RENTAL listings here right now (not sales)? A rising rental-DOM trend means longer vacancies and softer asking-rent achievability than the comps imply.
- What's the recent tenant-quality profile in this submarket — average credit score on applications, eviction rate, late-payment / NSF rate, and stable-employment percentage? A property-management company in the area should have these aggregated.
- How much new for-sale + rental construction is in the pipeline within 1–3 miles? Heavy new supply typically softens prices + rents 12–24 months out; constrained supply supports both.
Investment metrics
- 1% rule
- 1.81% ✓
- Cap rate
- 3.24%
- Cash-on-cash
- -10.91%
- DSCR
- 0.51
- GRM
- 4.6
CMA / ARV
- ARV (on-the-fly)
- $49,980
- Comps found
- 12
Show comp detail 12 sales within ~0.75 mi
| Address | Dist | Beds/Ba | Sqft | Sold | Price | $/sf | Match |
|---|---|---|---|---|---|---|---|
| 3938 Surfside Blvd #1316 | 0.00mi | 1/1.0 | 420 (0%) | 1mo | $64,500 | $154 | 99 |
| 3938 Surfside Blvd #1219 | 0.01mi | 1/1.0 | 420 (0%) | 1mo | $44,900 | $107 | 99 |
| 3938 Surfside Blvd #1225 | 0.01mi | 1/1.0 | 420 (0%) | 2mo | $50,000 | $119 | 98 |
| 3938 Surfside Blvd #3225 | 0.04mi | 1/1.0 | 420 (0%) | 1mo | $39,900 | $95 | 98 |
| 3938 Surfside Blvd #1207 | 0.02mi | 1/1.0 | 420 (0%) | 2mo | $50,000 | $119 | 97 |
| 3938 Surfside Blvd #1327 | 0.02mi | 1/1.0 | 420 (0%) | 2mo | $50,000 | $119 | 97 |
| 3938 Surfside Blvd #3224 | 0.04mi | 1/1.0 | 420 (0%) | 1mo | $55,000 | $131 | 97 |
| 3938 Surfside Blvd #2327 | 0.05mi | 1/1.0 | 420 (0%) | 1mo | $58,000 | $138 | 97 |
| 3938 Surfside Blvd #3114 | 0.05mi | 1/1.0 | 420 (0%) | 2mo | $45,000 | $107 | 96 |
| 3938 Surfside Blvd #3342 | 0.04mi | 1/1.0 | 420 (0%) | 2mo | $62,000 | $148 | 96 |
| 3938 Surfside Blvd #2332 | 0.05mi | 1/1.0 | 420 (0%) | 2mo | $48,000 | $114 | 96 |
| 3938 Surfside Blvd #2305 | 0.05mi | 1/1.0 | 418 (-0%) | 3mo | $100,000 | $239 | 94 |
Match score weights: distance 35% · size 25% · config 20% · recency 20%. Top-matched comps best support the ARV.
Projected returns pro-forma
-3.0% appreciation · 3.0% rent growth · sell at horizon
- IRR
- -34.9%
- Equity multiple
- -0.13×
- Total profit
- $-20,497
- Equity at exit
- $9,617
- IRR
- -39.5%
- Equity multiple
- -0.64×
- Total profit
- $-29,640
- Equity at exit
- $5,577
Cash invested: $18,060 (down + closing). Projections, not guarantees.
Landlord ↔ Tenant lean methodology
- Overall (STATE)
- 87 Strongly Landlord-Friendly
- State Texas
- 87 Strongly Landlord-Friendly · R+5
- County
- — inherits STATE
- City
- — inherits STATE
ZIP-level market 78402
- Home prices YoY
- -8.8%
- Active inventory
- 76
- Price-to-rent
- 4.6×
Monthly cashflow live
- Estimated rent
- $1,169 medium interval (Pro) →
- Mortgage (P&I)
- −$338
- Tax from tax record
- −$148 /mo · $1,771/yr
- Insurance
- −$27
- HOA
- −$575
- Lot rent
- −$0
- Vacancy / Maint / Mgmt
- −$245
- Net cashflow
- $-164
Break-even live
Sensitivity live
| Price | -10% $-128 | -5% $-146 | +0% $-164 | +5% $-182 | +10% $-201 |
|---|---|---|---|---|---|
| Rent | -10% $-257 | -5% $-210 | +0% $-164 | +5% $-118 | +10% $-72 |
| Rate | -1.0pp $-132 | -0.5pp $-148 | base $-164 | +0.5pp $-181 | +1.0pp $-198 |
UW: 25.0% down · 7.5% · 30yr · 1.5% tax · 5.0% vac · 8.0% maint · 8.0% mgmt
Financing live
Cash to close
- Down payment
- $16,125
- Closing costs
- $1,935
- Reserves months
- —
- Total cash needed
- —
Loan-product check · same deal, 3 products live
Conventional
25% down · 7.5% · 30yr
- Down + closing
- —
- Monthly P&I
- —
- Monthly cashflow
- —
- DSCR
- —
- Eligible?
- —
Personal DTI + credit; lowest rate.
DSCR
20% down · 8.5% · 30yr
- Down + closing
- —
- Monthly P&I
- —
- Monthly cashflow
- —
- DSCR
- —
- Eligible?
- —
No personal income docs; deal must DSCR.
Hard money
10% down · 12.0% · 12mo
- Down + closing
- —
- Monthly P&I
- —
- Monthly cashflow
- —
- DSCR
- —
- Eligible?
- —
Short-term bridge; refi at stabilization.
HOA detail
- Monthly dues
- $575 · $6,900/yr
- Likely covers
- electric
Listing history 16 events
-
2026-01-01historical
-
2025-11-23price $84,900
-
2025-07-10price $89,500
-
2025-06-01$89,500 Active
-
2025-06-01$95,500 Active
-
2016-03-18soldstatus
-
2011-11-10soldstatus
-
2011-06-13soldstatus
-
2011-04-29$33,100
-
2010-06-17soldstatus $33,300
-
2008-09-03$51,900
-
2006-11-22soldstatus
-
2006-11-17soldstatus
-
2006-09-15$68,900
-
2005-09-26soldstatus
-
1999-06-23soldstatus $35,000
ⓘ Source: listings_history table (triggers on properties + properties_extension) + one-shot
backfill from property_details.listing_events for pre-trigger history.
Tax reassessment forecast TX · Resets to sale price
- Current annual tax
- $1,771 · $148/mo
- Projected year-2 tax
- $1,771 · $148/mo
- Expected delta
- $0/yr ($0/mo · 0.0%)
ⓘ Screening estimate from a state-policy table — verify with the county assessor before closing.
Nearby sold comps map
Loading sold comps map…
Walkable amenities ~0.75 mi
Loading nearby amenities…
Taxation est. · year 1
- Rental income
- $14,028
- − Mortgage interest
- −$3,613
- − Property taxes
- −$1,771
- − Insurance
- −$322
- − Repairs & maintenance
- −$1,122
- − Management
- −$1,122
- − HOA
- −$6,900
- − Depreciation
- −$1,876
- Taxable loss
- −$2,699
- Est. tax savings @ 24.0%
- +$648
- After-tax cash flow
- $-1,322/yr
For passive investors: Depreciation is non-cash, so a rental often shows a tax loss while cash-flowing — sheltering income. Rental losses are passive: they offset passive income freely, and up to $25,000/yr can offset ordinary (W-2) income if you actively participate and your MAGI is under $100k (phasing out to $0 by $150k); unused losses carry forward. On sale, claimed depreciation is recaptured at up to 25%, and gains may owe capital-gains tax (a 1031 exchange can defer both). Figures are a year-1 estimate at your 24.0% rate — not tax advice; consult a CPA.
Schools (NCES district)
- District
- Corpus Christi ISD
- NCES district ID
- 4815270
- Math proficiency
- 31% ▼ -18.00%
- Reading proficiency
- 35% ▼ -7.00%
- Median HH income
- $45,672
- Composite
- 28.27/100
- National rank
- #6793
- State rank
- #562 of 826 in TX
Livability — Corpus Christi
- Score
- 78/100
- State rank
- #66
- US rank
- #2404
Category grades
Schools grade is shown separately in the Schools card above.
Census & demographics
- Census place
- Corpus Christi, TX
- City population
- 296,836
- Population (ZIP)
- 392
Population outlook (Nueces County) Hauer SSP2
- Today (2025)
- 418,037 people
- By 2030
- 447,123 · +7.0%
- By 2040
- 505,911 · +21.0%
- By 2050
- 567,522 · +35.8%
- By 2075
- 729,686 · +74.6%
- By 2100
- 847,087 · +102.6%
Race, ethnicity, and origin ACS 2023
- Neighborhood character
- Diverse neighborhood (Simpson 0.57)
- Race & ethnicity
- White 62% Hispanic / Latino 19% Two or more races 17% Black 9%
- Hispanic origin (detail)
- Mexican 16%
- Common ancestry
- Slovak 2%
- Foreign-born
- 3% · Canada
- Languages at home
- 91% English-only · Spanish 7% German/W. Germanic 2%
Political lean MEDSL · Nueces
- 2024 margin
- R (+11.5) · D 43.8% · R 55.3%
- 2008→2024 swing
- -7.1pp toward R · 2008: -4.4pp · 2024: -11.5pp
- All cycles
- 2024: R+11.5 2020: R+2.9 2016: R+1.5 2012: R+3.2 2008: R+4.4
Not yet ingested
- Civics
- —
Market trends
- HPI YoY
- ▼ -9.74%
- Current HPI
- 101.5421
- Rent YoY
- —
- Metro
- —
- State GDP YoY
- ▲ 3.95%
- F500 in state
- 110
Industry mix (Fortune 500 HQ in TX)
| Industry | F500 HQs | Revenue |
|---|---|---|
| Energy | 16 | $1,198B |
|
||
| Technology | 5 | $198B |
|
||
| Engineering / Construction | 4 | $72B |
|
||
| Energy Services | 3 | $60B |
|
||
| Utilities | 3 | $41B |
|
||
| Healthcare | 2 | $330B |
|
||
Price history
+142.6% since first listed16 events — show timeline
- 2026-01-01 Delisted — CBMLS
- 2025-11-23 Price Changed $84,900 CBMLS
- 2025-07-10 Price Changed $89,500 CBMLS
- 2025-06-01 Listed $95,500 CBMLS
- 2025-06-01 Listed $89,500 CBMLS
- 2016-03-18 Sold (Public Records) — Public Records
- 2011-11-10 Sold (Public Records) — Public Records
- 2011-06-13 Sold (MLS) — CBMLS
- 2011-04-29 Listed $33,100 CBMLS
- 2010-06-17 Sold (Public Records) $33,300 Public Records
- 2008-09-03 Listed $51,900 CBMLS
- 2006-11-22 Sold (Public Records) — Public Records
- 2006-11-17 Sold (MLS) — CBMLS
- 2006-09-15 Listed $68,900 CBMLS
- 2005-09-26 Sold (Public Records) — Public Records
- 1999-06-23 Sold (Public Records) $35,000 Public Records
Property tax history
+6.6%/yrLatest (2025): $1,771 · -25.6% YoY. Source: county tax records.
Cash-flow waterfall
monthlySold comps — $/sqft
last 12 mo · ≤1 miLoading sold comps…