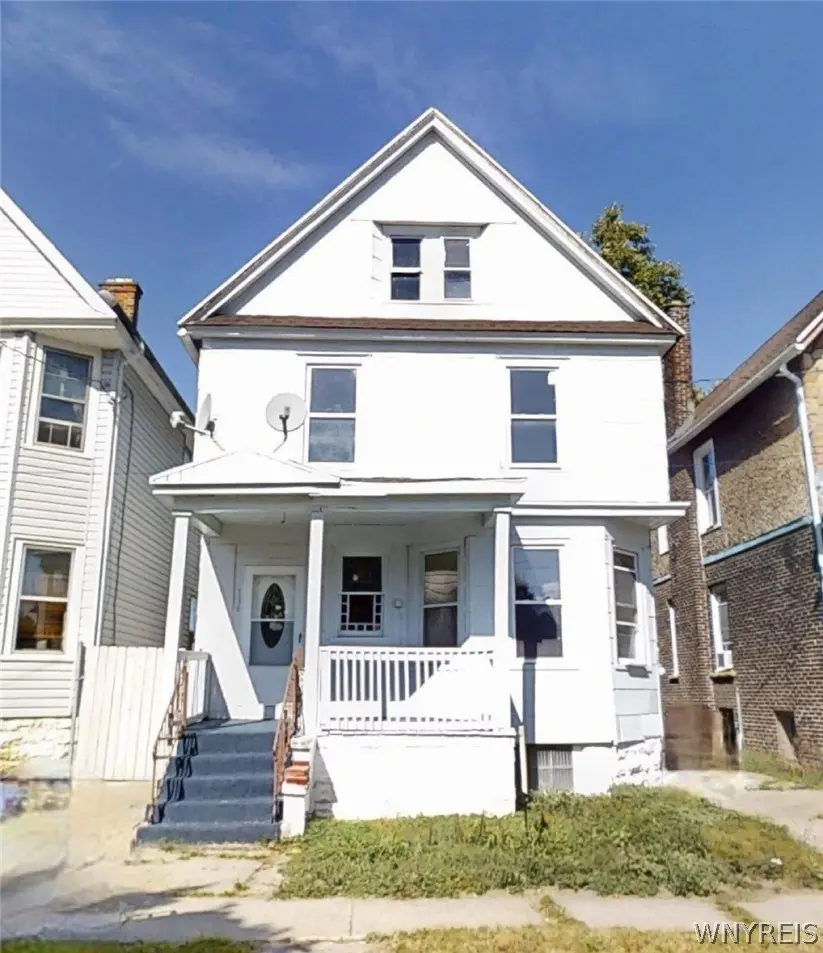
114 Spaulding St · Buffalo, NY
Flood risk 7/10 · Major
- FEMA flood zone
- X (shaded)
- Chance of flooding over 30 yrs
- 0.77%
- Est. flood insurance / yr
- $473 – $860
Fire risk 1/10 · Minimal
- Est. fire insurance / yr
- $691 – $1,283
Heat risk 3/10 · Minor
- Hot days now (above 92°F)
- 7 days/yr
- Hot days in 30 yrs
- 15 days/yr
Wind risk 1/10 · Minimal
- Chance of severe wind over 30 yrs
- —
Air-quality risk 3/10 · Minor
- Unhealthy air days now
- 2 days/yr
- Unhealthy air days in 30 yrs
- 3 days/yr
Risk factors via First Street. Map © Google.
Why this score? — see what drove the D+ grade
The composite is a weighted blend of 9 inputs, each scored 0–100. Each bar is that input's sub-score; the figure is the points it added to the 100-point composite (weight × sub-score).
- ARV discount +15.0/15.0
- Cash flow +11.7/30.0
- Rent growth +4.4/5.0
- Livability +3.9/5.0
- 1% rule +3.4/10.0
- DSCR +3.4/10.0
- Schools +3.3/10.0
- Condition / age +2.5/5.0
- Appreciation +0.0/10.0
$162,000
🖨 Deal sheet (PDF) 📄 Offer letter ✓ Due diligence
Listing remarks MLS
Welcome to 114 Spaulding has 4 large bedrooms and 1.5 bathrooms. Kitchen Appliances are brand new and are included in sale. New Fencing in backyard, New Flooring Newly remodeled half bath on first floor and so much more. This South Buffalo home has many new updates. There is a full basement and full attic. There is a cute fenced in back yard and detached car garage. Low taxes!
Key facts
- New fencing
- New flooring
- Full basement
Tags
Neighborhood map
What this means for you Summary
Snapshot
- This is a 3-bed/1.0-bath single-family listed at $162k.
Deal economics
- At list price, monthly cash flow is $-104 ($-1k/yr) — negative.
- To cash-flow at today's rent, offer at most $147k (9.3% below list).
- To meet the 1% rule (rent ≥ 1% of price), the offer needs to be $136k (16.3% below list).
- Recommended offer: $136k (16.3% below list) — sets the bar for 1% rule.
- Cap rate 5.9% vs local median 8.0% in Buffalo — below-typical yield; the buyer is paying a premium for something (appreciation thesis, condition, location) that the cap rate doesn't capture.
Location & tenants
- Location reads 77/100 on livability (#195 in NY, #3,011 nationally) — a middle-class / working-renter tenant base. Strengths: commute A+, housing A+, health & safety A+; Watch: crime F, employment D-.
- Buffalo City School District (urban): math 41% / reading 40% proficiency, ranked #535 of 590 in NY (top 91%) — families likely to look elsewhere, expect single-tenant / working-renter base with shorter leases; 75% free/reduced lunch — lower-income household profile, screen leases tightly.
- Zoned schools: International School (math 8% / reading 17%, grade F, #2,048 of 2,108 statewide, top 97%, 981 students, 92% FRL); Hutchinson Central Technical High School (math 96% / reading 32%, grade B-, #807 of 1,100 statewide, top 73%, 1,175 students, 78% FRL).
- Market conditions: Rents rising fast (+7.6%/yr); 138 active listings in the ZIP; 14 comparable units currently listed for rent nearby; rentals at typical pace (median 16d on market — plan ~3-4 weeks tenant-placement turnaround); 1,244 units permitted in Erie County in 2024 (563 in 5+ unit buildings).
Forward outlook
- Local home prices are declining (-3.0%/yr); year-one equity from $1k of loan paydown is wiped out by about $5k of value loss. Plan a longer hold.
Negotiation context
- It's been on market 104 days — a 9% lower offer ($147k) is reasonable based on typical stale-listing flexibility.
- 8 sale attempts since 3y ago with the ask held roughly flat each time — persistent listings suggest the price (not the market) is what's stuck; bring a comps-based counter.
- Current owner paid $75k; list at $162k implies a 116% gain — meaningful room to come down on a strong offer.
Risks & watch-outs
- Watch-outs: flood insurance adds $56/mo; built in 1925 — expect roof / HVAC / electrical / plumbing capex.
- Climate carrying-cost: major flood risk — expect insurance premiums to compound above CPI over the hold.
Questions for the listing agent
- What do current leases actually rent for vs. the listed asking? Can we see a recent rent roll and the last 12 months of T-12 income?
- It's been on market 104 days. Have you received any prior offers? Is the seller open to a 16% concession, seller financing, or rate buy-down credit?
- Built in 1925 — when were the roof, HVAC, electrical panel, plumbing, and water heater last replaced?
- What's the actual annual flood-insurance premium (NFIP or private), and is the property in a SFHA with mandatory coverage?
- Why hasn't it sold? Are there any deal-killer items the seller is aware of (foundation, flood, title, zoning, code violations)?
- Is there a deadline driving the sale (1031 exchange, divorce, estate, relocation)? That informs how much negotiation room exists.
- Crime grade is F in this area — have there been break-ins, vandalism, or insurance claims at this property in the last 3 years? What carrier currently insures it and at what premium?
- The area grade is low — what's the realistic commute time and amenity access for the typical tenant pool here? Any planned neighborhood developments (good or bad) we should know about?
- What's the average days-on-market for RENTAL listings here right now (not sales)? A rising rental-DOM trend means longer vacancies and softer asking-rent achievability than the comps imply.
- What's the recent tenant-quality profile in this submarket — average credit score on applications, eviction rate, late-payment / NSF rate, and stable-employment percentage? A property-management company in the area should have these aggregated.
- How much new for-sale + rental construction is in the pipeline within 1–3 miles? Heavy new supply typically softens prices + rents 12–24 months out; constrained supply supports both.
Investment metrics
- 1% rule
- 0.84% ✗
- Cap rate
- 5.93%
- Cash-on-cash
- -1.28%
- DSCR
- 0.94
- GRM
- 10.0
CMA / ARV
- ARV (median comp)
- $210,212
- List price
- $162,000
- Delta
- -22.93%
- Verdict
- UNDERPRICED
- Comps
- 20 within 1.0 mi
Show comp detail 12 sales within ~0.75 mi
| Address | Dist | Beds/Ba | Sqft | Sold | Price | $/sf | Match |
|---|---|---|---|---|---|---|---|
| 37 Houston St | 0.16mi | 4/2.0 (+1) | 1,350 (-1%) | 6mo | $241,000 | $179 | 77 |
| 623 Hopkins St | 0.20mi | 4/1.5 (+1) | 1,431 (+4%) | 6mo | $104,000 | $73 | 71 |
| 40 Remington Pl | 0.56mi | 3/1.0 | 1,413 (+3%) | 6mo | $215,000 | $152 | 64 |
| 59 Hammerschmidt Ave | 0.66mi | 3/1.0 | 1,405 (+3%) | 2mo | $232,500 | $165 | 64 |
| 417 Abbott Rd | 0.62mi | 3/2.0 | 1,350 (-1%) | 4mo | $223,000 | $165 | 61 |
| 39 Crystal Ave | 0.57mi | 3/1.0 | 1,248 (-9%) | 0mo | $212,000 | $170 | 58 |
| 29 Garvey Ave | 0.40mi | 3/1.0 | 1,183 (-14%) | 4mo | $225,000 | $190 | 55 |
| 330 Cumberland Ave | 0.74mi | 3/1.5 | 1,321 (-4%) | 6mo | $217,000 | $164 | 53 |
| 30 Amber St | 0.61mi | 3/1.0 | 1,515 (+11%) | 1mo | $196,000 | $129 | 53 |
| 109 Stevenson St | 0.59mi | 3/1.0 | 1,500 (+10%) | 6mo | $230,000 | $153 | 52 |
| 66 Choate Ave | 0.72mi | 4/1.5 (+1) | 1,449 (+6%) | 2mo | $245,066 | $169 | 48 |
| 67 Lockwood Ave | 0.68mi | 3/1.0 | 1,232 (-10%) | 5mo | $232,000 | $188 | 47 |
Match score weights: distance 35% · size 25% · config 20% · recency 20%. Top-matched comps best support the ARV.
Projected returns pro-forma
-3.0% appreciation · 7.62% rent growth · sell at horizon
- IRR
- -15.6%
- Equity multiple
- 0.42×
- Total profit
- $-26,219
- Equity at exit
- $24,155
- IRR
- -0.4%
- Equity multiple
- 0.97×
- Total profit
- $-1,350
- Equity at exit
- $14,007
Cash invested: $45,360 (down + closing). Projections, not guarantees.
Landlord ↔ Tenant lean methodology
- Overall (STATE)
- 15 Strongly Tenant-Friendly
- State New York
- 15 Strongly Tenant-Friendly · D+10
- County
- — inherits STATE
- City
- — inherits STATE
ZIP-level market 14220
- Home prices YoY
- -26.7%
- Rents YoY
- 7.6%
- Active inventory
- 138
- Price-to-rent
- 10.0×
Monthly cashflow live
- Estimated rent
- $1,356 high interval (Pro) →
- Mortgage (P&I)
- −$850
- Tax est. 1.5%
- −$202 /mo · $2,430/yr
- Insurance
- −$68
- Flood insurance flood zone
- −$56 /mo · $666/yr
- HOA
- −$0
- Vacancy / Maint / Mgmt
- −$285
- Net cashflow
- $-104
Break-even live
Sensitivity live
| Price | -10% $8 | -5% $-48 | +0% $-104 | +5% $-160 | +10% $-216 |
|---|---|---|---|---|---|
| Rent | -10% $-211 | -5% $-157 | +0% $-104 | +5% $-50 | +10% $3 |
| Rate | -1.0pp $-22 | -0.5pp $-63 | base $-104 | +0.5pp $-146 | +1.0pp $-189 |
UW: 25.0% down · 7.5% · 30yr · 1.5% tax · 5.0% vac · 8.0% maint · 8.0% mgmt
Financing live
Cash to close
- Down payment
- $40,500
- Closing costs
- $4,860
- Reserves months
- —
- Total cash needed
- —
Loan-product check · same deal, 3 products live
Conventional
25% down · 7.5% · 30yr
- Down + closing
- —
- Monthly P&I
- —
- Monthly cashflow
- —
- DSCR
- —
- Eligible?
- —
Personal DTI + credit; lowest rate.
DSCR
20% down · 8.5% · 30yr
- Down + closing
- —
- Monthly P&I
- —
- Monthly cashflow
- —
- DSCR
- —
- Eligible?
- —
No personal income docs; deal must DSCR.
Hard money
10% down · 12.0% · 12mo
- Down + closing
- —
- Monthly P&I
- —
- Monthly cashflow
- —
- DSCR
- —
- Eligible?
- —
Short-term bridge; refi at stabilization.
Rent comps 14 comps
| Address | Beds | Baths | Sqft | Rent | $/sqft | DOM | Units | Dist |
|---|---|---|---|---|---|---|---|---|
| 89 Macamley St #2 Buffalo, NY | 3.0 | 1.0 | 1274 | $1,100 | $0.86 | 12d | 1 | 0.10mi |
| 700 Hopkins St Buffalo, NY | 3.0 | 1.0 | 1100 | $1,225 | $1.11 | 16d | 1 | 0.30mi |
| 214 Abbott Rd Unit 2 Buffalo, NY | 2.0 | 1.0 | 945 | $1,200 | $1.27 | 16d | 1 | 0.34mi |
| 76 Hammerschmidt Ave Buffalo, NY | 3.0 | 1.0 | 1200 | $1,275 | $1.06 | 3d | 1 | 0.66mi |
| 298 Cumberland Ave Buffalo, NY | 3.0 | 1.5 | 1208 | $2,200 | $1.82 | 3d | 1 | 0.68mi |
| 86 Edgewood Ave Buffalo, NY | 2.0 | 2.0 | 1700 | $1,700 | $1.00 | 3d | 1 | 0.71mi |
| 1899 Seneca St Buffalo, NY | 3.0 | 1.0 | 1134 | $1,075 | $0.95 | 16d | 1 | 0.77mi |
| 1927 Seneca St Buffalo, NY | 3.0 | 1.0 | 1196 | $1,250 | $1.05 | 25d | 1 | 0.79mi |
| 74 Woodside Ave Unit 1 Buffalo, NY | 3.0 | 1.0 | 1250 | $1,510 | $1.21 | 3d | 1 | 0.89mi |
| 34 Hayden St Unit Back Buffalo, NY | 3.0 | 1.0 | 1200 | $1,600 | $1.33 | 45d | 1 | 0.90mi |
| 2111 Seneca St #3 Buffalo, NY | 2.0 | 1.0 | 937 | $1,150 | $1.23 | 45d | 1 | 0.96mi |
| 47 Lester St Unit Main Floor Buffalo, NY | 3.0 | 1.0 | 900 | $1,000 | $1.11 | 45d | 1 | 1.08mi |
| 23 Indian Orchard Pl Unit Lower Buffalo, NY | 3.0 | 1.0 | 1200 | $1,250 | $1.04 | 45d | 1 | 1.27mi |
| 901 S Park Ave Unit Lower Buffalo, NY | 4.0 | 1.0 | 1729 | $1,600 | $0.93 | 25d | 1 | 1.34mi |
Listing history 37 events
-
2026-06-21days on market $162,000 Active 104 DOM
-
2026-06-18days on market $162,000 Active 101 DOM
-
2026-06-17days on market $162,000 Active 100 DOM
-
2026-06-16days on market $162,000 Active 99 DOM
-
2026-06-15days on market $162,000 Active 98 DOM
-
2026-06-13days on market $162,000 Active 96 DOM
-
2026-06-13days on market $162,000 Active 95 DOM
-
2026-06-10days on market $162,000 Active 93 DOM
-
2026-06-09days on market $162,000 Active 92 DOM
-
2026-06-08days on market $162,000 Active 91 DOM
-
2026-06-07days on market $162,000 Active 90 DOM
-
2026-06-03days on market $162,000 Active 86 DOM
-
2026-06-02days on market $162,000 Active 85 DOM
-
2026-06-01days on market $162,000 Active 84 DOM
-
2026-05-31days on market $162,000 Active 83 DOM
-
2026-04-20status Active 379-char remark
Show marketing remark (379 chars)
Welcome to 114 Spaulding has 4 large bedrooms and 1.5 bathrooms. Kitchen Appliances are brand new and are included in sale. New Fencing in backyard, New Flooring Newly remodeled half bath on first floor and so much more. This South Buffalo home has many new updates. There is a full basement and full attic. There is a cute fenced in back yard and detached car garage. Low taxes!
-
2026-03-09historical Active Under Contract 379-char remark
Show marketing remark (379 chars)
Welcome to 114 Spaulding has 4 large bedrooms and 1.5 bathrooms. Kitchen Appliances are brand new and are included in sale. New Fencing in backyard, New Flooring Newly remodeled half bath on first floor and so much more. This South Buffalo home has many new updates. There is a full basement and full attic. There is a cute fenced in back yard and detached car garage. Low taxes!
-
2026-03-09$162,000 Active 379-char remark
Show marketing remark (379 chars)
Welcome to 114 Spaulding has 4 large bedrooms and 1.5 bathrooms. Kitchen Appliances are brand new and are included in sale. New Fencing in backyard, New Flooring Newly remodeled half bath on first floor and so much more. This South Buffalo home has many new updates. There is a full basement and full attic. There is a cute fenced in back yard and detached car garage. Low taxes!
-
2026-01-28status Pending
-
2026-01-28historical
-
2025-11-11price $162,000
-
2025-10-27price $174,000
-
2025-10-10price $182,000
-
2025-10-08$182,900 Active
-
2025-08-17status Active
-
2025-08-15$189,900 Active
-
2025-03-31historical
-
2025-02-06$194,000 Active
-
2024-08-30soldstatus $75,000 Closed
-
2024-08-30soldstatus $75,000
-
2024-05-15status Pending
-
2024-05-09price $89,998
-
2024-05-02price $89,999
-
2024-04-24$90,000 Active
-
2023-10-08historical
-
2023-06-21price $114,900
-
2023-06-08$129,000 Active
ⓘ Source: listings_history table (triggers on properties + properties_extension) + one-shot
backfill from property_details.listing_events for pre-trigger history.
Climate risk First Street
- Flood 7/10 Severe FEMA zone X (shaded) · 77% chance over 30 yrs
- Wildfire 1/10 Low
- Heat 3/10 Moderate 7 d/yr ≥92°F today · 15 d/yr by 30 yrs out
- Wind 1/10 Low
- Air quality 3/10 Moderate 2 unhealthy d/yr today · 3 by 30 yrs out
Nearby sold comps map
Loading sold comps map…
Walkable amenities ~0.75 mi
Loading nearby amenities…
Taxation est. · year 1
- Rental income
- $16,271
- − Mortgage interest
- −$9,075
- − Property taxes
- −$2,430
- − Insurance
- −$1,476
- − Repairs & maintenance
- −$1,302
- − Management
- −$1,302
- − Depreciation
- −$4,713
- Taxable loss
- −$4,026
- Est. tax savings @ 24.0%
- +$966
- After-tax cash flow
- $-281/yr
For passive investors: Depreciation is non-cash, so a rental often shows a tax loss while cash-flowing — sheltering income. Rental losses are passive: they offset passive income freely, and up to $25,000/yr can offset ordinary (W-2) income if you actively participate and your MAGI is under $100k (phasing out to $0 by $150k); unused losses carry forward. On sale, claimed depreciation is recaptured at up to 25%, and gains may owe capital-gains tax (a 1031 exchange can defer both). Figures are a year-1 estimate at your 24.0% rate — not tax advice; consult a CPA.
Schools (NCES district)
- District
- Buffalo City School District
- NCES district ID
- 3605850
- Math proficiency
- 41% ▲ 11.00%
- Reading proficiency
- 40% ▲ 7.00%
- Median HH income
- $31,665
- Composite
- 33.17/100
- National rank
- #5544
- State rank
- #535 of 590 in NY
Livability — Buffalo
- Score
- 77/100
- State rank
- #195
- US rank
- #3011
Category grades
Schools grade is shown separately in the Schools card above.
Census & demographics
- Census place
- Buffalo, NY
- County
- Erie County · 714,559 people
- City population
- 440,021
- Metro
- Buffalo-Cheektowaga, NY
- Population (ZIP)
- 24,428
- Household income
- $70,963
- Rent vs Own
- Severe rent burden
- 602.0
Population outlook (Erie County) Hauer SSP2
- Today (2025)
- 933,037 people
- By 2030
- 935,181 · +0.2%
- By 2040
- 928,531 · -0.5%
- By 2050
- 905,725 · -2.9%
- By 2075
- 834,037 · -10.6%
- By 2100
- 708,033 · -24.1%
Race, ethnicity, and origin ACS 2023
- Neighborhood character
- Predominantly White (76%)
- Race & ethnicity
- White 76% Hispanic / Latino 13% Two or more races 6% Black 5% Asian 2%
- Hispanic origin (detail)
- Puerto Rican 10% Cuban 1%
- Common ancestry
- Romanian 16% Lithuanian 1% Subsaharan African 1%
- Foreign-born
- 4% · Canada, Jamaica, China
- Languages at home
- 90% English-only · Spanish 4% Chinese 1%
Political lean MEDSL · Erie
- 2024 margin
- Lean D (+9.7) · D 54.8% · R 45.2%
- 2008→2024 swing
- -7.9pp toward R · 2008: 17.5pp · 2024: 9.7pp
- All cycles
- 2024: D+9.7 2020: D+14.7 2016: D+4.8 2012: D+15.6 2008: D+17.5
Not yet ingested
- Civics
- —
Market trends
- HPI YoY
- ▼ -146.29%
- Current HPI
- 402.5053
- Rent YoY
- ▲ 7.62%
- Metro
- Buffalo-Cheektowaga, NY
- State GDP YoY
- ▲ 2.60%
- F500 in state
- 92
Industry mix (Fortune 500 HQ in NY)
| Industry | F500 HQs | Revenue |
|---|---|---|
| Financial Services | 10 | $950B |
|
||
| Consumer Goods | 9 | $162B |
|
||
| Insurance | 4 | $225B |
|
||
| Telecommunications | 2 | $144B |
|
||
| Pharmaceuticals | 2 | $112B |
|
||
| Media / Entertainment | 2 | $69B |
|
||
Price history
+25.6% since first listed22 events — show timeline
- 2026-04-20 Relisted — WNYREIS
- 2026-03-09 Contingent — WNYREIS
- 2026-03-09 Listed $162,000 WNYREIS
- 2026-01-28 Pending — WNYREIS
- 2026-01-28 Listing Removed — WNYREIS
- 2025-11-11 Price Changed $162,000 WNYREIS
- 2025-10-27 Price Changed $174,000 WNYREIS
- 2025-10-10 Price Changed $182,000 WNYREIS
- 2025-10-08 Listed $182,900 WNYREIS
- 2025-08-17 Relisted — WNYREIS
- 2025-08-15 Listed $189,900 WNYREIS
- 2025-03-31 Listing Removed — WNYREIS
- 2025-02-06 Listed $194,000 WNYREIS
- 2024-08-30 Sold (Public Records) $75,000 Public Records
- 2024-08-30 Sold (MLS) $75,000 WNYREIS
- 2024-05-15 Pending — WNYREIS
- 2024-05-09 Price Changed $89,998 WNYREIS
- 2024-05-02 Price Changed $89,999 WNYREIS
- 2024-04-24 Listed $90,000 WNYREIS
- 2023-10-08 Listing Removed — WNYREIS
- 2023-06-21 Price Changed $114,900 WNYREIS
- 2023-06-08 Listed $129,000 WNYREIS
Property tax history
+3.0%/yrLatest (2025): $303 · +0.0% YoY. Source: county tax records.
Cash-flow waterfall
monthlySold comps — $/sqft
last 12 mo · ≤1 miLoading sold comps…