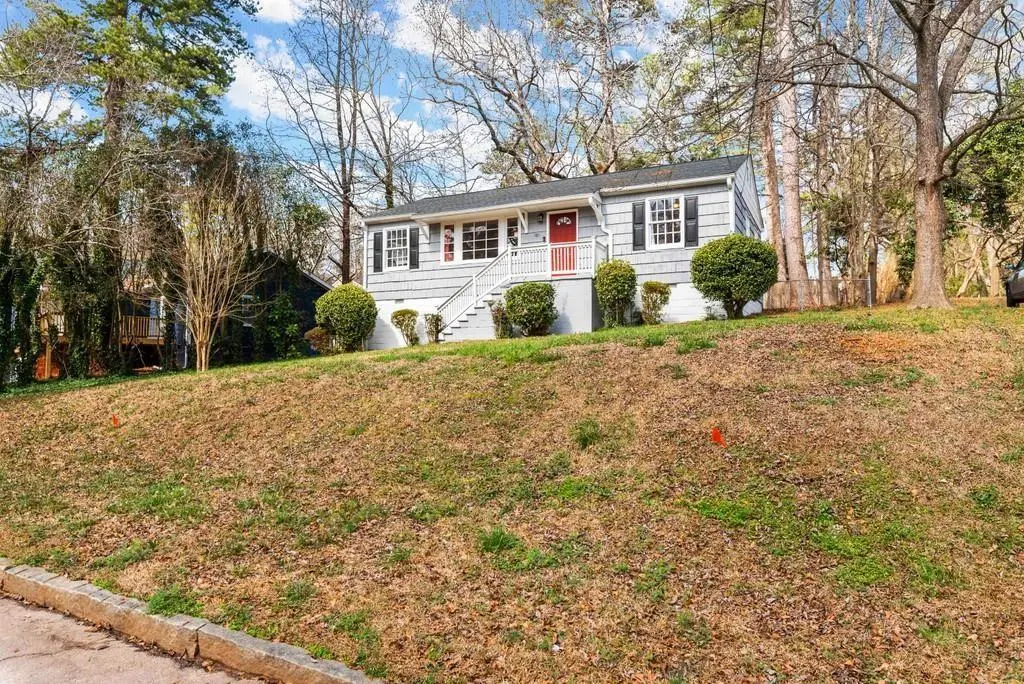
781 Bridgewater St SW · Atlanta, GA
Flood risk 1/10 · Minimal
- FEMA flood zone
- X (unshaded)
- Chance of flooding over 30 yrs
- 0.0%
- Est. flood insurance / yr
- $473 – $860
Fire risk 1/10 · Minimal
- Est. fire insurance / yr
- $963 – $1,789
Heat risk 5/10 · Moderate
- Hot days now (above 104°F)
- 7 days/yr
- Hot days in 30 yrs
- 16 days/yr
Wind risk 6/10 · Moderate
- Chance of severe wind over 30 yrs
- 27.0%
Air-quality risk 4/10 · Minor
- Unhealthy air days now
- 4 days/yr
- Unhealthy air days in 30 yrs
- 6 days/yr
Risk factors via First Street. Map © Google.
Why this score? — see what drove the C- grade
The composite is a weighted blend of 9 inputs, each scored 0–100. Each bar is that input's sub-score; the figure is the points it added to the 100-point composite (weight × sub-score).
- Cash flow +16.3/30.0
- ARV discount +14.1/15.0
- DSCR +5.1/10.0
- Livability +4.2/5.0
- 1% rule +4.0/10.0
- Rent growth +3.2/5.0
- Schools +2.7/10.0
- Condition / age +2.5/5.0
- Appreciation +0.0/10.0
$214,900
🖨 Deal sheet 📄 Offer letter ✓ Due diligence
Listing remarks MLS
Move in ready ranch in POPULAR SYLVAN HILLS neighborhood! This 3 bedroom, 1 bath home has original hardwoods that have been refinished, new paint, NEW water heater and PVC piping and tons of natural light. Enjoy the large open concept living room/dining room and the stainless steel appliances, granite countertops in the kitchen that lead to a spacious screened in patio on a fenced in level backyard. Sylvan Hills is an Official Beltline Neighborhood, blocks away from the Westside Beltline, Perkerson Park, close to downtown & Midtown, Marta. This move in ready character home will not last long!!!
Key facts
- 8,964 sq ft lot
- 3 parking spots
- Built 1950
Neighborhood map
What this means for you Summary
Snapshot
- This is a 3-bed/1.0-bath single-family listed at $215k.
Deal economics
- At list price, monthly cash flow is $118 ($1k/yr) — positive.
- The deal already cash-flows at list — no discount required.
- To meet the 1% rule (rent ≥ 1% of price), the offer needs to be $192k (10.5% below list).
- Recommended offer: $192k (10.5% below list) — sets the bar for 1% rule.
- Cap rate 7.0% vs local median 3.1% in Atlanta — top-decile yield for the area; either an underpriced asset or a hidden risk that comps aren't pricing in. Stress-test before assuming the spread holds.
Location & tenants
- Location reads 83/100 on livability (#6 in GA, #919 nationally) — a professional / high-income tenant draw. Strengths: amenities A+, commute A+, housing A+; Watch: schools C-, cost of living C-.
- Atlanta Public Schools (urban): math 28% / reading 35% proficiency, ranked #80 of 174 in GA (top 46%) — families likely to look elsewhere, expect single-tenant / working-renter base with shorter leases; 71% free/reduced lunch — lower-income household profile, screen leases tightly.
- Market conditions: Rents rising (+2.8%/yr); 452 active listings in the ZIP; 40 comparable units currently listed for rent nearby; rentals at typical pace (median 24d on market — plan ~3-4 weeks tenant-placement turnaround); 11,565 units permitted in Fulton County in 2024 (8,159 in 5+ unit buildings).
- This rent runs 44% of the median local income ($53k/yr) — at the standard rent-burdened threshold; future hikes will face affordability resistance.
Forward outlook
- Local home prices are declining (-3.0%/yr); year-one equity from $1k of loan paydown is wiped out by about $6k of value loss. Plan a longer hold.
- Fulton County population projected at +38% by 2050 — long-run rental-demand tailwind backs the buy-and-hold thesis.
Negotiation context
- It's been on market 45 days — a 3% lower offer ($208k) is reasonable based on typical stale-listing flexibility.
- 10 sale attempts since 15y ago; this cycle's ask has dropped $14k (6%) from the opening price — seller is motivated, your offer sets the floor, not the list.
- Current owner paid $135k; list at $215k implies a 59% gain — meaningful room to come down on a strong offer.
Risks & watch-outs
- Watch-outs: built in 1950 — expect roof / HVAC / electrical / plumbing capex.
- Climate carrying-cost: major wind risk, 27% chance of damaging wind over 30y; extreme-heat days projected 7→16/yr by 2055 (HVAC capex compounding) — expect insurance premiums to compound above CPI over the hold.
Questions for the listing agent
- It's been on market 45 days. Have you received any prior offers? Is the seller open to a 10% concession, seller financing, or rate buy-down credit?
- Built in 1950 — when were the roof, HVAC, electrical panel, plumbing, and water heater last replaced?
- Is there a deadline driving the sale (1031 exchange, divorce, estate, relocation)? That informs how much negotiation room exists.
- What's the average days-on-market for RENTAL listings here right now (not sales)? A rising rental-DOM trend means longer vacancies and softer asking-rent achievability than the comps imply.
- What's the recent tenant-quality profile in this submarket — average credit score on applications, eviction rate, late-payment / NSF rate, and stable-employment percentage? A property-management company in the area should have these aggregated.
- How much new for-sale + rental construction is in the pipeline within 1–3 miles? Heavy new supply typically softens prices + rents 12–24 months out; constrained supply supports both.
Investment metrics
- 1% rule
- 0.90% ✗
- Cap rate
- 6.95%
- Cash-on-cash
- 2.36%
- DSCR
- 1.11
- GRM
- 9.3
CMA / ARV
- ARV (median comp)
- $251,916
- List price
- $214,900
- Delta
- -14.69%
- Verdict
- UNDERPRICED
- Comps
- 20 within 1.0 mi
Show comp detail 12 sales within ~0.75 mi
| Address | Dist | Beds/Ba | Sqft | Sold | Price | $/sf | Match |
|---|---|---|---|---|---|---|---|
| 2026 Lisbon Dr SW | 0.12mi | 3/2.0 | 1,073 (0%) | 4mo | $245,000 | $228 | 87 |
| 1848 Brandywine St SW | 0.16mi | 3/1.0 | 1,149 (+7%) | 0mo | $265,000 | $231 | 80 |
| 1959 Oana St SW | 0.17mi | 3/2.0 | 1,115 (+4%) | 4mo | $245,000 | $220 | 78 |
| 1850 Brewer Blvd SW | 0.17mi | 3/2.0 | 1,080 (+1%) | 13mo | $207,338 | $192 | 76 |
| 779 Casplan St | 0.29mi | 3/1.5 | 1,125 (+5%) | 2mo | $245,000 | $218 | 75 |
| 1750 Lisbon Dr SW | 0.27mi | 3/2.0 | 1,012 (-6%) | 4mo | $132,500 | $131 | 71 |
| 1834 Buckeye St SW | 0.17mi | 3/2.0 | 1,147 (+7%) | 8mo | $240,000 | $209 | 70 |
| 1899 Brandywine St SW | 0.19mi | 3/1.0 | 1,181 (+10%) | 6mo | $253,000 | $214 | 69 |
| 1810 Sylvan Rd | 0.25mi | 3/1.0 | 1,212 (+13%) | 5mo | $178,000 | $147 | 63 |
| 1610 Brewer Blvd | 0.53mi | 2/1.0 (-1) | 1,001 (-7%) | 1mo | $274,000 | $274 | 59 |
| 1059 Osborne St SW | 0.51mi | 3/2.0 | 1,223 (+14%) | 0mo | $265,000 | $217 | 48 |
| 1787 Langston Ave SW | 0.44mi | 2/1.0 (-1) | 928 (-14%) | 9mo | $320,000 | $345 | 44 |
Match score weights: distance 35% · size 25% · config 20% · recency 20%. Top-matched comps best support the ARV.
Projected returns pro-forma
-3.0% appreciation · 2.77% rent growth · sell at horizon
- IRR
- -12.8%
- Equity multiple
- 0.54×
- Total profit
- $-27,749
- Equity at exit
- $32,042
- IRR
- -4.2%
- Equity multiple
- 0.73×
- Total profit
- $-16,359
- Equity at exit
- $18,581
Cash invested: $60,172 (down + closing). Projections, not guarantees.
Landlord ↔ Tenant lean methodology
- Overall (STATE)
- 90 Strongly Landlord-Friendly
- State Georgia
- 90 Strongly Landlord-Friendly · R+3
- County
- — inherits STATE
- City
- — inherits STATE
ZIP-level market 30310
- Home prices YoY
- -32.8%
- Rents YoY
- 2.8%
- Active inventory
- 452
- Price-to-rent
- 9.3×
Monthly cashflow live
- Estimated rent
- $1,924 high interval (Pro) →
- Mortgage (P&I)
- −$1,127
- Tax from tax record
- −$185 /mo · $2,222/yr
- Insurance
- −$90
- HOA
- −$0
- Vacancy / Maint / Mgmt
- −$404
- Net cashflow
- $118
Break-even live
UW: 25.0% down · 7.5% · 30yr · 1.5% tax · 5.0% vac · 8.0% maint · 8.0% mgmt
Financing live
Cash to close
- Down payment
- $53,725
- Closing costs
- $6,447
- Reserves months
- —
- Total cash needed
- —
Loan-product check · same deal, 3 products live
Conventional
25% down · 7.5% · 30yr
- Down + closing
- —
- Monthly P&I
- —
- Monthly cashflow
- —
- DSCR
- —
- Eligible?
- —
Personal DTI + credit; lowest rate.
DSCR
20% down · 8.5% · 30yr
- Down + closing
- —
- Monthly P&I
- —
- Monthly cashflow
- —
- DSCR
- —
- Eligible?
- —
No personal income docs; deal must DSCR.
Hard money
10% down · 12.0% · 12mo
- Down + closing
- —
- Monthly P&I
- —
- Monthly cashflow
- —
- DSCR
- —
- Eligible?
- —
Short-term bridge; refi at stabilization.
Rent comps 40 comps
| Address | Beds | Baths | Sqft | Rent | $/sqft | DOM | Units | Dist |
|---|---|---|---|---|---|---|---|---|
| 1854 Broadwell St SW Atlanta, GA | 3.0 | 1.0 | 1148 | $1,295 | $1.13 | 21d | 1 | 0.03mi |
| 1788 Broadwell St SW Atlanta, GA | 2.0 | 2.0 | 1017 | $1,850 | $1.82 | 24d | 1 | 0.12mi |
| 1790 Brewer Blvd SW Atlanta, GA | 3.0 | 2.0 | 1301 | $2,000 | $1.54 | 21d | 1 | 0.14mi |
| 1782 Cahoon St SW Atlanta, GA | 2.0 | 1.0 | 700 | $1,100 | $1.57 | 24d | 1 | 0.27mi |
| 1780 Cahoon St SW Atlanta, GA | 2.0 | 1.0 | 700 | $1,100 | $1.57 | 24d | 1 | 0.27mi |
| 2021 Brewer Blvd SW Atlanta, GA | 3.0 | 2.0 | 1178 | $1,795 | $1.52 | 7d | 1 | 0.32mi |
| 1734 Cahoon St SW Atlanta, GA | 3.0 | 1.0 | 950 | $1,800 | $1.89 | 24d | 1 | 0.38mi |
| 1026 Astor Ave SW Atlanta, GA | 3.0 | 2.0 | 1116 | $2,500 | $2.24 | 24d | 1 | 0.50mi |
| 2000 Rambling Ln Atlanta, GA | 1.0–3.0 | 1.0–2.0 | 1082 | $1,514 | $1.40 | 1d | 8 | 0.52mi |
| 1645 Metropolitan Pkwy SW Unit A Atlanta, GA | 3.0 | 1.0 | 1433 | $1,795 | $1.25 | 24d | 1 | 0.52mi |
| 1060 Regent St SW Atlanta, GA | 3.0 | 2.0 | 1390 | $2,500 | $1.80 | 24d | 1 | 0.59mi |
| 1729 Evans Dr SW Unit B Atlanta, GA | 2.0 | 1.5 | 1000 | $1,500 | $1.50 | 24d | 1 | 0.62mi |
| 643 Langston Dr SW Atlanta, GA | 3.0 | 2.0 | 1180 | $2,000 | $1.69 | 24d | 1 | 0.64mi |
| 1534 Beatie Ave SW Atlanta, GA | 3.0 | 2.0 | 1050 | $2,050 | $1.95 | 24d | 1 | 0.67mi |
| 1777 Bond Dr SW Atlanta, GA | 4.0 | 1.5 | 1043 | $1,999 | $1.92 | 24d | 1 | 0.72mi |
| 1430 Desoto Ave SW Atlanta, GA | 3.0 | 2.0 | 1224 | $2,200 | $1.80 | 24d | 1 | 0.83mi |
| 751 Yale Pl SW Atlanta, GA | 3.0 | 2.0 | 1230 | $1,499 | $1.22 | 24d | 1 | 0.85mi |
| 745 Yale Pl SW Atlanta, GA | 3.0 | 1.0 | 1048 | $2,200 | $2.10 | 24d | 1 | 0.85mi |
| 2019 Pryor Rd SW Atlanta, GA | 2.0 | 2.5 | 1449 | $2,600 | $1.79 | 24d | 1 | 0.92mi |
| 549 Lynnhaven Dr SW Atlanta, GA | 4.0 | 2.0 | 1215 | $2,450 | $2.02 | 24d | 1 | 0.97mi |
| 969 Arden Ave SW Atlanta, GA | 4.0 | 2.0 | 1380 | $1,850 | $1.34 | 24d | 1 | 0.97mi |
| 200 Guerin Rd Holly Springs, NC | 2.0–3.0 | 1.0–1.5 | 947 | $1,349 | $1.42 | 21d | 1 | 0.99mi |
| 490 Lynnhaven Dr SW Atlanta, GA | 3.0 | 2.0 | 1289 | $2,395 | $1.86 | 4d | 1 | 0.99mi |
| 245 Amal Dr SW #3004 Atlanta, GA | 2.0 | 2.0 | 1402 | $1,800 | $1.28 | 21d | 1 | 1.03mi |
| 825 Erin Ave SW Atlanta, GA | 2.0 | 1.0 | 776 | $3,000 | $3.87 | 24d | 1 | 1.07mi |
| 250 Amal Dr SW #7009 Atlanta, GA | 3.0 | 2.5 | 1440 | $1,850 | $1.28 | 7d | 1 | 1.10mi |
| 2456 Harwood Dr Atlanta, GA | 2.0 | 2.0 | 1176 | $1,995 | $1.70 | 43d | 1 | 1.13mi |
| 1483 Arthur Langford Jr Pl SW Atlanta, GA | 1.0–2.0 | 1.0 | 825 | $900 | $1.09 | 24d | 7 | 1.14mi |
| 1264 Hartford Ave SW Atlanta, GA | 3.0 | 2.0 | 1290 | $1,989 | $1.54 | 24d | 1 | 1.14mi |
| 1246 Allene Ave SW Atlanta, GA | 2.0 | 1.0–2.0 | 896 | $2,110 | $2.35 | 1d | 23 | 1.17mi |
| 1361 McClelland Ave Atlanta, GA | 3.0 | 1.0 | 1468 | $1,500 | $1.02 | 24d | 1 | 1.17mi |
| 1305 Clermont Ave Atlanta, GA | 2.0 | 2.0 | 1000 | $1,750 | $1.75 | 24d | 1 | 1.18mi |
| 547 Erin Ave SW Atlanta, GA | 3.0 | 2.0 | 1400 | $5,000 | $3.57 | 1d | 1 | 1.19mi |
| 547 Erin Ave SW Atlanta, GA | 3.0 | 2.0 | 1394 | $2,600 | $1.87 | 24d | 1 | 1.19mi |
| 518 Erin Ave SW Atlanta, GA | 2.0 | 1.0 | 1075 | $2,500 | $2.33 | 17d | 1 | 1.20mi |
| 1255 Campbellton Rd SW Atlanta, GA | 3.0 | 2.0 | 1305 | $2,095 | $1.61 | 24d | 1 | 1.26mi |
| 1226 Byewood Ln SW Unit B Atlanta, GA | 2.0 | 2.0 | 831 | $1,950 | $2.35 | 24d | 1 | 1.28mi |
| 1250 Byewood Ln SW Atlanta, GA | 2.0 | 2.0 | 1100 | $2,150 | $1.95 | 24d | 1 | 1.31mi |
| 488 Pomona Cir SW Atlanta, GA | 3.0 | 1.0 | 1000 | $1,800 | $1.80 | 24d | 1 | 1.31mi |
| 2197 Polar Rock Pl SW Atlanta, GA | 3.0 | 2.5 | 1000 | $2,700 | $2.70 | 20d | 1 | 1.34mi |
Listing history 50 events
-
2026-06-18days on market $214,900 Active 45 DOM
-
2026-06-17days on market $214,900 Active 44 DOM
-
2026-06-16days on market $214,900 Active 43 DOM
-
2026-06-15days on market $214,900 Active 42 DOM
-
2026-06-13days on market $214,900 Active 40 DOM
-
2026-06-13days on market $214,900 Active 39 DOM
-
2026-06-09days on market $214,900 Active 36 DOM
-
2026-06-08remarks 699-char remark
-
2026-06-08days on market $214,900 Active 35 DOM
-
2026-06-07days on market $214,900 Active 34 DOM
-
2026-06-04days on market $214,900 Active 31 DOM
-
2026-06-03days on market $214,900 Active 30 DOM
-
2026-06-02days on market $214,900 Active 29 DOM
-
2026-06-02price $214,900 Active 28 DOM
-
2026-06-01days on market $229,000 Active 28 DOM
-
2026-05-31days on market $229,000 Active 27 DOM
-
2026-05-04$229,000 Active 605-char remark
Show marketing remark (605 chars)
Move in ready ranch in POPULAR SYLVAN HILLS neighborhood! This 3 bedroom, 1 bath home has original hardwoods that have been refinished, new paint, NEW water heater and PVC piping and tons of natural light. Enjoy the large open concept living room/dining room and the stainless steel appliances, granite countertops in the kitchen that lead to a spacious screened in patio on a fenced in level backyard. Sylvan Hills is an Official Beltline Neighborhood, blocks away from the Westside Beltline, Perkerson Park, close to downtown & Midtown, Marta. This move in ready character home will not last long!!!
-
2026-05-04$229,000 New 605-char remark
Show marketing remark (605 chars)
Move in ready ranch in POPULAR SYLVAN HILLS neighborhood! This 3 bedroom, 1 bath home has original hardwoods that have been refinished, new paint, NEW water heater and PVC piping and tons of natural light. Enjoy the large open concept living room/dining room and the stainless steel appliances, granite countertops in the kitchen that lead to a spacious screened in patio on a fenced in level backyard. Sylvan Hills is an Official Beltline Neighborhood, blocks away from the Westside Beltline, Perkerson Park, close to downtown & Midtown, Marta. This move in ready character home will not last long!!!
-
2026-04-16historical $229,000 605-char remark
Show marketing remark (605 chars)
Move in ready ranch in POPULAR SYLVAN HILLS neighborhood! This 3 bedroom, 1 bath home has original hardwoods that have been refinished, new paint, NEW water heater and PVC piping and tons of natural light. Enjoy the large open concept living room/dining room and the stainless steel appliances, granite countertops in the kitchen that lead to a spacious screened in patio on a fenced in level backyard. Sylvan Hills is an Official Beltline Neighborhood, blocks away from the Westside Beltline, Perkerson Park, close to downtown & Midtown, Marta. This move in ready character home will not last long!!!
-
2021-03-30historical
-
2021-03-02$219,000 New
-
2019-01-02soldstatus $135,000
-
2018-12-28soldstatus $135,000 Sold
-
2018-12-28soldstatus $135,000 Sold
-
2018-12-04status Under Contract
-
2018-12-04status Pending
-
2018-11-29status Back on Market
-
2018-11-29status Active
-
2018-11-17status Pending
-
2018-11-09status Under Contract
-
2018-11-09historical Contingent - Due Diligence
-
2018-11-06$125,000 Active
-
2018-11-06$125,000 New
-
2018-09-19soldstatus $75,698
-
2013-09-14price $17,000
-
2013-08-30price $17,000
-
2013-08-30historical
-
2013-08-23soldstatus $17,000 Sold
-
2013-08-23price $35,000
-
2013-08-23soldstatus $17,000 Sold
-
2013-05-06historical Pending Approval
-
2013-03-24status Pending Offer Approval
-
2013-03-14price $35,000
-
2013-02-23$35,000 New
-
2013-02-23$35,000 Active
-
2012-02-07historical
-
2012-01-25price $10,000
-
2012-01-21price $20,000
-
2012-01-04price $25,000
ⓘ Source: listings_history table (triggers on properties + properties_extension) + one-shot
backfill from property_details.listing_events for pre-trigger history.
Tax reassessment forecast GA · Resets to sale price
- Current annual tax
- $2,222 · $185/mo
- Projected year-2 tax
- $2,222 · $185/mo
- Expected delta
- $0/yr ($0/mo · 0.0%)
ⓘ Screening estimate from a state-policy table — verify with the county assessor before closing.
Climate risk First Street
- Flood 1/10 Low FEMA zone X (unshaded) · 0% chance over 30 yrs
- Wildfire 1/10 Low
- Heat 5/10 Major 7 d/yr ≥104°F today · 16 d/yr by 30 yrs out
- Wind 6/10 Major 27% chance of damaging wind over 30 yrs
- Air quality 4/10 Moderate 4 unhealthy d/yr today · 6 by 30 yrs out
Nearby sold comps map
Loading sold comps map…
Walkable amenities ~0.75 mi
Loading nearby amenities…
Taxation est. · year 1
- Rental income
- $23,090
- − Mortgage interest
- −$12,038
- − Property taxes
- −$2,222
- − Insurance
- −$1,074
- − Repairs & maintenance
- −$1,847
- − Management
- −$1,847
- − Depreciation
- −$6,252
- Taxable loss
- −$2,191
- Est. tax savings @ 24.0%
- +$526
- After-tax cash flow
- $1,946/yr
For passive investors: Depreciation is non-cash, so a rental often shows a tax loss while cash-flowing — sheltering income. Rental losses are passive: they offset passive income freely, and up to $25,000/yr can offset ordinary (W-2) income if you actively participate and your MAGI is under $100k (phasing out to $0 by $150k); unused losses carry forward. On sale, claimed depreciation is recaptured at up to 25%, and gains may owe capital-gains tax (a 1031 exchange can defer both). Figures are a year-1 estimate at your 24.0% rate — not tax advice; consult a CPA.
Schools (NCES district)
- District
- Atlanta Public Schools
- NCES district ID
- 1300120
- Math proficiency
- 28% ▼ -6.00%
- Reading proficiency
- 35% ▼ -2.00%
- Median HH income
- $48,306
- Composite
- 27.27/100
- National rank
- #7006
- State rank
- #80 of 174 in GA
Livability — Atlanta
- Score
- 83/100
- State rank
- #6
- US rank
- #919
Category grades
Schools grade is shown separately in the Schools card above.
Census & demographics
- Census place
- Atlanta, GA
- County
- Fulton County · 1,094,430 people
- City population
- 629,525
- Metro
- Atlanta-Sandy Springs-Alpharetta, GA
- Population (ZIP)
- 27,186
- Household income
- $53,037
- Rent vs Own
- Severe rent burden
- 1676.0
Population outlook (Fulton County) Hauer SSP2
- Today (2025)
- 1,203,707 people
- By 2030
- 1,299,706 · +8.0%
- By 2040
- 1,488,256 · +23.6%
- By 2050
- 1,664,580 · +38.3%
- By 2075
- 2,036,072 · +69.2%
- By 2100
- 2,222,402 · +84.6%
Race, ethnicity, and origin ACS 2023
- Neighborhood character
- Predominantly Black (76%)
- Race & ethnicity
- Black 76% White 14% Two or more races 4% Hispanic / Latino 4% Asian 2%
- Common ancestry
- Lithuanian 1% Slovak 1% Serbian 0%
- Foreign-born
- 5% · Canada, South Korea, Vietnam
- Languages at home
- 92% English-only · Spanish 4% French/Haitian/Cajun 1% Other Indo-European 1%
Political lean MEDSL · Fulton
- 2024 margin
- Solid D (+44.9) · D 71.9% · R 27.0% · Other 1.1%
- 2008→2024 swing
- +9.8pp toward D · 2008: 35.0pp · 2024: 44.9pp
- All cycles
- 2024: D+44.9 2020: D+46.4 2016: D+42.1 2012: D+29.6 2008: D+35.0
Not yet ingested
- Civics
- —
Market trends
- HPI YoY
- ▼ -204.00%
- Current HPI
- 418.7297
- Rent YoY
- ▲ 2.77%
- Metro
- Atlanta-Sandy Springs-Alpharetta, GA
- State GDP YoY
- ▲ 2.66%
- F500 in state
- 28
Industry mix (Fortune 500 HQ in GA)
| Industry | F500 HQs | Revenue |
|---|---|---|
| Paper / Packaging | 2 | $29B |
|
||
| Retail | 1 | $160B |
|
||
| Transportation / Logistics | 1 | $91B |
|
||
| Airlines | 1 | $62B |
|
||
| Consumer Goods | 1 | $47B |
|
||
| Utilities | 1 | $25B |
|
||
Price history
+302.5% since first listed38 events — show timeline
- 2026-05-04 Listed $229,000 FMLS
- 2026-05-04 Listed $229,000 GAMLS
- 2026-04-16 Coming Soon $229,000 GAMLS
- 2026-04-16 Coming Soon $229,000 FMLS
- 2021-03-30 Listing Removed — GAMLS
- 2021-03-02 Listed $219,000 GAMLS
- 2019-01-02 Sold (Public Records) $135,000 Public Records
- 2018-12-28 Sold (MLS) $135,000 GAMLS
- 2018-12-28 Sold (MLS) $135,000 FMLS
- 2018-12-04 Pending — GAMLS
- 2018-12-04 Pending — FMLS
- 2018-11-29 Relisted — GAMLS
- 2018-11-29 Relisted — FMLS
- 2018-11-17 Pending — FMLS
- 2018-11-09 Pending — GAMLS
- 2018-11-09 Contingent — FMLS
- 2018-11-06 Listed $125,000 GAMLS
- 2018-11-06 Listed $125,000 FMLS
- 2018-09-19 Sold (Public Records) $75,698 Public Records
- 2013-09-14 Price Changed $17,000 GAMLS
- 2013-08-30 Price Changed $17,000 FMLS
- 2013-08-30 Listing Removed — FMLS
- 2013-08-23 Sold (MLS) $17,000 GAMLS
- 2013-08-23 Sold (MLS) $17,000 FMLS
- 2013-08-23 Price Changed $35,000 FMLS
- 2013-05-06 Contingent — GAMLS
- 2013-03-24 Pending — FMLS
- 2013-03-14 Price Changed $35,000 GAMLS
- 2013-02-23 Listed $35,000 GAMLS
- 2013-02-23 Listed $35,000 FMLS
- 2012-02-07 Listing Removed — GAMLS
- 2012-01-25 Price Changed $10,000 GAMLS
- 2012-01-21 Price Changed $20,000 GAMLS
- 2012-01-04 Price Changed $25,000 GAMLS
- 2011-12-22 Price Changed $30,000 GAMLS
- 2011-12-02 Price Changed $40,000 GAMLS
- 2011-11-10 Listed $60,000 GAMLS
- 1994-09-02 Sold (Public Records) $56,900 Public Records
Property tax history
+3.5%/yrLatest (2025): $2,222 · +10.4% YoY. Source: county tax records.
Cash-flow waterfall
monthlySold comps — $/sqft
last 12 mo · ≤1 miLoading sold comps…