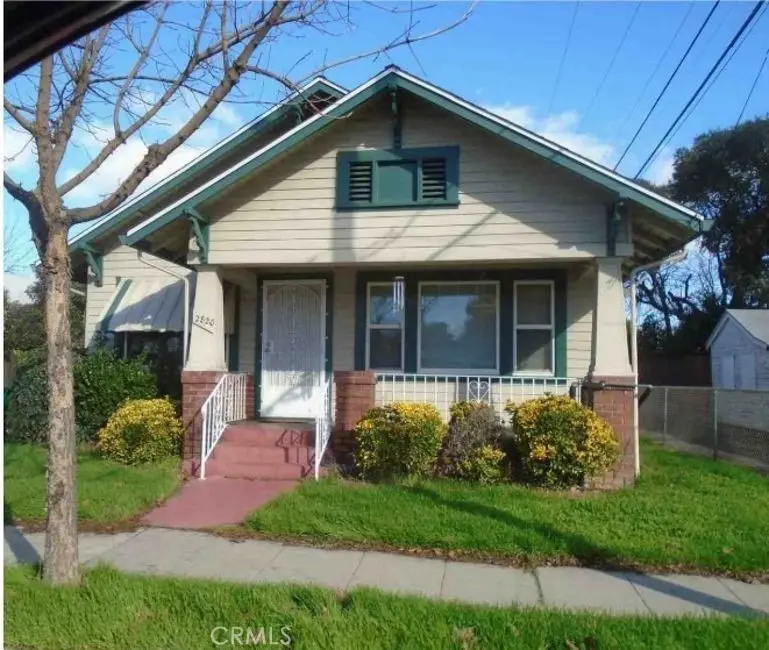
2820 N El Dorado St · Stockton, CA
Flood risk 5/10 · Moderate
- FEMA flood zone
- X
- Chance of flooding over 30 yrs
- 0.24%
- Est. flood insurance / yr
- $507 – $1,088
Fire risk 2/10 · Minimal
- Est. fire insurance / yr
- $659 – $1,223
Heat risk 7/10 · Major
- Hot days now (above 103°F)
- 7 days/yr
- Hot days in 30 yrs
- 15 days/yr
Wind risk 1/10 · Minimal
- Chance of severe wind over 30 yrs
- —
Air-quality risk 10/10 · Severe
- Unhealthy air days now
- 30 days/yr
- Unhealthy air days in 30 yrs
- 30 days/yr
Risk factors via First Street. Map © Google.
Why this score? — see what drove the D grade
The composite is a weighted blend of 9 inputs, each scored 0–100. Each bar is that input's sub-score; the figure is the points it added to the 100-point composite (weight × sub-score).
- ARV discount +15.0/15.0
- Cash flow +10.0/30.0
- Rent growth +3.1/5.0
- Schools +2.9/10.0
- Livability +2.9/5.0
- DSCR +2.8/10.0
- 1% rule +2.7/10.0
- Condition / age +2.5/5.0
- Appreciation +0.0/10.0
$241,800
🖨 Deal sheet (PDF) 📄 Offer letter ✓ Due diligence
Key facts
- 3,625 sq ft lot
- Garage
- Built 1927
Neighborhood map
What this means for you Summary
Snapshot
- This is a 2-bed/1.0-bath single-family listed at $242k.
Deal economics
- At list price, monthly cash flow is $-147 ($-2k/yr) — negative.
- To cash-flow at today's rent, offer at most $216k (10.7% below list).
- To meet the 1% rule (rent ≥ 1% of price), the offer needs to be $185k (23.3% below list).
- Recommended offer: $185k (23.3% below list) — sets the bar for 1% rule.
- Cap rate 5.6% vs local median 3.6% in Stockton — top-decile yield for the area; either an underpriced asset or a hidden risk that comps aren't pricing in. Stress-test before assuming the spread holds.
Location & tenants
- Location reads 57/100 on livability (#734 in CA) — a working-class tenant base; expect higher turnover. Strengths: housing A+, health & safety A, amenities A-; Watch: employment C-, schools D-, crime F.
- Stockton Unified (urban): math 23% / reading 46% proficiency, ranked #295 of 517 in CA (top 57%) — families likely to look elsewhere, expect single-tenant / working-renter base with shorter leases; 78% free/reduced lunch — lower-income household profile, screen leases tightly.
- Market conditions: Rents rising (+2.4%/yr); 139 active listings in the ZIP; 27 comparable units currently listed for rent nearby; rentals at typical pace (median 24d on market — plan ~3-4 weeks tenant-placement turnaround); solid renter incomes; 3,779 units permitted in San Joaquin County in 2024 (0 in 5+ unit buildings).
Forward outlook
- Local home prices are declining (-3.0%/yr); year-one equity from $2k of loan paydown is wiped out by about $7k of value loss. Plan a longer hold.
- San Joaquin County population projected at +17% by 2050 — long-run rental-demand tailwind backs the buy-and-hold thesis.
Negotiation context
- It's been on market 518 days — a 12% lower offer ($213k) is reasonable based on typical stale-listing flexibility.
Risks & watch-outs
- Watch-outs: built in 1927 — expect roof / HVAC / electrical / plumbing capex.
- Climate carrying-cost: moderate flood risk; extreme-heat days projected 7→15/yr by 2055 (HVAC capex compounding) — expect insurance premiums to compound above CPI over the hold.
Questions for the listing agent
- What do current leases actually rent for vs. the listed asking? Can we see a recent rent roll and the last 12 months of T-12 income?
- It's been on market 518 days. Have you received any prior offers? Is the seller open to a 23% concession, seller financing, or rate buy-down credit?
- Built in 1927 — when were the roof, HVAC, electrical panel, plumbing, and water heater last replaced?
- Why hasn't it sold? Are there any deal-killer items the seller is aware of (foundation, flood, title, zoning, code violations)?
- Is there a deadline driving the sale (1031 exchange, divorce, estate, relocation)? That informs how much negotiation room exists.
- Schools are D-rated, which usually means shorter tenancies and higher turnover. Who's the typical renter profile here, and what's been the actual vacancy rate?
- Crime grade is F in this area — have there been break-ins, vandalism, or insurance claims at this property in the last 3 years? What carrier currently insures it and at what premium?
- The area grade is low — what's the realistic commute time and amenity access for the typical tenant pool here? Any planned neighborhood developments (good or bad) we should know about?
- What's the average days-on-market for RENTAL listings here right now (not sales)? A rising rental-DOM trend means longer vacancies and softer asking-rent achievability than the comps imply.
- What's the recent tenant-quality profile in this submarket — average credit score on applications, eviction rate, late-payment / NSF rate, and stable-employment percentage? A property-management company in the area should have these aggregated.
- How much new for-sale + rental construction is in the pipeline within 1–3 miles? Heavy new supply typically softens prices + rents 12–24 months out; constrained supply supports both.
Investment metrics
- 1% rule
- 0.77% ✗
- Cap rate
- 5.56%
- Cash-on-cash
- -2.60%
- DSCR
- 0.88
- GRM
- 10.9
CMA / ARV
- ARV (median comp)
- $348,756
- List price
- $241,800
- Delta
- -30.67%
- Verdict
- UNDERPRICED
- Comps
- 20 within 1.0 mi
Show comp detail 12 sales within ~0.75 mi
| Address | Dist | Beds/Ba | Sqft | Sold | Price | $/sf | Match |
|---|---|---|---|---|---|---|---|
| 64 E Noble St | 0.09mi | 3/1.5 (+1) | 1,032 (+2%) | 1mo | $374,950 | $363 | 85 |
| 116 E Noble St | 0.09mi | 2/1.0 | 912 (-10%) | 2mo | $325,000 | $356 | 78 |
| 540 E Sonoma Ave | 0.40mi | 2/1.0 | 1,023 (+1%) | 5mo | $245,000 | $239 | 75 |
| 44 W Alpine Ave | 0.26mi | 2/1.0 | 1,081 (+7%) | 2mo | $340,000 | $315 | 75 |
| 312 Noble St | 0.18mi | 2/2.0 | 912 (-10%) | 2mo | $345,000 | $378 | 69 |
| 140 E Sonoma Ave | 0.16mi | 3/1.5 (+1) | 1,131 (+12%) | 1mo | $345,000 | $305 | 65 |
| 133 W Mckenzie Ave | 0.58mi | 3/1.0 (+1) | 1,014 (+0%) | 4mo | $370,000 | $365 | 64 |
| 1418 N Center St | 0.74mi | 2/1.0 | 1,010 (-0%) | 2mo | $140,000 | $139 | 64 |
| 4119 N Commerce St | 0.71mi | 3/1.0 (+1) | 1,023 (+1%) | 1mo | $369,000 | $361 | 59 |
| 283 E Churchill St | 0.68mi | 3/1.0 (+1) | 1,014 (+0%) | 7mo | $374,900 | $370 | 57 |
| 3978 N American St | 0.75mi | 3/1.0 (+1) | 1,001 (-1%) | 3mo | $390,000 | $390 | 56 |
| 32 E Mckenzie Ave | 0.48mi | 2/2.0 | 1,116 (+10%) | 3mo | $330,000 | $296 | 54 |
Match score weights: distance 35% · size 25% · config 20% · recency 20%. Top-matched comps best support the ARV.
Projected returns pro-forma
-3.0% appreciation · 2.37% rent growth · sell at horizon
- IRR
- -21.3%
- Equity multiple
- 0.27×
- Total profit
- $-49,703
- Equity at exit
- $36,053
- IRR
- -16.3%
- Equity multiple
- 0.11×
- Total profit
- $-60,080
- Equity at exit
- $20,906
Cash invested: $67,704 (down + closing). Projections, not guarantees.
Landlord ↔ Tenant lean methodology
- Overall (STATE)
- 18 Strongly Tenant-Friendly
- State California
- 18 Strongly Tenant-Friendly · D+13
- County
- — inherits STATE
- City
- — inherits STATE
ZIP-level market 95204
- Rents YoY
- 2.4%
- Active inventory
- 139
- Price-to-rent
- 10.9×
Monthly cashflow live
- Estimated rent
- $1,853 high interval (Pro) →
- Mortgage (P&I)
- −$1,268
- Tax from tax record
- −$242 /mo · $2,906/yr
- Insurance
- −$101
- HOA
- −$0
- Vacancy / Maint / Mgmt
- −$389
- Net cashflow
- $-147
Break-even live
Sensitivity live
| Price | -10% $-10 | -5% $-78 | +0% $-147 | +5% $-215 | +10% $-284 |
|---|---|---|---|---|---|
| Rent | -10% $-293 | -5% $-220 | +0% $-147 | +5% $-74 | +10% $0 |
| Rate | -1.0pp $-25 | -0.5pp $-85 | base $-147 | +0.5pp $-209 | +1.0pp $-273 |
UW: 25.0% down · 7.5% · 30yr · 1.5% tax · 5.0% vac · 8.0% maint · 8.0% mgmt
Financing live
Cash to close
- Down payment
- $60,450
- Closing costs
- $7,254
- Reserves months
- —
- Total cash needed
- —
Loan-product check · same deal, 3 products live
Conventional
25% down · 7.5% · 30yr
- Down + closing
- —
- Monthly P&I
- —
- Monthly cashflow
- —
- DSCR
- —
- Eligible?
- —
Personal DTI + credit; lowest rate.
DSCR
20% down · 8.5% · 30yr
- Down + closing
- —
- Monthly P&I
- —
- Monthly cashflow
- —
- DSCR
- —
- Eligible?
- —
No personal income docs; deal must DSCR.
Hard money
10% down · 12.0% · 12mo
- Down + closing
- —
- Monthly P&I
- —
- Monthly cashflow
- —
- DSCR
- —
- Eligible?
- —
Short-term bridge; refi at stabilization.
Rent comps 27 comps
| Address | Beds | Baths | Sqft | Rent | $/sqft | DOM | Units | Dist |
|---|---|---|---|---|---|---|---|---|
| 2704 N Hunter St Stockton, CA | 2.0 | 1.0 | 825 | $1,795 | $2.18 | 24d | 1 | 0.10mi |
| 220 E Ellis St Stockton, CA | 2.0 | 1.0 | 940 | $1,495 | $1.59 | 44d | 1 | 0.17mi |
| 2424 N Center St Stockton, CA | 3.0 | 2.0 | 1158 | $2,995 | $2.59 | 44d | 1 | 0.19mi |
| 325 E Mariposa Ave Stockton, CA | 3.0 | 2.0 | 1188 | $2,000 | $1.68 | 24d | 1 | 0.21mi |
| 440 E Arcade St Stockton, CA | 3.0 | 2.0 | 962 | $2,350 | $2.44 | 44d | 1 | 0.29mi |
| 32 E Wyandotte St Apt D Stockton, CA | 2.0 | 1.0 | 900 | $1,500 | $1.67 | 44d | 1 | 0.41mi |
| 44 E Alder St Stockton, CA | 1.0 | 2.0 | 829 | $1,300 | $1.57 | 24d | 1 | 0.53mi |
| 1509 N Edison St Stockton, CA | 2.0 | 1.0 | 900 | $1,250 | $1.39 | 24d | 1 | 0.84mi |
| 1503 N Edison St Stockton, CA | 2.0 | 1.0 | 900 | $1,250 | $1.39 | 15d | 1 | 0.85mi |
| 3520 San Mateo Ave Stockton, CA | 3.0 | 1.0 | 1446 | $2,200 | $1.52 | 24d | 1 | 0.87mi |
| 328 Northbank Ct #41 Stockton, CA | 2.0 | 1.5 | 885 | $1,600 | $1.81 | 19d | 1 | 0.93mi |
| 945 N El Dorado St Stockton, CA | 1.0 | 1.0 | 635 | $1,450 | $2.28 | 24d | 6 | 1.05mi |
| 830 N Van Buren St Unit B Stockton, CA | 1.0 | 1.0 | 870 | $1,495 | $1.72 | 4d | 1 | 1.16mi |
| 843 N Lincoln St Stockton, CA | 1.0 | 1.0 | 969 | $1,195 | $1.23 | 44d | 1 | 1.17mi |
| 3939 N Pershing Ave Stockton, CA | 1.0–2.0 | 1.0 | 775 | $1,350 | $1.74 | 4d | 4 | 1.20mi |
| 126 E Jamestown St Unit 230 Stockton, CA | 2.0 | 1.0 | 700 | $1,095 | $1.56 | 44d | 1 | 1.20mi |
| 126 E Jamestown St Apt 221 Stockton, CA | 2.0 | 1.0 | 750 | $1,195 | $1.59 | 24d | 1 | 1.20mi |
| 126 E Jamestown St Stockton, CA | 2.0 | 1.0 | 750 | $1,195 | $1.59 | 44d | 1 | 1.20mi |
| 4433 Continental Way Stockton, CA | 1.0–2.0 | 1.0 | 786 | $2,662 | $3.38 | 3d | 23 | 1.22mi |
| 4475 La Cresta Way #2 Stockton, CA | 2.0 | 1.0 | 840 | $1,950 | $2.32 | 44d | 1 | 1.22mi |
| 1526 N Sierra Nevada St Stockton, CA | 3.0 | 2.0 | 1024 | $2,600 | $2.54 | 24d | 1 | 1.23mi |
| 4401 Manchester Ave Stockton, CA | 2.0 | 1.0–1.5 | 925 | $1,474 | $1.59 | 22d | 1 | 1.25mi |
| 4401 Manchester Ave Stockton, CA | 2.0 | 1.0–1.5 | 925 | $1,474 | $1.59 | 44d | 2 | 1.25mi |
| 1020 Rose Marie Ln Stockton, CA | 3.0 | 1.5 | 1302 | $1,800 | $1.38 | 24d | 1 | 1.29mi |
| 520 N Monroe St Unit 520 Stockton, CA | 2.0 | 1.0 | 900 | $1,025 | $1.14 | 44d | 1 | 1.36mi |
| 1759 Middlefield Ave Stockton, CA | 2.0 | 1.0 | 920 | $2,100 | $2.28 | 4d | 1 | 1.40mi |
| 610 E Oak St Stockton, CA | 2.0 | 1.0 | 930 | $1,550 | $1.67 | 24d | 1 | 1.40mi |
Listing history 20 events
-
2026-06-18days on market $241,800 Active 518 DOM
-
2026-06-17days on market $241,800 Active 517 DOM
-
2026-06-16days on market $241,800 Active 516 DOM
-
2026-06-15days on market $241,800 Active 515 DOM
-
2026-06-14days on market $241,800 Active 513 DOM
-
2026-06-10days on market $241,800 Active 510 DOM
-
2026-06-09days on market $241,800 Active 509 DOM
-
2026-06-08days on market $241,800 Active 508 DOM
-
2026-06-07days on market $241,800 Active 507 DOM
-
2026-06-05days on market $241,800 Active 504 DOM
-
2026-06-03days on market $241,800 Active 503 DOM
-
2026-06-03days on market $241,800 Active 502 DOM
-
2026-06-01days on market $241,800 Active 501 DOM
-
2026-05-31days on market $241,800 Active 500 DOM
-
2026-04-07price $241,800
-
2025-10-16price $254,200
-
2025-08-04price $300,700
-
2025-01-16$255,315 Active
-
2018-09-21soldstatus $215,000
-
2002-10-30soldstatus $130,000
ⓘ Source: listings_history table (triggers on properties + properties_extension) + one-shot
backfill from property_details.listing_events for pre-trigger history.
Tax reassessment forecast CA · Resets to sale price
- Current annual tax
- $2,906 · $242/mo
- Projected year-2 tax
- $2,906 · $242/mo
- Expected delta
- $0/yr ($0/mo · 0.0%)
ⓘ Screening estimate from a state-policy table — verify with the county assessor before closing.
Climate risk First Street
- Flood 5/10 Major FEMA zone X · 24% chance over 30 yrs
- Wildfire 2/10 Low
- Heat 7/10 Severe 7 d/yr ≥103°F today · 15 d/yr by 30 yrs out
- Wind 1/10 Low
- Air quality 10/10 Extreme 30 unhealthy d/yr today · 30 by 30 yrs out
Nearby sold comps map
Loading sold comps map…
Walkable amenities ~0.75 mi
Loading nearby amenities…
Taxation est. · year 1
- Rental income
- $22,242
- − Mortgage interest
- −$13,545
- − Property taxes
- −$2,906
- − Insurance
- −$1,209
- − Repairs & maintenance
- −$1,779
- − Management
- −$1,779
- − Depreciation
- −$7,034
- Taxable loss
- −$6,011
- Est. tax savings @ 24.0%
- +$1,443
- After-tax cash flow
- $-318/yr
For passive investors: Depreciation is non-cash, so a rental often shows a tax loss while cash-flowing — sheltering income. Rental losses are passive: they offset passive income freely, and up to $25,000/yr can offset ordinary (W-2) income if you actively participate and your MAGI is under $100k (phasing out to $0 by $150k); unused losses carry forward. On sale, claimed depreciation is recaptured at up to 25%, and gains may owe capital-gains tax (a 1031 exchange can defer both). Figures are a year-1 estimate at your 24.0% rate — not tax advice; consult a CPA.
Schools (NCES district)
- District
- Stockton Unified
- NCES district ID
- 0638010
- Math proficiency
- 23% ▲ 2.00%
- Reading proficiency
- 46% ▲ 16.00%
- Median HH income
- $37,563
- Composite
- 28.65/100
- National rank
- #6701
- State rank
- #295 of 517 in CA
Livability — Stockton
- Score
- 57/100
- State rank
- #734
- US rank
- #21638
Category grades
Schools grade is shown separately in the Schools card above.
Census & demographics
- Census place
- Stockton, CA
- County
- San Joaquin County · 729,570 people
- City population
- 332,006
- Metro
- Stockton, CA
- Population (ZIP)
- 31,035
- Household income
- $75,548
- Rent vs Own
- Severe rent burden
- 1434.0
Population outlook (San Joaquin County) Hauer SSP2
- Today (2025)
- 796,965 people
- By 2030
- 828,849 · +4.0%
- By 2040
- 885,611 · +11.1%
- By 2050
- 929,798 · +16.7%
- By 2075
- 994,578 · +24.8%
- By 2100
- 971,291 · +21.9%
Race, ethnicity, and origin ACS 2023
- Neighborhood character
- Diverse neighborhood (Simpson 0.66)
- Race & ethnicity
- Hispanic / Latino 48% White 31% Two or more races 18% Asian 9% Black 7% Native American 2%
- Hispanic origin (detail)
- Mexican 42%
- Common ancestry
- Slovak 2% Russian 1% Italian 1%
- Foreign-born
- 18% · Canada, Vietnam, China
- Languages at home
- 67% English-only · Spanish 27% Other Asian/Pacific 3% Tagalog/Filipino 2%
Political lean MEDSL · San Joaquin
- 2024 margin
- Toss-up / Even · D 48.0% · R 48.9% · Other 3.0%
- 2008→2024 swing
- -11.6pp toward R · 2008: 10.7pp · 2024: -0.9pp
- All cycles
- 2024: R+0.9 2020: D+13.9 2016: D+12.9 2012: D+8.9 2008: D+10.7
Not yet ingested
- Civics
- —
Market trends
- HPI YoY
- ▼ -386.16%
- Current HPI
- 333.3367
- Rent YoY
- ▲ 2.37%
- Metro
- Stockton, CA
- State GDP YoY
- ▲ 3.21%
- F500 in state
- 116
Industry mix (Fortune 500 HQ in CA)
| Industry | F500 HQs | Revenue |
|---|---|---|
| Technology | 27 | $1,492B |
|
||
| Financial Services | 3 | $174B |
|
||
| Retail | 3 | $44B |
|
||
| Insurance | 3 | $26B |
|
||
| Media / Entertainment | 2 | $115B |
|
||
| Pharmaceuticals / Biotech | 2 | $62B |
|
||
Price history
+86.0% since first listed6 events — show timeline
- 2026-04-07 Price Changed $241,800 CRMLS
- 2025-10-16 Price Changed $254,200 CRMLS
- 2025-08-04 Price Changed $300,700 CRMLS
- 2025-01-16 Listed $255,315 CRMLS
- 2018-09-21 Sold (Public Records) $215,000 Public Records
- 2002-10-30 Sold (Public Records) $130,000 Public Records
Property tax history
+3.5%/yrLatest (2025): $2,906 · -23.2% YoY. Source: county tax records.
Cash-flow waterfall
monthlySold comps — $/sqft
last 12 mo · ≤1 miLoading sold comps…