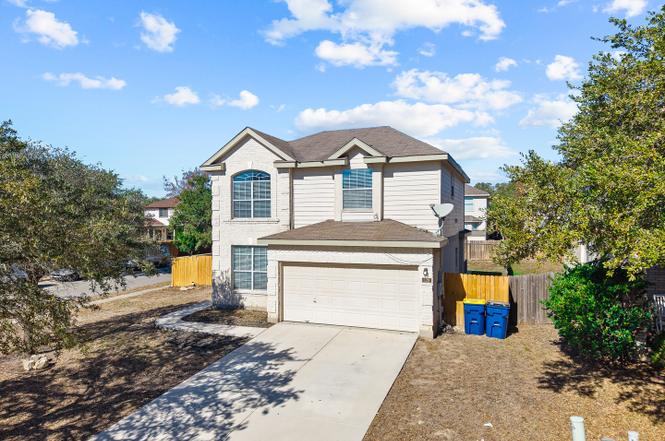
128 Pilot · Cibolo, TX
Flood risk 1/10 · Minimal
- FEMA flood zone
- X (unshaded)
- Chance of flooding over 30 yrs
- 0.0%
- Est. flood insurance / yr
- $507 – $1,088
Fire risk 5/10 · Moderate
- Est. fire insurance / yr
- $1,222 – $2,270
Heat risk 8/10 · Major
- Hot days now (above 108°F)
- 7 days/yr
- Hot days in 30 yrs
- 22 days/yr
Wind risk 8/10 · Major
- Chance of severe wind over 30 yrs
- 80.0%
Air-quality risk 1/10 · Minimal
- Unhealthy air days now
- 0 days/yr
- Unhealthy air days in 30 yrs
- 0 days/yr
Risk factors via First Street. Map © Google.
Why this score? — see what drove the D+ grade
The composite is a weighted blend of 9 inputs, each scored 0–100. Each bar is that input's sub-score; the figure is the points it added to the 100-point composite (weight × sub-score).
- ARV discount +15.0/15.0
- Cash flow +9.3/30.0
- Appreciation +5.2/10.0
- Schools +4.4/10.0
- 1% rule +3.7/10.0
- Livability +3.6/5.0
- Rent growth +3.1/5.0
- DSCR +2.6/10.0
- Condition / age +2.5/5.0
$250,000
🖨 Deal sheet (PDF) 📄 Offer letter ✓ Due diligence
Listing remarks
* WATCH THE VIDEO BELOW IN "more facts and features" DROPDOWN . BEAUTIFUL 4 BEDROOM 2 AND 1/2 BATH HOME IN FALCON RIDGE SUBDIVISION IN CIBOLO. ALL BEDROOMS ARE UPSTAIRS INCLUDING THE LAUNDRY ROOM. THE PRIMARY BEDROOM INCLUDES A LARGE BATHROOM WITH A SHOWER, SEPERATE GARDEN TUB AND A DOUBLE VANITY SINK. OPEN KITCHEN WITH AN ISLAND. FORMAL DINING AREA. CERAMIC TILE ON THE MAIN FLOOR. EAT-IN KITCHEN AREA. OUTDOOR HAS A COVERED PATIO, PLUS ADDITIONAL OPEN PATIO AREA
Key facts
- Covered patio
- Open kitchen
- 7,797 sq ft lot
Tags
Property features AI
Finance
- Financial info: Down payment resources available
- HOA & community: Mandatory HOA; HOA fee $200 semi-annually; Association transfer fee $250; Community amenities include pool and park/playground
Exterior
- Parking: 2-car garage
- Security: Owned security system
- Utilities: City water; City sewer; City garbage service; Electric service by GVEC
- Home design: Pre-owned single-family home; Front faces south
- Construction: Approximately 22 years old; Brick, wood and siding exterior; Composition roof; Slab foundation
- Exterior features: Covered patio; Patio slab; Privacy fence; Double pane windows; Mature trees; Corner lot; Level lot; Street paved with curbs, gutters, sidewalks and streetlights; Asphalt city street
Interior
- Kitchen: Stove/Range; Dishwasher; Island; Ice maker connection; Disposal
- Bedrooms: Master bedroom on upper level (15 x 14); Bedroom 2 (13 x 10); Bedroom 3 (11 x 11); Bedroom 4 (12 x 11)
- Flooring: Carpet; Ceramic tile; Linoleum
- Bathrooms: Total 3 bathrooms (2 full, 1 half); Master bath with separate tub and shower, double vanity, garden tub (10 x 10)
- Heating & cooling: Central heating (electric); Central air conditioning
- Interior features: Ceiling fans; Disposal; Smoke alarm; Security system (owned); Garage door opener; City garbage service; 1 living area; Separate dining room; Eat-in kitchen; Kitchen island; All bedrooms on upper level; High ceilings; Cable TV available; High speed internet; Laundry room (upper level); Walk-in closets; Attic access only; All window coverings remain; Ice maker connection; Electric water heater
- Laundry & utility: Washer connection; Dryer connection; Laundry on upper level
Neighborhood map
What this means for you Summary
Snapshot
- This is a 4-bed/2.0-bath single-family listed at $250k.
Deal economics
- At list price, monthly cash flow is $-182 ($-2k/yr) — negative.
- To cash-flow at today's rent, offer at most $218k (12.8% below list).
- To meet the 1% rule (rent ≥ 1% of price), the offer needs to be $217k (13.2% below list).
- Recommended offer: $217k (13.2% below list) — sets the bar for 1% rule.
- Cap rate 5.4% vs local median 3.3% in Cibolo — top-decile yield for the area; either an underpriced asset or a hidden risk that comps aren't pricing in. Stress-test before assuming the spread holds.
Location & tenants
- Location reads 72/100 on livability (#261 in TX) — a middle-class / working-renter tenant base. Strengths: employment A+, housing A+, crime A; Watch: amenities F, commute F, health & safety F.
- Schertz-Cibolo-U City ISD (suburban): math 49% / reading 48% proficiency, ranked #152 of 826 in TX (top 18%) — families likely to look elsewhere, expect single-tenant / working-renter base with shorter leases.
- Zoned schools: Watts El (math 44% / reading 44%, grade F, #1,243 of 4,322 statewide, top 29%, 593 students, 44% FRL); Ray D Corbett J H (math 52% / reading 49%, grade C, #333 of 1,662 statewide, top 21%, 1,188 students, 40% FRL); Samuel Clemens H S (math 45% / reading 60%, grade C-, #444 of 1,632 statewide, top 27%, 2,544 students, 30% FRL).
- Market conditions: Rents rising (+2.4%/yr); 761 active listings in the ZIP; 32 comparable units currently listed for rent nearby; rentals at typical pace (median 26d on market — plan ~3-4 weeks tenant-placement turnaround); high-income renter base; 2,064 units permitted in Guadalupe County in 2024 (133 in 5+ unit buildings).
Forward outlook
- In year one you build about $3k of equity ($2k loan paydown + $1k appreciation (0.5% local appreciation)).
- Guadalupe County population projected at +61% by 2050 — long-run rental-demand tailwind backs the buy-and-hold thesis.
- By year 10, paydown + projected appreciation supports a ~$34k cash-out refi (75% LTV) — recoverable capital for the next deal without selling this one.
Negotiation context
- It's been on market 210 days — a 12% lower offer ($220k) is reasonable based on typical stale-listing flexibility.
- 4 sale attempts; this cycle's ask has dropped $40k (14%) from the opening price — seller is motivated, your offer sets the floor, not the list.
Risks & watch-outs
- Climate carrying-cost: severe wind risk, 80% chance of damaging wind over 30y; moderate wildfire risk; extreme-heat days projected 7→22/yr by 2055 (HVAC capex compounding) — expect insurance premiums to compound above CPI over the hold.
Questions for the listing agent
- What do current leases actually rent for vs. the listed asking? Can we see a recent rent roll and the last 12 months of T-12 income?
- It's been on market 210 days. Have you received any prior offers? Is the seller open to a 13% concession, seller financing, or rate buy-down credit?
- What does the HOA fee cover, when was the last increase, and are there any pending special assessments or reserve-fund shortfalls?
- Why hasn't it sold? Are there any deal-killer items the seller is aware of (foundation, flood, title, zoning, code violations)?
- Is there a deadline driving the sale (1031 exchange, divorce, estate, relocation)? That informs how much negotiation room exists.
- Schools are B-rated — typically a magnet for longer-tenancy family renters. What's the average tenant stay here, and is there a school-zone premium baked into asking?
- The area grade is low — what's the realistic commute time and amenity access for the typical tenant pool here? Any planned neighborhood developments (good or bad) we should know about?
- What's the average days-on-market for RENTAL listings here right now (not sales)? A rising rental-DOM trend means longer vacancies and softer asking-rent achievability than the comps imply.
- What's the recent tenant-quality profile in this submarket — average credit score on applications, eviction rate, late-payment / NSF rate, and stable-employment percentage? A property-management company in the area should have these aggregated.
- How much new for-sale + rental construction is in the pipeline within 1–3 miles? Heavy new supply typically softens prices + rents 12–24 months out; constrained supply supports both.
Investment metrics
- 1% rule
- 0.87% ✗
- Cap rate
- 5.42%
- Cash-on-cash
- -3.11%
- DSCR
- 0.86
- GRM
- 9.6
CMA / ARV
- ARV (on-the-fly)
- $320,716
- Comps found
- 12
Show comp detail 12 sales within ~0.75 mi
| Address | Dist | Beds/Ba | Sqft | Sold | Price | $/sf | Match |
|---|---|---|---|---|---|---|---|
| 100 Cloud Xing | 0.32mi | 3/2.0 (-1) | 2,062 (-5%) | 1mo | $320,000 | $155 | 71 |
| 342 Notch Leaf | 0.47mi | 3/2.5 (-1) | 2,138 (-1%) | 2mo | $290,000 | $136 | 68 |
| 210 Rosegate Dr | 0.36mi | 4/2.5 | 2,340 (+8%) | 1mo | $299,500 | $128 | 67 |
| 244 Turkey Tree | 0.32mi | 4/2.0 | 1,941 (-10%) | 2mo | $310,000 | $160 | 66 |
| 2815 Wild Cherry | 0.72mi | 4/2.0 | 2,204 (+2%) | 2mo | $339,000 | $154 | 62 |
| 2817 Lotus Park | 0.68mi | 3/2.5 (-1) | 2,203 (+2%) | 2mo | $239,900 | $109 | 57 |
| 121 Royal Troon | 0.52mi | 3/2.0 (-1) | 2,361 (+9%) | 2mo | $350,000 | $148 | 54 |
| 229 Notch Leaf | 0.42mi | 3/2.0 (-1) | 1,849 (-15%) | 2mo | $300,000 | $162 | 50 |
| 113 Winter Frost | 0.52mi | 3/2.5 (-1) | 2,445 (+13%) | 0mo | $339,900 | $139 | 47 |
| 1020 Grey Feather | 0.73mi | 4/2.0 | 1,918 (-12%) | 3mo | $199,900 | $104 | 45 |
| 1641 Ebony Ln | 0.75mi | 4/2.5 | 2,393 (+10%) | 1mo | $360,000 | $150 | 45 |
| 200 Nandina Ct | 0.62mi | 3/2.5 (-1) | 2,462 (+14%) | 1mo | $350,000 | $142 | 40 |
Match score weights: distance 35% · size 25% · config 20% · recency 20%. Top-matched comps best support the ARV.
Projected returns pro-forma
0.47% appreciation · 2.42% rent growth · sell at horizon
- IRR
- -4.3%
- Equity multiple
- 0.79×
- Total profit
- $-14,425
- Equity at exit
- $78,528
- IRR
- 0.9%
- Equity multiple
- 1.10×
- Total profit
- $7,221
- Equity at exit
- $99,271
Cash invested: $70,000 (down + closing). Projections, not guarantees.
Landlord ↔ Tenant lean methodology
- Overall (STATE)
- 87 Strongly Landlord-Friendly
- State Texas
- 87 Strongly Landlord-Friendly · R+5
- County
- — inherits STATE
- City
- — inherits STATE
ZIP-level market 78108
- Home prices YoY
- 0.3%
- Rents YoY
- 2.4%
- Active inventory
- 761
- Price-to-rent
- 9.6×
Monthly cashflow live
- Estimated rent
- $2,169 high interval (Pro) →
- Mortgage (P&I)
- −$1,311
- Tax from tax record
- −$447 /mo · $5,362/yr
- Insurance
- −$104
- HOA
- −$33
- Vacancy / Maint / Mgmt
- −$455
- Net cashflow
- $-182
Break-even live
Sensitivity live
| Price | -10% $-40 | -5% $-111 | +0% $-182 | +5% $-252 | +10% $-323 |
|---|---|---|---|---|---|
| Rent | -10% $-353 | -5% $-267 | +0% $-182 | +5% $-96 | +10% $-10 |
| Rate | -1.0pp $-56 | -0.5pp $-118 | base $-182 | +0.5pp $-246 | +1.0pp $-312 |
UW: 25.0% down · 7.5% · 30yr · 1.5% tax · 5.0% vac · 8.0% maint · 8.0% mgmt
Financing live
Cash to close
- Down payment
- $62,500
- Closing costs
- $7,500
- Reserves months
- —
- Total cash needed
- —
Loan-product check · same deal, 3 products live
Conventional
25% down · 7.5% · 30yr
- Down + closing
- —
- Monthly P&I
- —
- Monthly cashflow
- —
- DSCR
- —
- Eligible?
- —
Personal DTI + credit; lowest rate.
DSCR
20% down · 8.5% · 30yr
- Down + closing
- —
- Monthly P&I
- —
- Monthly cashflow
- —
- DSCR
- —
- Eligible?
- —
No personal income docs; deal must DSCR.
Hard money
10% down · 12.0% · 12mo
- Down + closing
- —
- Monthly P&I
- —
- Monthly cashflow
- —
- DSCR
- —
- Eligible?
- —
Short-term bridge; refi at stabilization.
Rent comps 32 comps
| Address | Beds | Baths | Sqft | Rent | $/sqft | DOM | Units | Dist |
|---|---|---|---|---|---|---|---|---|
| 116 Lindy Hls Cibolo, TX | 4.0 | 2.5 | 2790 | $2,100 | $0.75 | 25d | 1 | 0.04mi |
| 229 Spice Oak Ln Cibolo, TX | 3.0 | 2.0 | 1882 | $1,895 | $1.01 | 0d | 1 | 0.20mi |
| 314 Scotch Rose Ln Cibolo, TX | 3.0 | 2.0 | 1719 | $1,800 | $1.05 | 25d | 1 | 0.30mi |
| 153 Bentwood Ranch Dr Cibolo, TX | 3.0 | 2.0 | 1544 | $1,695 | $1.10 | 25d | 1 | 0.37mi |
| 146 Bentwood Ranch Dr Cibolo, TX | 4.0 | 3.5 | 2496 | $1,946 | $0.78 | 0d | 1 | 0.38mi |
| 237 Winter Frost Cibolo, TX | 4.0 | 2.5 | 2605 | $2,075 | $0.80 | 4d | 1 | 0.41mi |
| 133 Firebird Run Cibolo, TX | 3.0 | 2.5 | 2167 | $2,000 | $0.92 | 25d | 1 | 0.41mi |
| 509 Sea Headrig Dr Cibolo, TX | 4.0 | 3.0 | 2731 | $2,200 | $0.81 | 25d | 1 | 0.49mi |
| 417 Turnberry Way Cibolo, TX | 3.0 | 2.0 | 2480 | $2,300 | $0.93 | 22d | 1 | 0.50mi |
| 226 Maidstone Cv Cibolo, TX | 4.0 | 2.5 | 2710 | $2,200 | $0.81 | 25d | 1 | 0.63mi |
| 137 Hidden Fawn Cibolo, TX | 3.0 | 2.5 | 2232 | $1,975 | $0.88 | 25d | 1 | 0.73mi |
| 2921 Candleberry Dr Schertz, TX | 3.0 | 2.0 | 1871 | $1,850 | $0.99 | 5d | 1 | 0.92mi |
| 147 Brookview Cibolo, TX | 4.0 | 3.0 | 2500 | $2,250 | $0.90 | 25d | 1 | 1.13mi |
| 1136 Berry Creek Dr Schertz, TX | 3.0 | 2.0 | 1723 | $2,000 | $1.16 | 4d | 1 | 1.14mi |
| 2813 Kline Cir Schertz, TX | 4.0 | 2.5 | 2130 | $1,800 | $0.85 | 6d | 1 | 1.19mi |
| 2413 Star Light Ln Schertz, TX | 3.0 | 2.0 | 1409 | $1,800 | $1.28 | 25d | 1 | 1.20mi |
| 237 Hinsdale Run Cibolo, TX | 3.0 | 2.5 | 2022 | $2,200 | $1.09 | 23d | 1 | 1.20mi |
| 2801 Hillview Ln Schertz, TX | 3.0 | 2.0 | 1491 | $1,745 | $1.17 | 25d | 1 | 1.20mi |
| 2713 Lockwood Ln Schertz, TX | 3.0 | 2.0 | 1430 | $1,595 | $1.12 | 4d | 1 | 1.23mi |
| 2805 Berry Way Schertz, TX | 3.0 | 2.0 | 1690 | $1,850 | $1.09 | 25d | 1 | 1.24mi |
| 213 Gravel Gray Cibolo, TX | 3.0 | 2.0 | 1651 | $1,950 | $1.18 | 0d | 1 | 1.25mi |
| 132 Niemietz Cv Cibolo, TX | 3.0 | 2.0 | 1596 | $1,900 | $1.19 | 25d | 1 | 1.26mi |
| 213 Lieck Cv Cibolo, TX | 4.0 | 2.5 | 2525 | $2,495 | $0.99 | 0d | 1 | 1.26mi |
| 164 Springtree Holw Cibolo, TX | 4.0 | 2.5 | 2173 | $1,925 | $0.89 | 18d | 1 | 1.27mi |
| 181 Harley Hay Cibolo, TX | 3.0 | 2.0 | 1635 | $1,995 | $1.22 | 25d | 1 | 1.27mi |
| 137 Niemietz Cv Cibolo, TX | 4.0 | 2.5 | 2419 | $2,200 | $0.91 | 25d | 1 | 1.29mi |
| 513 Chelson Hunt Cibolo, TX | 4.0 | 2.5 | 2453 | $2,800 | $1.14 | 25d | 1 | 1.33mi |
| 1707 Mountain Brk Schertz, TX | 3.0 | 2.5 | 2322 | $1,925 | $0.83 | 25d | 1 | 1.36mi |
| 1060 Richmond Dr Schertz, TX | 3.0 | 2.0 | 1774 | $1,550 | $0.87 | 6d | 1 | 1.38mi |
| 821 Dimrock Schertz, TX | 4.0 | 2.5 | 2509 | $2,000 | $0.80 | 16d | 1 | 1.42mi |
| 721 Wooded Trl Schertz, TX | 4.0 | 2.5 | 2426 | $2,195 | $0.90 | 0d | 1 | 1.48mi |
| 1604 Canyon Oak Schertz, TX | 3.0 | 2.0 | 1999 | $3,950 | $1.98 | 25d | 1 | 1.49mi |
HOA detail
- Monthly dues
- $33 · $396/yr
Listing history 16 events
-
2026-06-03statusdays on market $250,000 Pending 210 DOM
-
2026-06-02days on market $250,000 Active Option 209 DOM
-
2026-06-01days on market $250,000 Active Option 208 DOM
-
2026-05-31days on market $250,000 Active Option 207 DOM
-
2026-05-23historical Active Option
-
2026-04-15price $250,000
-
2026-03-25status Back on Market
-
2026-03-20historical Active Option
-
2026-03-16price $270,000
-
2026-01-26price $280,000
-
2025-11-03$290,000 New
-
2025-10-31historical
-
2025-10-01status Back on Market
-
2025-09-30historical
-
2025-07-09price $289,900
-
2025-04-25$295,000 New
ⓘ Source: listings_history table (triggers on properties + properties_extension) + one-shot
backfill from property_details.listing_events for pre-trigger history.
Tax reassessment forecast TX · Resets to sale price
- Current annual tax
- $5,362 · $447/mo
- Projected year-2 tax
- $5,362 · $447/mo
- Expected delta
- $0/yr ($0/mo · 0.0%)
ⓘ Screening estimate from a state-policy table — verify with the county assessor before closing.
Climate risk First Street
- Flood 1/10 Low FEMA zone X (unshaded) · 0% chance over 30 yrs
- Wildfire 5/10 Major
- Heat 8/10 Severe 7 d/yr ≥108°F today · 22 d/yr by 30 yrs out
- Wind 8/10 Severe 80% chance of damaging wind over 30 yrs
- Air quality 1/10 Low 0 unhealthy d/yr today · 0 by 30 yrs out
Nearby sold comps map
Loading sold comps map…
Walkable amenities ~0.75 mi
Loading nearby amenities…
Taxation est. · year 1
- Rental income
- $26,026
- − Mortgage interest
- −$14,004
- − Property taxes
- −$5,362
- − Insurance
- −$1,250
- − Repairs & maintenance
- −$2,082
- − Management
- −$2,082
- − HOA
- −$396
- − Depreciation
- −$7,273
- Taxable loss
- −$6,423
- Est. tax savings @ 24.0%
- +$1,541
- After-tax cash flow
- $-638/yr
For passive investors: Depreciation is non-cash, so a rental often shows a tax loss while cash-flowing — sheltering income. Rental losses are passive: they offset passive income freely, and up to $25,000/yr can offset ordinary (W-2) income if you actively participate and your MAGI is under $100k (phasing out to $0 by $150k); unused losses carry forward. On sale, claimed depreciation is recaptured at up to 25%, and gains may owe capital-gains tax (a 1031 exchange can defer both). Figures are a year-1 estimate at your 24.0% rate — not tax advice; consult a CPA.
Schools (NCES district)
- District
- Schertz-Cibolo-U City ISD
- NCES district ID
- 4839480
- Math proficiency
- 49% ▼ -12.00%
- Reading proficiency
- 48% ▼ -4.00%
- Median HH income
- $75,790
- Composite
- 44.02/100
- National rank
- #2886
- State rank
- #152 of 826 in TX
Livability — Cibolo
- Score
- 72/100
- State rank
- #261
- US rank
- #6177
Category grades
Schools grade is shown separately in the Schools card above.
Census & demographics
- Census place
- Cibolo, TX
- County
- Guadalupe County · 147,291 people
- City population
- 49,784
- Metro
- San Antonio-New Braunfels, TX
- Population (ZIP)
- 49,784
- Household income
- $113,004
- Rent vs Own
- Severe rent burden
- 521.0
Population outlook (Guadalupe County) Hauer SSP2
- Today (2025)
- 196,854 people
- By 2030
- 220,210 · +11.9%
- By 2040
- 268,004 · +36.1%
- By 2050
- 316,333 · +60.7%
- By 2075
- 434,747 · +120.8%
- By 2100
- 520,447 · +164.4%
Race, ethnicity, and origin ACS 2023
- Neighborhood character
- Diverse neighborhood (Simpson 0.68)
- Race & ethnicity
- White 46% Hispanic / Latino 30% Two or more races 22% Black 13% Asian 3%
- Hispanic origin (detail)
- Mexican 22% Puerto Rican 4%
- Common ancestry
- Italian 2% Lithuanian 2% Slovak 2%
- Foreign-born
- 7% · Canada, Vietnam, China
- Languages at home
- 83% English-only · Spanish 13% Vietnamese 1% German/W. Germanic 1%
Political lean MEDSL · Guadalupe
- 2024 margin
- Strong R (+29.5) · D 34.8% · R 64.3%
- 2008→2024 swing
- +1.5pp toward D · 2008: -31.0pp · 2024: -29.5pp
- All cycles
- 2024: R+29.5 2020: R+24.2 2016: R+31.8 2012: R+35.1 2008: R+31.0
Not yet ingested
- Civics
- —
Market trends
- HPI YoY
- ▲ 0.47%
- Current HPI
- 182.7296
- Rent YoY
- ▲ 2.42%
- Metro
- San Antonio-New Braunfels, TX
- State GDP YoY
- ▲ 3.95%
- F500 in state
- 110
Industry mix (Fortune 500 HQ in TX)
| Industry | F500 HQs | Revenue |
|---|---|---|
| Energy | 16 | $1,198B |
|
||
| Technology | 5 | $198B |
|
||
| Engineering / Construction | 4 | $72B |
|
||
| Energy Services | 3 | $60B |
|
||
| Utilities | 3 | $41B |
|
||
| Healthcare | 2 | $330B |
|
||
Price history
-15.3% since first listed12 events — show timeline
- 2026-05-23 Contingent — LERA
- 2026-04-15 Price Changed $250,000 LERA
- 2026-03-25 Relisted — LERA
- 2026-03-20 Contingent — LERA
- 2026-03-16 Price Changed $270,000 LERA
- 2026-01-26 Price Changed $280,000 LERA
- 2025-11-03 Listed $290,000 LERA
- 2025-10-31 Listing Removed — LERA
- 2025-10-01 Relisted — LERA
- 2025-09-30 Listing Removed — LERA
- 2025-07-09 Price Changed $289,900 LERA
- 2025-04-25 Listed $295,000 LERA
Property tax history
+1.4%/yrLatest (2026): $5,362 · -4.2% YoY. Source: county tax records.
Cash-flow waterfall
monthlySold comps — $/sqft
last 12 mo · ≤1 miLoading sold comps…