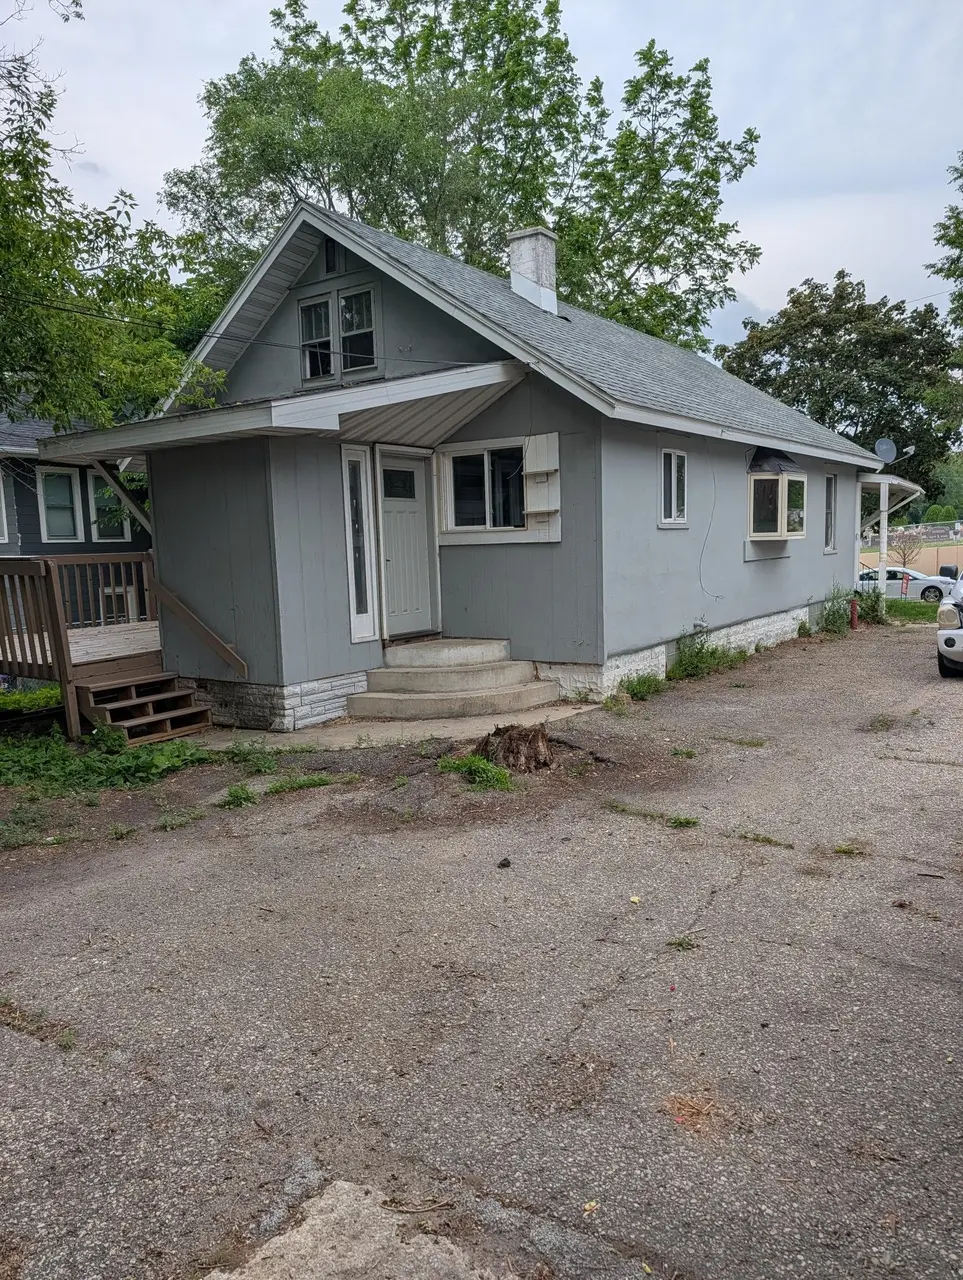
603 11th Ave NE · Rochester, MN
Flood risk 1/10 · Minimal
- FEMA flood zone
- X (unshaded)
- Chance of flooding over 30 yrs
- 0.0%
- Est. flood insurance / yr
- $473 – $860
Fire risk 1/10 · Minimal
- Est. fire insurance / yr
- $888 – $1,650
Heat risk 2/10 · Minimal
- Hot days now (above 98°F)
- 7 days/yr
- Hot days in 30 yrs
- 15 days/yr
Wind risk 2/10 · Minimal
- Chance of severe wind over 30 yrs
- —
Air-quality risk 2/10 · Minimal
- Unhealthy air days now
- 1 days/yr
- Unhealthy air days in 30 yrs
- 1 days/yr
Risk factors via First Street. Map © Google.
Why this score? — see what drove the D+ grade
The composite is a weighted blend of 9 inputs, each scored 0–100. Each bar is that input's sub-score; the figure is the points it added to the 100-point composite (weight × sub-score).
- Cash flow +14.6/30.0
- ARV discount +7.5/15.0
- Rent growth +4.8/5.0
- Livability +4.6/5.0
- DSCR +4.4/10.0
- Schools +4.1/10.0
- 1% rule +3.7/10.0
- Condition / age +2.5/5.0
- Appreciation +0.0/10.0
$219,000
🖨 Deal sheet (PDF) 📄 Offer letter ✓ Due diligence
Listing remarks
Please Note - Dean Durhman is a realtor related to owner Rose Durhman. Great location on bus line. Close to Silver Lake Park and Quarry Hill Park. Property has main floor eat-in kitchen, dining, living room, 2 bedrooms & 3 season porch. Refrigerator & stove stay. Freshly painted. Floors are oak and are redone. Full unfinished basement. Upstairs is the full length of home. Possible children’s room or possible master bedroom. Bath has new surround in tub and new vanity & top. Lot is deep and driveway has asphalt throughout. Driveway large enough for your boat, RV/camper or extra car. 2-car garage. Deck off sliding doors.
Key facts
- Great location
- 3 season porch
- Oak floors
Tags
Property features AI
Exterior
- Parking: 2-car garage
- Utilities: City water connected; City sewer connected; Natural gas; Electric with circuit breakers
- Home design: Residential property; One-and-one-half levels; Main-level primary bedroom
- Construction: Block construction; Asphalt roof (over 8 years old); Block foundation
- Exterior features: Front and rear porches; Deck; Stucco and vinyl exterior; Irregular lot with light tree coverage; 50 x 133 lot
Interior
- Kitchen: Microwave; Range; Disposal; Refrigerator; Eat-in kitchen / breakfast area
- Bedrooms: 2 bedrooms (including main floor primary bedroom)
- Bathrooms: 1 full bath (main floor full bath; basement rough-in)
- Heating & cooling: Forced air heating; Central air conditioning
- Interior features: Disposal; Gas water heater; Microwave; Range; Refrigerator; Deck; Breakfast area / Eat-in kitchen / Kitchen-dining combination; Main floor primary bedroom; Patio; Porch; Washer/Dryer hookup; Full, unfinished block basement
- Laundry & utility: Washer hookup; Washer/Dryer hookup; Electric dryer hookup; Gas dryer hookup; Laundry room (in basement)
Neighborhood map
What this means for you Summary
Snapshot
- This is a 3-bed/1.0-bath single-family listed at $219k.
Deal economics
- At list price, monthly cash flow is $52 ($619/yr) — positive.
- The deal already cash-flows at list — no discount required.
- To meet the 1% rule (rent ≥ 1% of price), the offer needs to be $190k (13.3% below list).
- Recommended offer: $190k (13.3% below list) — sets the bar for 1% rule.
- Cap rate 6.6% vs local median 3.6% in Rochester — top-decile yield for the area; either an underpriced asset or a hidden risk that comps aren't pricing in. Stress-test before assuming the spread holds.
Location & tenants
- Location reads 92/100 on livability (#1 in MN, #27 nationally) — a professional / high-income tenant draw. Strengths: amenities A+, commute A+, employment A+.
- Rochester Public School District (urban): math 40% / reading 51% proficiency, ranked #152 of 301 in MN (top 50%) — families likely to look elsewhere, expect single-tenant / working-renter base with shorter leases.
- Zoned schools: Jefferson Elementary (math 61% / reading 70%, grade B+, #123 of 857 statewide, top 15%, 525 students, 36% FRL); Kellogg Middle (math 42% / reading 53%, grade C-, #93 of 258 statewide, top 37%, 856 students, 43% FRL); Century Senior High (math 37% / reading 67%, grade D+, #111 of 471 statewide, top 26%, 1,698 students, 31% FRL).
- Market conditions: Rents rising fast (+9.2%/yr); 222 active listings in the ZIP; 19 comparable units currently listed for rent nearby; rentals at typical pace (median 16d on market — plan ~3-4 weeks tenant-placement turnaround); solid renter incomes; 1,267 units permitted in Olmsted County in 2024 (915 in 5+ unit buildings).
Forward outlook
- Local home prices are declining (-3.0%/yr); year-one equity from $2k of loan paydown is wiped out by about $7k of value loss. Plan a longer hold.
- Olmsted County population projected at +16% by 2050 — long-run rental-demand tailwind backs the buy-and-hold thesis.
Negotiation context
- Only 13 days on market — expect competitive offers; lowballing is unlikely to land.
- 6 sale attempts since 24y ago; this cycle's ask is 4% above the opening price — seller raised mid-cycle; expect resistance to lowballs.
- Current owner paid $66k; list at $219k implies a 232% gain — meaningful room to come down on a strong offer.
Risks & watch-outs
- Watch-outs: built in 1930 — expect roof / HVAC / electrical / plumbing capex.
Questions for the listing agent
- Built in 1930 — when were the roof, HVAC, electrical panel, plumbing, and water heater last replaced?
- Is there a deadline driving the sale (1031 exchange, divorce, estate, relocation)? That informs how much negotiation room exists.
- Schools are A-rated — typically a magnet for longer-tenancy family renters. What's the average tenant stay here, and is there a school-zone premium baked into asking?
- The area grade is low — what's the realistic commute time and amenity access for the typical tenant pool here? Any planned neighborhood developments (good or bad) we should know about?
- What's the average days-on-market for RENTAL listings here right now (not sales)? A rising rental-DOM trend means longer vacancies and softer asking-rent achievability than the comps imply.
- What's the recent tenant-quality profile in this submarket — average credit score on applications, eviction rate, late-payment / NSF rate, and stable-employment percentage? A property-management company in the area should have these aggregated.
- How much new for-sale + rental construction is in the pipeline within 1–3 miles? Heavy new supply typically softens prices + rents 12–24 months out; constrained supply supports both.
Investment metrics
- 1% rule
- 0.87% ✗
- Cap rate
- 6.58%
- Cash-on-cash
- 1.01%
- DSCR
- 1.04
- GRM
- 9.6
CMA / ARV
No comps found within radius.
Projected returns pro-forma
-3.0% appreciation · 8.0% rent growth · sell at horizon
- IRR
- -9.4%
- Equity multiple
- 0.64×
- Total profit
- $-22,177
- Equity at exit
- $32,654
- IRR
- 5.5%
- Equity multiple
- 1.50×
- Total profit
- $30,558
- Equity at exit
- $18,935
Cash invested: $61,320 (down + closing). Projections, not guarantees.
Landlord ↔ Tenant lean methodology
- Overall (STATE)
- 46 Balanced
- State Minnesota
- 46 Balanced · D+2
- County
- — inherits STATE
- City
- — inherits STATE
ZIP-level market 55906
- Home prices YoY
- -33.0%
- Rents YoY
- 9.2%
- Active inventory
- 222
- Price-to-rent
- 9.6×
Monthly cashflow live
- Estimated rent
- $1,899 high interval (Pro) →
- Mortgage (P&I)
- −$1,148
- Tax from tax record
- −$209 /mo · $2,510/yr
- Insurance
- −$91
- HOA
- −$0
- Vacancy / Maint / Mgmt
- −$399
- Net cashflow
- $52
Break-even live
Sensitivity live
| Price | -10% $176 | -5% $114 | +0% $52 | +5% $-10 | +10% $-72 |
|---|---|---|---|---|---|
| Rent | -10% $-98 | -5% $-23 | +0% $52 | +5% $127 | +10% $202 |
| Rate | -1.0pp $162 | -0.5pp $107 | base $52 | +0.5pp $-5 | +1.0pp $-63 |
UW: 25.0% down · 7.5% · 30yr · 1.5% tax · 5.0% vac · 8.0% maint · 8.0% mgmt
Financing live
Cash to close
- Down payment
- $54,750
- Closing costs
- $6,570
- Reserves months
- —
- Total cash needed
- —
Loan-product check · same deal, 3 products live
Conventional
25% down · 7.5% · 30yr
- Down + closing
- —
- Monthly P&I
- —
- Monthly cashflow
- —
- DSCR
- —
- Eligible?
- —
Personal DTI + credit; lowest rate.
DSCR
20% down · 8.5% · 30yr
- Down + closing
- —
- Monthly P&I
- —
- Monthly cashflow
- —
- DSCR
- —
- Eligible?
- —
No personal income docs; deal must DSCR.
Hard money
10% down · 12.0% · 12mo
- Down + closing
- —
- Monthly P&I
- —
- Monthly cashflow
- —
- DSCR
- —
- Eligible?
- —
Short-term bridge; refi at stabilization.
Rent comps 19 comps
| Address | Beds | Baths | Sqft | Rent | $/sqft | DOM | Units | Dist |
|---|---|---|---|---|---|---|---|---|
| 449 E Center St Rochester, MN | 1.0–3.0 | 1.0–2.0 | 1165 | $3,795 | $3.26 | 15d | 40 | 0.52mi |
| 28 7th St NE Rochester, MN | 2.0 | 1.0–2.0 | 789 | $2,750 | $3.49 | 23d | 18 | 0.63mi |
| 401 Broadway Ave N Rochester, MN | 2.0 | 1.0–2.0 | 799 | $1,977 | $2.47 | 15d | 22 | 0.74mi |
| 400 1st Ave NW Rochester, MN | 1.0–2.0 | 1.0–2.0 | 819 | $1,510 | $1.84 | 15d | 7 | 0.76mi |
| 513 13th Ave SE Rochester, MN | 2.0 | 1.0 | 850 | $1,550 | $1.82 | 45d | 1 | 0.79mi |
| 220 Broadway Ave S #911 Rochester, MN | 2.0 | 2.0 | 1078 | $1,750 | $1.62 | 45d | 1 | 0.87mi |
| 204 13th St NW Rochester, MN | 2.0 | 1.0 | 705 | $1,208 | $1.71 | 15d | 4 | 0.97mi |
| 226 13th St NW Unit 27 Rochester, MN | 2.0 | 1.0 | 705 | $1,120 | $1.59 | 23d | 1 | 1.02mi |
| 603 1st St SW Rochester, MN | 2.0 | 1.0 | 512 | $1,295 | $2.53 | 15d | 3 | 1.19mi |
| 511 3rd Ave SW Rochester, MN | 2.0 | 1.0 | 647 | $1,795 | $2.77 | 15d | 26 | 1.22mi |
| 705 1st Ave SW Rochester, MN | 3.0 | 1.0–2.5 | 1135 | $3,875 | $3.41 | 15d | 91 | 1.22mi |
| 1902 8 1/2 St SE Unit Andover 1902-D Rochester, MN | 3.0 | 2.0 | 1100 | $1,250 | $1.14 | 45d | 1 | 1.23mi |
| 2016 8 1/2 St SE Unit Andover 2016-A Rochester, MN | 3.0 | 2.0 | 1100 | $1,250 | $1.14 | 45d | 1 | 1.27mi |
| 524 10th St SE Rochester, MN | 2.0 | 1.0 | 850 | $1,475 | $1.74 | 45d | 1 | 1.31mi |
| 625 3rd St SW Rochester, MN | 1.0–2.0 | 1.0 | 612 | $1,395 | $2.28 | 15d | 3 | 1.31mi |
| 970 11th Ave NW Rochester, MN | 1.0–3.0 | 1.0–2.0 | 952 | $1,734 | $1.82 | 15d | 6 | 1.46mi |
| 2111 Wheelock Dr NE Rochester, MN | 2.0–3.0 | 2.0 | 1135 | $1,700 | $1.50 | 15d | 3 | 1.46mi |
| 718 5th St SW Rochester, MN | 2.0 | 1.0 | 722 | $1,400 | $1.94 | 15d | 4 | 1.46mi |
| 950 11th Ave NW Rochester, MN | 2.0–3.0 | 2.0 | 1225 | $1,695 | $1.38 | 15d | 8 | 1.49mi |
Listing history 11 events
-
2026-06-21days on market $219,000 Active 13 DOM
-
2026-06-19days on market $219,000 Active 11 DOM
-
2026-06-18days on market $219,000 Active 10 DOM
-
2026-06-17days on market $219,000 Active 9 DOM
-
2026-06-16days on market $219,000 Active 8 DOM
-
2026-06-15days on market $219,000 Active 7 DOM
-
2026-06-14days on market $219,000 Active 5 DOM
-
2026-06-13days on market $219,000 Active 4 DOM
-
2026-06-10pricedays on market $219,000 Active 2 DOM
-
2026-06-09remarks 632-char remark
-
2026-06-09$210,000 Active 1 DOM
ⓘ Source: listings_history table (triggers on properties + properties_extension) + one-shot
backfill from property_details.listing_events for pre-trigger history.
Tax reassessment forecast MN · Partial reset (capped growth)
- Current annual tax
- $2,510 · $209/mo
- Projected year-2 tax
- $2,510 · $209/mo
- Expected delta
- $0/yr ($0/mo · 0.0%)
ⓘ Screening estimate from a state-policy table — verify with the county assessor before closing.
Climate risk First Street
- Flood 1/10 Low FEMA zone X (unshaded) · 0% chance over 30 yrs
- Wildfire 1/10 Low
- Heat 2/10 Low 7 d/yr ≥98°F today · 15 d/yr by 30 yrs out
- Wind 2/10 Low
- Air quality 2/10 Low 1 unhealthy d/yr today · 1 by 30 yrs out
Nearby sold comps map
Loading sold comps map…
Walkable amenities ~0.75 mi
Loading nearby amenities…
Taxation est. · year 1
- Rental income
- $22,792
- − Mortgage interest
- −$12,267
- − Property taxes
- −$2,510
- − Insurance
- −$1,095
- − Repairs & maintenance
- −$1,823
- − Management
- −$1,823
- − Depreciation
- −$6,371
- Taxable loss
- −$3,098
- Est. tax savings @ 24.0%
- +$744
- After-tax cash flow
- $1,362/yr
For passive investors: Depreciation is non-cash, so a rental often shows a tax loss while cash-flowing — sheltering income. Rental losses are passive: they offset passive income freely, and up to $25,000/yr can offset ordinary (W-2) income if you actively participate and your MAGI is under $100k (phasing out to $0 by $150k); unused losses carry forward. On sale, claimed depreciation is recaptured at up to 25%, and gains may owe capital-gains tax (a 1031 exchange can defer both). Figures are a year-1 estimate at your 24.0% rate — not tax advice; consult a CPA.
Schools (NCES district)
- District
- Rochester Public School District
- NCES district ID
- 2731800
- Math proficiency
- 40% ▼ -10.00%
- Reading proficiency
- 51% ▼ -4.00%
- Median HH income
- $66,540
- Composite
- 40.6/100
- National rank
- #3695
- State rank
- #152 of 301 in MN
Livability — Rochester
- Score
- 92/100
- State rank
- #1
- US rank
- #27
Category grades
Schools grade is shown separately in the Schools card above.
Census & demographics
- Census place
- Rochester, MN
- County
- Olmsted County · 135,035 people
- City population
- 135,035
- Metro
- Rochester, MN
- Population (ZIP)
- 20,437
- Household income
- $93,685
- Rent vs Own
- Severe rent burden
- 438.0
Population outlook (Olmsted County) Hauer SSP2
- Today (2025)
- 165,999 people
- By 2030
- 172,425 · +3.9%
- By 2040
- 183,785 · +10.7%
- By 2050
- 192,981 · +16.3%
- By 2075
- 215,284 · +29.7%
- By 2100
- 224,887 · +35.5%
Race, ethnicity, and origin ACS 2023
- Neighborhood character
- Predominantly White (75%)
- Race & ethnicity
- White 75% Asian 8% Black 6% Two or more races 6% Hispanic / Latino 5%
- Common ancestry
- Portuguese 14% Romanian 3% Italian 2%
- Foreign-born
- 11% · China, Canada
- Languages at home
- 86% English-only · Spanish 3% Chinese 3% Other Asian/Pacific 2%
Political lean MEDSL · Olmsted
- 2024 margin
- D (+10.7) · D 54.3% · R 43.6% · Other 2.1%
- 2008→2024 swing
- +7.4pp toward D · 2008: 3.3pp · 2024: 10.7pp
- All cycles
- 2024: D+10.7 2020: D+10.7 2016: D+0.8 2012: D+3.2 2008: D+3.3
Not yet ingested
- Civics
- —
Market trends
- HPI YoY
- ▼ -124.46%
- Current HPI
- 252.9003
- Rent YoY
- ▲ 9.18%
- Metro
- Rochester, MN
- State GDP YoY
- ▲ 2.41%
- F500 in state
- 34
Industry mix (Fortune 500 HQ in MN)
| Industry | F500 HQs | Revenue |
|---|---|---|
| Healthcare | 2 | $407B |
|
||
| Retail | 2 | $150B |
|
||
| Consumer Goods | 2 | $32B |
|
||
| Industrial Machinery | 2 | $6B |
|
||
| Agriculture | 1 | $40B |
|
||
| Healthcare / Medical Devices | 1 | $32B |
|
||
Price history
+104.1% since first listed14 events — show timeline
- 2026-06-08 Listed $210,000 NORTHSTARMLS as Distributed by MLS Grid
- 2022-03-14 Listing Removed — NORTHSTARMLS as Distributed by MLS Grid
- 2021-09-28 Contingent — NORTHSTARMLS as Distributed by MLS Grid
- 2021-07-28 Price Changed $185,900 NORTHSTARMLS as Distributed by MLS Grid
- 2021-06-30 Listed $195,000 NORTHSTARMLS as Distributed by MLS Grid
- 2018-12-10 Listing Removed — NORTHSTARMLS as Distributed by MLS Grid
- 2012-10-24 Listed $89,900 NORTHSTARMLS as Distributed by MLS Grid
- 2012-10-24 Listed $89,900 NORTHSTARMLS as Distributed by MLS Grid
- 2007-08-31 Sold (MLS) $66,000 NORTHSTARMLS as Distributed by MLS Grid
- 2007-01-26 Listed $74,900 NORTHSTARMLS as Distributed by MLS Grid
- 2003-02-07 Sold (Public Records) $100,000 Public Records
- 2003-02-07 Sold (MLS) $100,000 NORTHSTARMLS as Distributed by MLS Grid
- 2002-12-23 Listing Removed — NORTHSTARMLS as Distributed by MLS Grid
- 2002-07-02 Listed $102,900 NORTHSTARMLS as Distributed by MLS Grid
Property tax history
+7.2%/yrLatest (2025): $2,510 · -0.1% YoY. Source: county tax records.
Cash-flow waterfall
monthlySold comps — $/sqft
last 12 mo · ≤1 miLoading sold comps…