4297 Duff Rd · Leitchfield, KY
Flood risk 1/10 · Minimal
- FEMA flood zone
- X (unshaded)
- Chance of flooding over 30 yrs
- 0.0%
- Est. flood insurance / yr
- $507 – $1,088
Fire risk 5/10 · Moderate
- Est. fire insurance / yr
- $839 – $1,559
Heat risk 4/10 · Minor
- Hot days now (above 106°F)
- 7 days/yr
- Hot days in 30 yrs
- 19 days/yr
Wind risk 3/10 · Minor
- Chance of severe wind over 30 yrs
- 5.0%
Air-quality risk 2/10 · Minimal
- Unhealthy air days now
- 0 days/yr
- Unhealthy air days in 30 yrs
- 1 days/yr
Risk factors via First Street. Map © Google.
Why this score? — see what drove the C grade
The composite is a weighted blend of 9 inputs, each scored 0–100. Each bar is that input's sub-score; the figure is the points it added to the 100-point composite (weight × sub-score).
- Cash flow +22.0/30.0
- ARV discount +7.5/15.0
- DSCR +7.0/10.0
- 1% rule +4.7/10.0
- Livability +3.6/5.0
- Appreciation +3.1/10.0
- Schools +2.8/10.0
- Rent growth +2.5/5.0
- Condition / age +2.5/5.0
$155,000
🖨 Deal sheet (PDF) 📄 Offer letter ✓ Due diligence
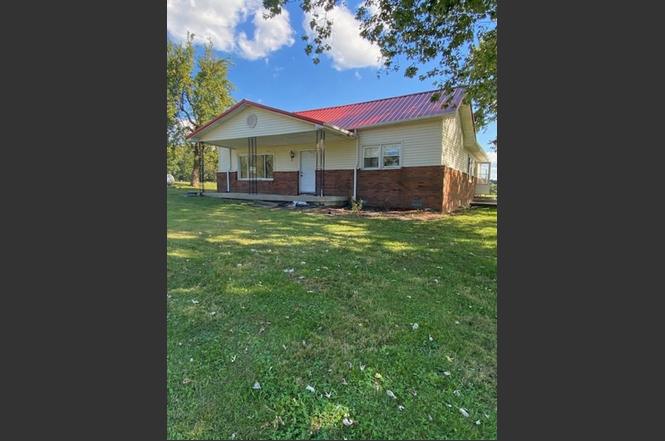
Listing remarks
This farmhouse sits on 1.9 acres and has a barn with electric and a one car garage space that is insulated. 5 minutes from 2 public boat ramps on Rough River Lake! There is also a detached 2 car garage with electric and a nice wood stove that will keep you warm for projects in the cooler months. The house has 3 bedrooms, all with barn doors, one bathroom with new vanity, spacious living room and a dining room which could be used as a family room. The laundry room is set up to easily add a ½ bathroom. Newer appliances, a farm sink and beautiful new cabinets and countertops are included in the open concept kitchen. This home also has newer laminate flooring throughout, a large attic f
Key facts
- Barn with electric
- New vanity
- Open concept kitchen
Tags
Property features AI
Finance
- Other: Approximately 1.9-acre lot
Exterior
- Parking: 2-car garage; Gravel parking
- Utilities: Septic tank
- Home design: Single-family residence; One story; Residential property
- Construction: Brick construction; Metal roof
- Exterior features: Patio; Porch; Storm doors
Interior
- Kitchen: Microwave, Range, Refrigerator, Dishwasher not listed
- Bathrooms: 1 full bathroom
- Heating & cooling: Propane heating and space heater; Ceiling fans and window air conditioning units
- Interior features: Dryer, Washer, Microwave, Range, Refrigerator, Electric water heater; Crawl space basement
- Laundry & utility: Washer and Dryer included
Neighborhood map
What this means for you Summary
Snapshot
- This is a 3-bed/1.0-bath other listed at $155k.
Deal economics
- At list price, monthly cash flow is $245 ($3k/yr) — positive.
- The deal already cash-flows at list — no discount required.
- To meet the 1% rule (rent ≥ 1% of price), the offer needs to be $151k (2.5% below list).
- Recommended offer: $136k (12.0% below list) — sets the bar for market timing.
- Cap rate 8.2% vs local median 4.3% in Leitchfield — top-decile yield for the area; either an underpriced asset or a hidden risk that comps aren't pricing in. Stress-test before assuming the spread holds.
Location & tenants
- Location reads 71/100 on livability (#144 in KY) — a middle-class / working-renter tenant base. Strengths: crime A+, cost of living A+, housing A+; Watch: amenities F, commute F, employment D-.
- Grayson County (rural): math 27% / reading 40% proficiency, ranked #84 of 165 in KY (top 51%) — families likely to look elsewhere, expect single-tenant / working-renter base with shorter leases.
- Zoned schools: Oran P Lawler Elementary School (math 37% / reading 47%, grade F, #178 of 676 statewide, top 29%, 413 students, 55% FRL); Grayson County Middle School (math 23% / reading 38%, grade F, #143 of 217 statewide, top 67%, 839 students, 63% FRL); Grayson County High School (math 24% / reading 38%, grade F, #118 of 254 statewide, top 47%, 1,252 students, 61% FRL) — zoned schools at 60% FRL track the district average.
- Market conditions: 180 active listings in the ZIP; 23 units permitted in Grayson County in 2024 (12 in 5+ unit buildings).
Forward outlook
- Local home prices are declining (-3.0%/yr); year-one equity from $1k of loan paydown is wiped out by about $5k of value loss. Plan a longer hold.
Negotiation context
- It's been on market 203 days — a 12% lower offer ($136k) is reasonable based on typical stale-listing flexibility.
- 3 sale attempts since 16y ago; this cycle's ask has dropped $20k (11%) from the opening price — seller is motivated, your offer sets the floor, not the list.
- Current owner paid $85k; list at $155k implies a 82% gain — meaningful room to come down on a strong offer.
Risks & watch-outs
- Climate carrying-cost: moderate wildfire risk — expect insurance premiums to compound above CPI over the hold.
Questions for the listing agent
- It's been on market 203 days. Have you received any prior offers? Is the seller open to a 12% concession, seller financing, or rate buy-down credit?
- Why hasn't it sold? Are there any deal-killer items the seller is aware of (foundation, flood, title, zoning, code violations)?
- Is there a deadline driving the sale (1031 exchange, divorce, estate, relocation)? That informs how much negotiation room exists.
- What's the average days-on-market for RENTAL listings here right now (not sales)? A rising rental-DOM trend means longer vacancies and softer asking-rent achievability than the comps imply.
- What's the recent tenant-quality profile in this submarket — average credit score on applications, eviction rate, late-payment / NSF rate, and stable-employment percentage? A property-management company in the area should have these aggregated.
- How much new for-sale + rental construction is in the pipeline within 1–3 miles? Heavy new supply typically softens prices + rents 12–24 months out; constrained supply supports both.
Investment metrics
- 1% rule
- 0.97% ✗
- Cap rate
- 8.19%
- Cash-on-cash
- 6.79%
- DSCR
- 1.30
- GRM
- 8.6
CMA / ARV
No comps found within radius.
Projected returns pro-forma
-3.0% appreciation · 3.0% rent growth · sell at horizon
- IRR
- -5.9%
- Equity multiple
- 0.78×
- Total profit
- $-9,536
- Equity at exit
- $23,111
- IRR
- 3.7%
- Equity multiple
- 1.27×
- Total profit
- $11,612
- Equity at exit
- $13,402
Cash invested: $43,400 (down + closing). Projections, not guarantees.
Landlord ↔ Tenant lean methodology
- Overall (STATE)
- 83 Strongly Landlord-Friendly
- State Kentucky
- 83 Strongly Landlord-Friendly · R+16
- County
- — inherits STATE
- City
- — inherits STATE
ZIP-level market 42754
- Home prices YoY
- -1.3%
- Active inventory
- 180
- Price-to-rent
- 8.6×
Monthly cashflow live
- Estimated rent
- $1,511 medium interval (Pro) →
- Mortgage (P&I)
- −$813
- Tax from tax record
- −$71 /mo · $847/yr
- Insurance
- −$65
- HOA
- −$0
- Vacancy / Maint / Mgmt
- −$317
- Net cashflow
- $245
Break-even live
Sensitivity live
| Price | -10% $333 | -5% $289 | +0% $245 | +5% $202 | +10% $158 |
|---|---|---|---|---|---|
| Rent | -10% $126 | -5% $186 | +0% $245 | +5% $305 | +10% $365 |
| Rate | -1.0pp $324 | -0.5pp $285 | base $245 | +0.5pp $205 | +1.0pp $164 |
UW: 25.0% down · 7.5% · 30yr · 1.5% tax · 5.0% vac · 8.0% maint · 8.0% mgmt
Financing live
Cash to close
- Down payment
- $38,750
- Closing costs
- $4,650
- Reserves months
- —
- Total cash needed
- —
Loan-product check · same deal, 3 products live
Conventional
25% down · 7.5% · 30yr
- Down + closing
- —
- Monthly P&I
- —
- Monthly cashflow
- —
- DSCR
- —
- Eligible?
- —
Personal DTI + credit; lowest rate.
DSCR
20% down · 8.5% · 30yr
- Down + closing
- —
- Monthly P&I
- —
- Monthly cashflow
- —
- DSCR
- —
- Eligible?
- —
No personal income docs; deal must DSCR.
Hard money
10% down · 12.0% · 12mo
- Down + closing
- —
- Monthly P&I
- —
- Monthly cashflow
- —
- DSCR
- —
- Eligible?
- —
Short-term bridge; refi at stabilization.
Listing history 22 events
-
2026-06-18days on market $155,000 Active 203 DOM
-
2026-06-17days on market $155,000 Active 202 DOM
-
2026-06-16days on market $155,000 Active 201 DOM
-
2026-06-15days on market $155,000 Active 200 DOM
-
2026-06-13days on market $155,000 Active 198 DOM
-
2026-06-12days on market $155,000 Active 197 DOM
-
2026-06-09days on market $155,000 Active 194 DOM
-
2026-06-08days on market $155,000 Active 193 DOM
-
2026-06-07days on market $155,000 Active 192 DOM
-
2026-06-07days on market $155,000 Active 191 DOM
-
2026-06-04days on market $155,000 Active 188 DOM
-
2026-06-02days on market $155,000 Active 187 DOM
-
2026-06-01days on market $155,000 Active 186 DOM
-
2026-05-31days on market $155,000 Active 185 DOM
-
2026-05-31days on market $155,000 Active 184 DOM
-
2026-05-08status Active
-
2026-03-18status Pending
-
2025-11-13price $165,000
-
2025-10-07$175,000 Active
-
2021-05-17soldstatus $85,000
-
2010-12-12historical
-
2010-08-19$77,700
ⓘ Source: listings_history table (triggers on properties + properties_extension) + one-shot
backfill from property_details.listing_events for pre-trigger history.
Tax reassessment forecast KY · Resets to sale price
- Current annual tax
- $847 · $71/mo
- Projected year-2 tax
- $1,333 · $111/mo
- Expected delta
- +$486/yr (+$41/mo · 57.4%)
ⓘ Screening estimate from a state-policy table — verify with the county assessor before closing.
Climate risk First Street
- Flood 1/10 Low FEMA zone X (unshaded) · 0% chance over 30 yrs
- Wildfire 5/10 Major
- Heat 4/10 Moderate 7 d/yr ≥106°F today · 19 d/yr by 30 yrs out
- Wind 3/10 Moderate 5% chance of damaging wind over 30 yrs
- Air quality 2/10 Low 0 unhealthy d/yr today · 1 by 30 yrs out
Nearby sold comps map
Loading sold comps map…
Walkable amenities ~0.75 mi
Loading nearby amenities…
Taxation est. · year 1
- Rental income
- $18,128
- − Mortgage interest
- −$8,682
- − Property taxes
- −$847
- − Insurance
- −$775
- − Repairs & maintenance
- −$1,450
- − Management
- −$1,450
- − Depreciation
- −$4,509
- Taxable income
- $415
- Est. tax owed @ 24.0%
- −$99
- After-tax cash flow
- $2,846/yr
For passive investors: Depreciation is non-cash, so a rental often shows a tax loss while cash-flowing — sheltering income. Rental losses are passive: they offset passive income freely, and up to $25,000/yr can offset ordinary (W-2) income if you actively participate and your MAGI is under $100k (phasing out to $0 by $150k); unused losses carry forward. On sale, claimed depreciation is recaptured at up to 25%, and gains may owe capital-gains tax (a 1031 exchange can defer both). Figures are a year-1 estimate at your 24.0% rate — not tax advice; consult a CPA.
Schools (NCES district)
- District
- Grayson County
- NCES district ID
- 2102300
- Math proficiency
- 27% ▼ -23.00%
- Reading proficiency
- 40% ▼ -17.00%
- Median HH income
- $34,256
- Composite
- 27.55/100
- National rank
- #6944
- State rank
- #84 of 165 in KY
Livability — Leitchfield
- Score
- 71/100
- State rank
- #144
- US rank
- #6810
Category grades
Schools grade is shown separately in the Schools card above.
Census & demographics
- City population
- 15,817
- Population (ZIP)
- 15,817
Population outlook (Grayson County) Hauer SSP2
- Today (2025)
- 26,840 people
- By 2030
- 27,032 · +0.7%
- By 2040
- 27,236 · +1.5%
- By 2050
- 27,076 · +0.9%
- By 2075
- 26,565 · -1.0%
- By 2100
- 24,007 · -10.6%
Race, ethnicity, and origin ACS 2023
- Neighborhood character
- Predominantly White (95%)
- Race & ethnicity
- White 95% Two or more races 3% Black 2%
- Common ancestry
- Slovak 4% Lithuanian 2% Romanian 1%
- Foreign-born
- 1%
- Languages at home
- 99% English-only · Spanish 1%
Political lean MEDSL · Grayson
- 2024 margin
- Solid R (+61.8) · D 18.5% · R 80.3% · Other 1.2%
- 2008→2024 swing
- -26.9pp toward R · 2008: -34.9pp · 2024: -61.8pp
- All cycles
- 2024: R+61.8 2020: R+58.8 2016: R+59.3 2012: R+39.5 2008: R+34.9
Not yet ingested
- Civics
- —
Market trends
- HPI YoY
- ▼ -3.82%
- Current HPI
- 283.0264
- Rent YoY
- —
- Metro
- —
- State GDP YoY
- ▲ 1.81%
- F500 in state
- 4
Industry mix (Fortune 500 HQ in KY)
| Industry | F500 HQs | Revenue |
|---|---|---|
| Healthcare | 1 | $118B |
|
||
| Food / Beverage | 1 | $7B |
|
||
Price history
+112.4% since first listed7 events — show timeline
- 2026-05-08 Relisted — GORAMLS
- 2026-03-18 Pending — GORAMLS
- 2025-11-13 Price Changed $165,000 GORAMLS
- 2025-10-07 Listed $175,000 GORAMLS
- 2021-05-17 Sold (Public Records) $85,000 Public Records
- 2010-12-12 Listing Removed — Metro Search MLS
- 2010-08-19 Listed $77,700 Metro Search MLS
Property tax history
+6.9%/yrLatest (2025): $847 · -0.4% YoY. Source: county tax records.
Cash-flow waterfall
monthlySold comps — $/sqft
last 12 mo · ≤1 miLoading sold comps…