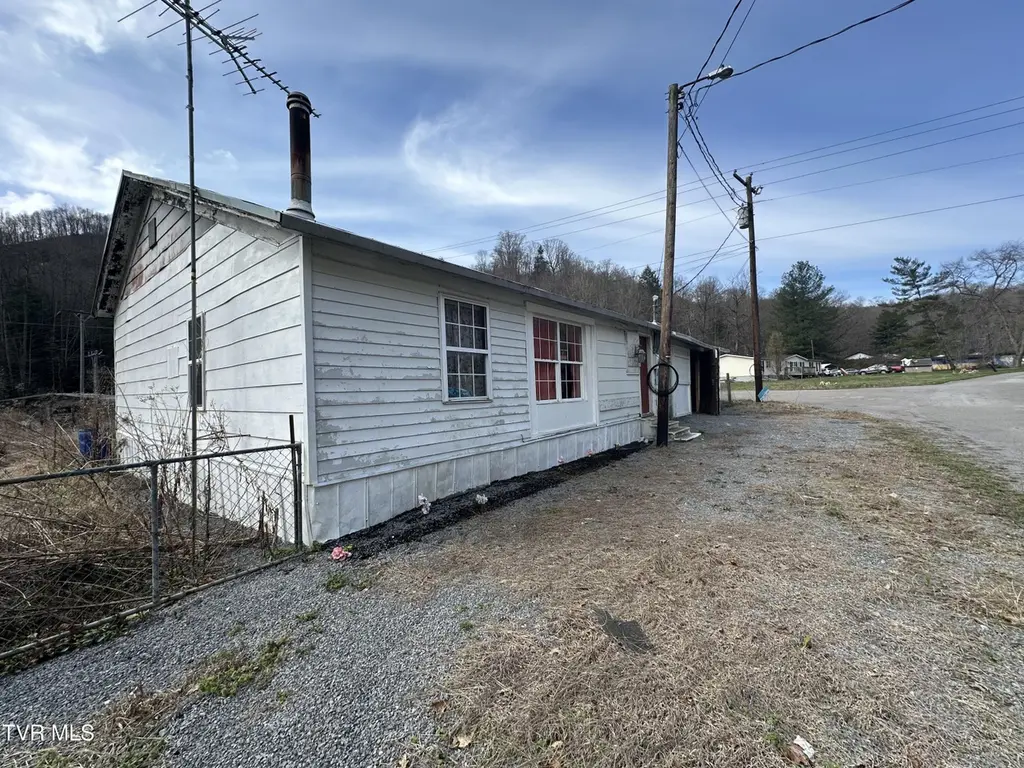
818 Oakdale St · Appalachia, VA
Flood risk 6/10 · Moderate
- FEMA flood zone
- X (unshaded)
- Chance of flooding over 30 yrs
- 0.7%
- Est. flood insurance / yr
- $507 – $1,088
Fire risk 6/10 · Moderate
- Est. fire insurance / yr
- $666 – $1,236
Heat risk 3/10 · Minor
- Hot days now (above 95°F)
- 10 days/yr
- Hot days in 30 yrs
- 27 days/yr
Wind risk 2/10 · Minimal
- Chance of severe wind over 30 yrs
- —
Air-quality risk 1/10 · Minimal
- Unhealthy air days now
- 0 days/yr
- Unhealthy air days in 30 yrs
- 0 days/yr
Risk factors via First Street. Map © Google.
Why this score? — see what drove the A- grade
The composite is a weighted blend of 9 inputs, each scored 0–100. Each bar is that input's sub-score; the figure is the points it added to the 100-point composite (weight × sub-score).
- Cash flow +30.0/30.0
- ARV discount +15.0/15.0
- 1% rule +10.0/10.0
- DSCR +10.0/10.0
- Schools +6.3/10.0
- Appreciation +3.1/10.0
- Livability +2.8/5.0
- Rent growth +2.5/5.0
- Condition / age +2.5/5.0
$35,000
🖨 Deal sheet 📄 Offer letter ✓ Due diligence
Listing remarks MLS
Looking for a place to live in or a place to rent out? Either in or out, this investment property is a great way to go! It's currently inhabitable so if you need a place to stay while it's fixed up, no problem there! Home is being sold ''as is'' and won't last long! Buyers and Buyers' agents to verify the information contained in this listing. Subject to Errors and Omissions.
Key facts
- 4,356 sq ft lot
- 2 parking spots
- Built 1978
Neighborhood map
What this means for you Summary
Snapshot
- This is a 2-bed/1.0-bath single-family listed at $35k.
Deal economics
- At list price, monthly cash flow is $536 ($6k/yr) — positive.
- The deal already cash-flows at list — no discount required.
- Meets the 1% rule at list price ($939 rent vs $35k).
- Recommended offer: $33k (6.0% below list) — sets the bar for market timing.
Location & tenants
- Location reads 56/100 on livability (#505 in VA) — a working-class tenant base; expect higher turnover. Strengths: crime A+, cost of living A+, housing A-; Watch: schools F, amenities F, commute F.
- Wise County Public School District (town): math 74% / reading 79% proficiency, ranked #11 of 131 in VA (top 8%) — strong family-tenant draw, lease renewals of 3-5y typical.
- Market conditions: 25 active listings in the ZIP; 17 units permitted in Wise County in 2024 (0 in 5+ unit buildings).
Forward outlook
- Local home prices are declining (-3.0%/yr); year-one equity from $242 of loan paydown is wiped out by about $1k of value loss. Plan a longer hold.
- Wise County population projected at -26% by 2050 — secular population decline; favor cash flow + early exit over multi-decade hold.
- At projected returns (-3.0% appreciation + 3.0% rent growth), your $10k cash investment doubles in ~2 years — after that, you're playing with house money.
Negotiation context
- It's been on market 90 days — a 6% lower offer ($33k) is reasonable based on typical stale-listing flexibility.
- 3 sale attempts since 2y ago; this cycle's ask has dropped $5k (12%) from the opening price — seller is motivated, your offer sets the floor, not the list.
- Current owner paid $18k; list at $35k implies a 100% gain — meaningful room to come down on a strong offer.
Risks & watch-outs
- Climate carrying-cost: major flood risk; major wildfire risk — expect insurance premiums to compound above CPI over the hold.
Questions for the listing agent
- It's been on market 90 days. Have you received any prior offers? Is the seller open to a 6% concession, seller financing, or rate buy-down credit?
- Built in 1978 — when were the roof, HVAC, electrical panel, plumbing, and water heater last replaced?
- Why hasn't it sold? Are there any deal-killer items the seller is aware of (foundation, flood, title, zoning, code violations)?
- Is there a deadline driving the sale (1031 exchange, divorce, estate, relocation)? That informs how much negotiation room exists.
- Schools are F-rated, which usually means shorter tenancies and higher turnover. Who's the typical renter profile here, and what's been the actual vacancy rate?
- What's the average days-on-market for RENTAL listings here right now (not sales)? A rising rental-DOM trend means longer vacancies and softer asking-rent achievability than the comps imply.
- What's the recent tenant-quality profile in this submarket — average credit score on applications, eviction rate, late-payment / NSF rate, and stable-employment percentage? A property-management company in the area should have these aggregated.
- How much new for-sale + rental construction is in the pipeline within 1–3 miles? Heavy new supply typically softens prices + rents 12–24 months out; constrained supply supports both.
Investment metrics
- 1% rule
- 2.68% ✓
- Cap rate
- 24.66%
- Cash-on-cash
- 65.58%
- DSCR
- 3.92
- GRM
- 3.1
CMA / ARV
- ARV (median comp)
- $42,599
- List price
- $35,000
- Delta
- -17.84%
- Verdict
- UNDERPRICED
- Comps
- 3 within 1.0 mi
Show comp detail 2 sales within ~0.75 mi
| Address | Dist | Beds/Ba | Sqft | Sold | Price | $/sf | Match |
|---|---|---|---|---|---|---|---|
| 2716 Ash St | 0.32mi | 2/1.0 | 990 (-3%) | 10mo | $75,000 | $76 | 72 |
| 640 Exeter Rd | 0.29mi | 3/1.0 (+1) | 930 (-9%) | 8mo | $35,000 | $38 | 60 |
Match score weights: distance 35% · size 25% · config 20% · recency 20%. Top-matched comps best support the ARV.
Projected returns pro-forma
-3.0% appreciation · 3.0% rent growth · sell at horizon
- IRR
- 64.8%
- Equity multiple
- 3.90×
- Total profit
- $28,432
- Equity at exit
- $5,219
- IRR
- 69.1%
- Equity multiple
- 8.01×
- Total profit
- $68,650
- Equity at exit
- $3,026
Cash invested: $9,800 (down + closing). Projections, not guarantees.
Landlord ↔ Tenant lean methodology
- Overall (STATE)
- 55 Moderately Landlord-Leaning
- State Virginia
- 55 Moderately Landlord-Leaning · D+2
- County
- — inherits STATE
- City
- — inherits STATE
ZIP-level market 24216
- Home prices YoY
- -3.3%
- Active inventory
- 25
- Price-to-rent
- 3.1×
Monthly cashflow live
- Estimated rent
- $939 medium interval (Pro) →
- Mortgage (P&I)
- −$184
- Tax from tax record
- −$8 /mo · $96/yr
- Insurance
- −$15
- HOA
- −$0
- Vacancy / Maint / Mgmt
- −$197
- Net cashflow
- $536
Break-even live
UW: 25.0% down · 7.5% · 30yr · 1.5% tax · 5.0% vac · 8.0% maint · 8.0% mgmt
Financing live
Cash to close
- Down payment
- $8,750
- Closing costs
- $1,050
- Reserves months
- —
- Total cash needed
- —
Loan-product check · same deal, 3 products live
Conventional
25% down · 7.5% · 30yr
- Down + closing
- —
- Monthly P&I
- —
- Monthly cashflow
- —
- DSCR
- —
- Eligible?
- —
Personal DTI + credit; lowest rate.
DSCR
20% down · 8.5% · 30yr
- Down + closing
- —
- Monthly P&I
- —
- Monthly cashflow
- —
- DSCR
- —
- Eligible?
- —
No personal income docs; deal must DSCR.
Hard money
10% down · 12.0% · 12mo
- Down + closing
- —
- Monthly P&I
- —
- Monthly cashflow
- —
- DSCR
- —
- Eligible?
- —
Short-term bridge; refi at stabilization.
Listing history 27 events
-
2026-06-18days on market $35,000 Active 90 DOM
-
2026-06-17days on market $35,000 Active 89 DOM
-
2026-06-16days on market $35,000 Active 88 DOM
-
2026-06-15days on market $35,000 Active 87 DOM
-
2026-06-15days on market $35,000 Active 86 DOM
-
2026-06-13days on market $35,000 Active 85 DOM
-
2026-06-12pricedays on market $35,000 Active 84 DOM
-
2026-06-09days on market $40,000 Active 81 DOM
-
2026-06-08days on market $40,000 Active 80 DOM
-
2026-06-08days on market $40,000 Active 79 DOM
-
2026-06-07days on market $40,000 Active 78 DOM
-
2026-06-03days on market $40,000 Active 75 DOM
-
2026-06-02days on market $40,000 Active 74 DOM
-
2026-06-01days on market $40,000 Active 73 DOM
-
2026-05-31days on market $40,000 Active 72 DOM
-
2026-03-20$40,000 Active 379-char remark
Show marketing remark (379 chars)
Looking for a place to live in or a place to rent out? Either in or out, this investment property is a great way to go! It's currently inhabitable so if you need a place to stay while it's fixed up, no problem there! Home is being sold ''as is'' and won't last long! Buyers and Buyers' agents to verify the information contained in this listing. Subject to Errors and Omissions.
-
2025-12-15historical
-
2025-08-09price $19,000
-
2025-06-23price $16,500
-
2025-06-05price $20,000
-
2025-04-30price $30,000
-
2025-04-02price $40,000
-
2025-03-18$50,000 Active
-
2024-06-25soldstatus $17,500 Closed
-
2024-06-14status Pending
-
2024-05-31$17,500 Active
-
1996-03-29soldstatus $7,700
ⓘ Source: listings_history table (triggers on properties + properties_extension) + one-shot
backfill from property_details.listing_events for pre-trigger history.
Tax reassessment forecast VA · Resets to sale price
- Current annual tax
- $96 · $8/mo
- Projected year-2 tax
- $287 · $24/mo
- Expected delta
- +$191/yr (+$16/mo · 199.2%)
ⓘ Screening estimate from a state-policy table — verify with the county assessor before closing.
Climate risk First Street
- Flood 6/10 Major FEMA zone X (unshaded) · 70% chance over 30 yrs
- Wildfire 6/10 Major
- Heat 3/10 Moderate 10 d/yr ≥95°F today · 27 d/yr by 30 yrs out
- Wind 2/10 Low
- Air quality 1/10 Low 0 unhealthy d/yr today · 0 by 30 yrs out
Nearby sold comps map
Loading sold comps map…
Walkable amenities ~0.75 mi
Loading nearby amenities…
Taxation est. · year 1
- Rental income
- $11,266
- − Mortgage interest
- −$1,961
- − Property taxes
- −$96
- − Insurance
- −$175
- − Repairs & maintenance
- −$901
- − Management
- −$901
- − Depreciation
- −$1,018
- Taxable income
- $6,214
- Est. tax owed @ 24.0%
- −$1,491
- After-tax cash flow
- $4,936/yr
For passive investors: Depreciation is non-cash, so a rental often shows a tax loss while cash-flowing — sheltering income. Rental losses are passive: they offset passive income freely, and up to $25,000/yr can offset ordinary (W-2) income if you actively participate and your MAGI is under $100k (phasing out to $0 by $150k); unused losses carry forward. On sale, claimed depreciation is recaptured at up to 25%, and gains may owe capital-gains tax (a 1031 exchange can defer both). Figures are a year-1 estimate at your 24.0% rate — not tax advice; consult a CPA.
Schools (NCES district)
- District
- Wise County Public School District
- NCES district ID
- 5104080
- Math proficiency
- 74% ▼ -20.00%
- Reading proficiency
- 79% ▼ -7.00%
- Median HH income
- $35,624
- Composite
- 63.37/100
- National rank
- #625
- State rank
- #11 of 131 in VA
Livability — Appalachia
- Score
- 56/100
- State rank
- #505
- US rank
- #22417
Category grades
Schools grade is shown separately in the Schools card above.
Census & demographics
- Population (ZIP)
- 2,356
Population outlook (Wise County) Hauer SSP2
- Today (2025)
- 35,714 people
- By 2030
- 33,742 · -5.5%
- By 2040
- 29,870 · -16.4%
- By 2050
- 26,233 · -26.5%
- By 2075
- 18,296 · -48.8%
- By 2100
- 12,147 · -66.0%
Race, ethnicity, and origin ACS 2023
- Neighborhood character
- Predominantly White (88%)
- Race & ethnicity
- White 88% Two or more races 7% Black 5% Hispanic / Latino 2%
- Common ancestry
- Slovak 2% Portuguese 2% Lithuanian 2%
- Foreign-born
- 1%
- Languages at home
- 99% English-only · Spanish 1%
Political lean MEDSL · Wise
- 2024 margin
- Solid R (+63.3) · D 18.1% · R 81.4%
- 2008→2024 swing
- -35.6pp toward R · 2008: -27.7pp · 2024: -63.3pp
- All cycles
- 2024: R+63.3 2020: R+61.7 2016: R+62.0 2012: R+48.8 2008: R+27.7
Not yet ingested
- Civics
- —
Market trends
- HPI YoY
- ▼ -3.82%
- Current HPI
- 112.8878
- Rent YoY
- —
- Metro
- —
- State GDP YoY
- ▲ 2.40%
- F500 in state
- 50
Industry mix (Fortune 500 HQ in VA)
| Industry | F500 HQs | Revenue |
|---|---|---|
| Aerospace / Defense | 4 | $236B |
|
||
| Technology / Defense | 3 | $32B |
|
||
| Financial Services | 2 | $176B |
|
||
| Utilities | 2 | $27B |
|
||
| Insurance | 2 | $25B |
|
||
| Technology | 2 | $15B |
|
||
Price history
+419.5% since first listed12 events — show timeline
- 2026-03-20 Listed $40,000 TVRMLS
- 2025-12-15 Listing Removed — Knoxville MLS
- 2025-08-09 Price Changed $19,000 Knoxville MLS
- 2025-06-23 Price Changed $16,500 Knoxville MLS
- 2025-06-05 Price Changed $20,000 Knoxville MLS
- 2025-04-30 Price Changed $30,000 Knoxville MLS
- 2025-04-02 Price Changed $40,000 Knoxville MLS
- 2025-03-18 Listed $50,000 Knoxville MLS
- 2024-06-25 Sold (MLS) $17,500 TVRMLS
- 2024-06-14 Pending — TVRMLS
- 2024-05-31 Listed $17,500 TVRMLS
- 1996-03-29 Sold (Public Records) $7,700 Public Records
Property tax history
+1.3%/yrLatest (2025): $96 · +0.0% YoY. Source: county tax records.
Cash-flow waterfall
monthlySold comps — $/sqft
last 12 mo · ≤1 miLoading sold comps…