2051 Frank Ave E · Jacksonville, FL
Flood risk 1/10 · Minimal
- FEMA flood zone
- X (unshaded)
- Chance of flooding over 30 yrs
- 0.0%
- Est. flood insurance / yr
- $507 – $1,088
Fire risk 1/10 · Minimal
- Est. fire insurance / yr
- $947 – $1,759
Heat risk 9/10 · Severe
- Hot days now (above 107°F)
- 7 days/yr
- Hot days in 30 yrs
- 20 days/yr
Wind risk 9/10 · Severe
- Chance of severe wind over 30 yrs
- 99.0%
Air-quality risk 4/10 · Minor
- Unhealthy air days now
- 6 days/yr
- Unhealthy air days in 30 yrs
- 6 days/yr
Risk factors via First Street. Map © Google.
Why this score? — see what drove the B+ grade
The composite is a weighted blend of 9 inputs, each scored 0–100. Each bar is that input's sub-score; the figure is the points it added to the 100-point composite (weight × sub-score).
- Cash flow +30.0/30.0
- ARV discount +15.0/15.0
- 1% rule +10.0/10.0
- DSCR +10.0/10.0
- Livability +4.2/5.0
- Schools +3.9/10.0
- Condition / age +2.5/5.0
- Rent growth +2.2/5.0
- Appreciation +0.0/10.0
$75,000
🖨 Deal sheet 📄 Offer letter ✓ Due diligence
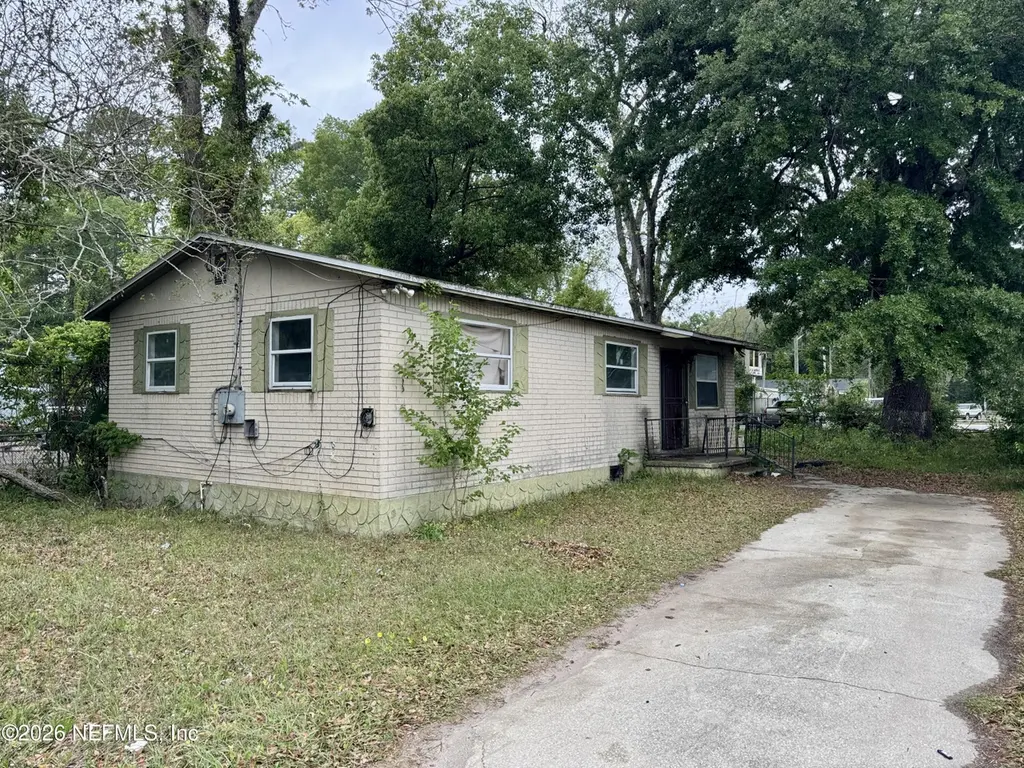
Listing remarks
* Seller is still accepting backup offers * Investor opportunity in Jacksonville's Northside! This 3-bedroom, 1-bath home is a great value-add project with solid bones. Property features city water and a septic system (recently serviced), a 200-amp electrical panel with grounded wiring, and durable flooring already in place. Laundry is located in the kitchen area. Major updates needed include roof and HVAC, making this an ideal light rehab for investors looking to add value. Conveniently located with easy access to major roadways and amenities. Sold as-is, seller to make no repairs. Cash or hard money preferred. Bring your vision and turn this into your next profitable project.
Key facts
- Laundry in kitchen
- Grounded wiring
- Durable flooring
Tags
Property features AI
Finance
- HOA & community: Not a senior community
Exterior
- Parking: Attached garage
- Utilities: Septic tank; Water connected; Central heating; Central air; Wall/window AC units
- Home design: Single Family Residence; One level; Entry on level 1; Faces northeast
- Construction: Brick veneer construction; Shingle roof; Other detached structures on site; Built with conventional foundation
- Exterior features: City street frontage; Asphalt road surface
Interior
- Kitchen: Electric oven; Refrigerator
- Bedrooms: 3 bedrooms
- Bathrooms: 1 full bathroom
- Interior features: Unfurnished; Full yard fencing
- Laundry & utility: Washer hookup; Electric dryer hookup
Neighborhood map
What this means for you Summary
Snapshot
- This is a 3-bed/1.0-bath single-family listed at $75k.
Deal economics
- At list price, monthly cash flow is $493 ($6k/yr) — positive.
- The deal already cash-flows at list — no discount required.
- Meets the 1% rule at list price ($1k rent vs $75k).
- Recommended offer: $70k (6.0% below list) — sets the bar for market timing.
- Cap rate 14.2% vs local median 4.0% in Jacksonville — top-decile yield for the area; either an underpriced asset or a hidden risk that comps aren't pricing in. Stress-test before assuming the spread holds.
Location & tenants
- Location reads 83/100 on livability (#50 in FL, #911 nationally) — a professional / high-income tenant draw. Strengths: amenities A+, commute A+, housing A+.
- Duval (urban): math 46% / reading 45% proficiency, ranked #48 of 73 in FL (top 66%) — families likely to look elsewhere, expect single-tenant / working-renter base with shorter leases.
- Market conditions: Rents soft (-1.4%/yr); 291 active listings in the ZIP; 40 comparable units currently listed for rent nearby; rentals at typical pace (median 24d on market — plan ~3-4 weeks tenant-placement turnaround); lower-income renter base — watch delinquency; 6,503 units permitted in Duval County in 2024 (1,131 in 5+ unit buildings).
- This rent runs 37% of the median local income ($41k/yr) — at the standard rent-burdened threshold; future hikes will face affordability resistance.
Forward outlook
- Local home prices are declining (-3.0%/yr); year-one equity from $519 of loan paydown is wiped out by about $2k of value loss. Plan a longer hold.
- Duval County population projected at +19% by 2050 — long-run rental-demand tailwind backs the buy-and-hold thesis.
- At projected returns (-3.0% appreciation + 0.0% rent growth), your $21k cash investment doubles in ~5 years — after that, you're playing with house money.
Negotiation context
- It's been on market 65 days — a 6% lower offer ($70k) is reasonable based on typical stale-listing flexibility.
- 2 sale attempts; this cycle's ask has dropped $14k (16%) from the opening price — seller is motivated, your offer sets the floor, not the list.
Risks & watch-outs
- Climate carrying-cost: severe wind risk, 99% chance of damaging wind over 30y; extreme-heat days projected 7→20/yr by 2055 (HVAC capex compounding) — expect insurance premiums to compound above CPI over the hold.
Questions for the listing agent
- It's been on market 65 days. Have you received any prior offers? Is the seller open to a 6% concession, seller financing, or rate buy-down credit?
- Built in 1963 — when were the roof, HVAC, electrical panel, plumbing, and water heater last replaced?
- Why hasn't it sold? Are there any deal-killer items the seller is aware of (foundation, flood, title, zoning, code violations)?
- Is there a deadline driving the sale (1031 exchange, divorce, estate, relocation)? That informs how much negotiation room exists.
- Schools are B-rated — typically a magnet for longer-tenancy family renters. What's the average tenant stay here, and is there a school-zone premium baked into asking?
- What's the average days-on-market for RENTAL listings here right now (not sales)? A rising rental-DOM trend means longer vacancies and softer asking-rent achievability than the comps imply.
- What's the recent tenant-quality profile in this submarket — average credit score on applications, eviction rate, late-payment / NSF rate, and stable-employment percentage? A property-management company in the area should have these aggregated.
- How much new for-sale + rental construction is in the pipeline within 1–3 miles? Heavy new supply typically softens prices + rents 12–24 months out; constrained supply supports both.
Investment metrics
- 1% rule
- 1.70% ✓
- Cap rate
- 14.18%
- Cash-on-cash
- 28.16%
- DSCR
- 2.25
- GRM
- 4.9
CMA / ARV
- ARV (on-the-fly)
- $124,960
- Comps found
- 12
Show comp detail 12 sales within ~0.75 mi
| Address | Dist | Beds/Ba | Sqft | Sold | Price | $/sf | Match |
|---|---|---|---|---|---|---|---|
| 5745 Benedict Rd | 0.41mi | 3/1.0 | 904 (+3%) | 5mo | $60,000 | $66 | 73 |
| 3332 Japonica Rd N | 0.57mi | 3/1.0 | 828 (-6%) | 2mo | $103,500 | $125 | 62 |
| 2312 Lantana Ave | 0.45mi | 3/1.0 | 844 (-4%) | 12mo | $79,000 | $94 | 62 |
| 5752 Oprey St | 0.54mi | 3/2.0 | 912 (+4%) | 6mo | $110,000 | $121 | 60 |
| 7447 Oriole St | 0.70mi | 3/1.5 | 912 (+4%) | 8mo | $71,250 | $78 | 53 |
| 2516 Palmdale St | 0.54mi | 3/2.0 | 960 (+9%) | 4mo | $140,000 | $146 | 52 |
| 2570 Spirea St | 0.71mi | 2/1.0 (-1) | 824 (-6%) | 4mo | $90,000 | $109 | 48 |
| 2075 Tuskegee Rd | 0.55mi | 3/1.0 | 975 (+11%) | 17mo | $138,500 | $142 | 43 |
| 2170 Talladega Rd | 0.67mi | 3/1.0 | 1,000 (+14%) | 5mo | $179,017 | $179 | 42 |
| 2440 Edgewood Ave W | 0.57mi | 2/1.0 (-1) | 804 (-9%) | 15mo | $123,600 | $154 | 42 |
| 5522 Paris Ave | 0.70mi | 3/1.0 | 1,000 (+14%) | 11mo | $144,500 | $145 | 36 |
| 5567 Paris Ave | 0.63mi | 3/2.0 | 1,008 (+14%) | 13mo | $158,000 | $157 | 32 |
Match score weights: distance 35% · size 25% · config 20% · recency 20%. Top-matched comps best support the ARV.
Projected returns pro-forma
-3.0% appreciation · 0.0% rent growth · sell at horizon
- IRR
- 18.9%
- Equity multiple
- 1.74×
- Total profit
- $15,515
- Equity at exit
- $11,183
- IRR
- 25.1%
- Equity multiple
- 2.88×
- Total profit
- $39,550
- Equity at exit
- $6,485
Cash invested: $21,000 (down + closing). Projections, not guarantees.
Landlord ↔ Tenant lean methodology
- Overall (STATE)
- 87 Strongly Landlord-Friendly
- State Florida
- 87 Strongly Landlord-Friendly · R+3
- County
- — inherits STATE
- City
- — inherits STATE
ZIP-level market 32208
- Home prices YoY
- -33.6%
- Rents YoY
- -1.4%
- Active inventory
- 291
- Price-to-rent
- 4.9×
Monthly cashflow live
- Estimated rent
- $1,276 high interval (Pro) →
- Mortgage (P&I)
- −$393
- Tax from tax record
- −$90 /mo · $1,086/yr
- Insurance
- −$31
- HOA
- −$0
- Vacancy / Maint / Mgmt
- −$268
- Net cashflow
- $493
Break-even live
UW: 25.0% down · 7.5% · 30yr · 1.5% tax · 5.0% vac · 8.0% maint · 8.0% mgmt
Financing live
Cash to close
- Down payment
- $18,750
- Closing costs
- $2,250
- Reserves months
- —
- Total cash needed
- —
Loan-product check · same deal, 3 products live
Conventional
25% down · 7.5% · 30yr
- Down + closing
- —
- Monthly P&I
- —
- Monthly cashflow
- —
- DSCR
- —
- Eligible?
- —
Personal DTI + credit; lowest rate.
DSCR
20% down · 8.5% · 30yr
- Down + closing
- —
- Monthly P&I
- —
- Monthly cashflow
- —
- DSCR
- —
- Eligible?
- —
No personal income docs; deal must DSCR.
Hard money
10% down · 12.0% · 12mo
- Down + closing
- —
- Monthly P&I
- —
- Monthly cashflow
- —
- DSCR
- —
- Eligible?
- —
Short-term bridge; refi at stabilization.
Rent comps 40 comps
| Address | Beds | Baths | Sqft | Rent | $/sqft | DOM | Units | Dist |
|---|---|---|---|---|---|---|---|---|
| 2185 Benedict Rd Jacksonville, FL | 2.0 | 1.0 | 630 | $995 | $1.58 | 23d | 1 | 0.29mi |
| 2185 Benedict Rd Unit 2187 Jacksonville, FL | 2.0 | 1.0 | 630 | $995 | $1.58 | 10d | 1 | 0.29mi |
| 2092 Benedict Rd Jacksonville, FL | 3.0 | 1.0 | 816 | $1,095 | $1.34 | 23d | 1 | 0.29mi |
| 6114 Strawflower Pl Jacksonville, FL | 3.0 | 1.0 | 1030 | $1,200 | $1.17 | 23d | 1 | 0.37mi |
| 2312 Palmdale St Jacksonville, FL | 3.0 | 2.0 | 972 | $1,231 | $1.27 | 23d | 1 | 0.53mi |
| 5736 Teeler Ave Jacksonville, FL | 3.0 | 1.0 | 852 | $1,000 | $1.17 | 23d | 1 | 0.54mi |
| 1567 Rutledge Ave Jacksonville, FL | 3.0 | 2.0 | 1050 | $1,113 | $1.06 | 23d | 1 | 0.56mi |
| 2534 Aubrey Ave Jacksonville, FL | 4.0 | 2.0 | 759 | $1,250 | $1.65 | 23d | 1 | 0.62mi |
| 1959 W 45th St Jacksonville, FL | 2.0 | 1.0 | 895 | $1,245 | $1.39 | 13d | 1 | 0.64mi |
| 1823 W 44th St Jacksonville, FL | 3.0 | 2.0 | 1066 | $1,500 | $1.41 | 23d | 1 | 0.76mi |
| 1536 W 45th St Jacksonville, FL | 2.0 | 1.0 | 800 | $1,050 | $1.31 | 23d | 1 | 0.76mi |
| 1803 W 44th St Unit 1803 Jacksonville, FL | 2.0 | 1.0 | 750 | $950 | $1.27 | 7d | 1 | 0.77mi |
| 5306 Paris Ave Jacksonville, FL | 3.0 | 1.0 | 944 | $1,150 | $1.22 | 23d | 1 | 0.78mi |
| 2268 W 44th St Jacksonville, FL | 3.0 | 2.0 | 1077 | $1,440 | $1.34 | 4d | 1 | 0.78mi |
| 5352 Dodge Rd Jacksonville, FL | 3.0 | 2.0 | 1050 | $1,261 | $1.20 | 23d | 1 | 0.80mi |
| 5531 Agra Ct Jacksonville, FL | 3.0 | 1.0 | 988 | $1,295 | $1.31 | 14d | 1 | 0.80mi |
| 5350 Dodge Rd Jacksonville, FL | 3.0 | 1.0 | 1000 | $1,500 | $1.50 | 23d | 1 | 0.82mi |
| 1975 Rugby Rd Jacksonville, FL | 2.0 | 1.0 | 992 | $1,100 | $1.11 | 7d | 1 | 0.88mi |
| 2171 W 40th St Jacksonville, FL | 2.0 | 1.0 | 700 | $950 | $1.36 | 23d | 1 | 0.94mi |
| 2050 W 40th St Jacksonville, FL | 3.0 | 1.0 | 1010 | $1,350 | $1.34 | 16d | 1 | 0.95mi |
| 5035 Campenella Dr Jacksonville, FL | 3.0 | 1.0 | 875 | $1,095 | $1.25 | 23d | 1 | 0.96mi |
| 5326 Mays Dr Jacksonville, FL | 3.0 | 1.0 | 900 | $1,200 | $1.33 | 23d | 1 | 0.99mi |
| 5217 Mays Dr Jacksonville, FL | 3.0 | 1.0 | 900 | $1,250 | $1.39 | 7d | 1 | 1.01mi |
| 2221 W 39th St Jacksonville, FL | 2.0 | 1.0 | 675 | $800 | $1.19 | 23d | 1 | 1.02mi |
| 4813 Moncrief Rd Jacksonville, FL | 2.0–3.0 | 1.0 | 755 | $920 | $1.22 | 2d | 8 | 1.05mi |
| 2904 Lippia Rd Jacksonville, FL | 4.0 | 1.0 | 964 | $1,400 | $1.45 | 23d | 1 | 1.06mi |
| 5428 Bunche Dr Jacksonville, FL | 3.0 | 1.0 | 900 | $1,600 | $1.78 | 23d | 1 | 1.09mi |
| 1653 W 35th St Jacksonville, FL | 2.0 | 1.0 | 800 | $825 | $1.03 | 23d | 1 | 1.16mi |
| 4144 Katanga Dr N Jacksonville, FL | 3.0 | 1.0 | 1114 | $1,095 | $0.98 | 23d | 1 | 1.17mi |
| 7927 Reid Ave Jacksonville, FL | 3.0 | 1.0 | 1055 | $1,500 | $1.42 | 23d | 1 | 1.19mi |
| 3997 Leonnie Rd Unit 1 Jacksonville, FL | 2.0 | 1.0 | 840 | $950 | $1.13 | 7d | 1 | 1.25mi |
| 8617 3rd Ave Jacksonville, FL | 3.0 | 1.0 | 1048 | $1,200 | $1.15 | 10d | 1 | 1.27mi |
| 4211 Moncrief Rd W Unit 2 Jacksonville, FL | 2.0 | 1.0 | 840 | $995 | $1.18 | 23d | 1 | 1.27mi |
| 8663 5th Ave Jacksonville, FL | 2.0 | 1.0 | 720 | $1,045 | $1.45 | 23d | 1 | 1.28mi |
| 1839 W 30th St Jacksonville, FL | 3.0 | 1.0 | 828 | $1,050 | $1.27 | 23d | 1 | 1.30mi |
| 6601 Cleveland Rd Jacksonville, FL | 3.0 | 1.0 | 896 | $1,400 | $1.56 | 23d | 1 | 1.30mi |
| 8642 2nd Ave Jacksonville, FL | 3.0 | 2.0 | 1074 | $1,245 | $1.16 | 1d | 1 | 1.31mi |
| 4236 Homer Rd N Jacksonville, FL | 3.0 | 1.0 | 888 | $1,250 | $1.41 | 11d | 1 | 1.32mi |
| 4177 Lorenzo Ct Unit 4 Jacksonville, FL | 2.0 | 1.0 | 840 | $945 | $1.12 | 1d | 1 | 1.32mi |
| 4294 Katanga Dr N Jacksonville, FL | 3.0 | 1.0 | 864 | $1,450 | $1.68 | 23d | 1 | 1.32mi |
Listing history 17 events
-
2026-06-18days on market $75,000 Active 65 DOM
-
2026-06-17days on market $75,000 Active 64 DOM
-
2026-06-16days on market $75,000 Active 63 DOM
-
2026-06-15days on market $75,000 Active 62 DOM
-
2026-06-13pricedays on market $75,000 Active 59 DOM
-
2026-06-10days on market $78,900 Active 56 DOM
-
2026-06-08days on market $78,900 Active 55 DOM
-
2026-06-07days on market $78,900 Active 54 DOM
-
2026-06-05days on market $78,900 Active 51 DOM
-
2026-06-03days on market $78,900 Active 50 DOM
-
2026-06-02days on market $78,900 Active 49 DOM
-
2026-06-01days on market $78,900 Active 48 DOM
-
2026-05-31days on market $78,900 Active 47 DOM
-
2026-05-15price $78,900
-
2026-05-09status Active
-
2026-05-01historical Active Under Contract
-
2026-04-14$89,000 Active
ⓘ Source: listings_history table (triggers on properties + properties_extension) + one-shot
backfill from property_details.listing_events for pre-trigger history.
Tax reassessment forecast FL · Resets to sale price
- Current annual tax
- $1,086 · $90/mo
- Projected year-2 tax
- $1,086 · $90/mo
- Expected delta
- $0/yr ($0/mo · 0.0%)
ⓘ Screening estimate from a state-policy table — verify with the county assessor before closing.
Climate risk First Street
- Flood 1/10 Low FEMA zone X (unshaded) · 0% chance over 30 yrs
- Wildfire 1/10 Low
- Heat 9/10 Extreme 7 d/yr ≥107°F today · 20 d/yr by 30 yrs out
- Wind 9/10 Extreme 99% chance of damaging wind over 30 yrs
- Air quality 4/10 Moderate 6 unhealthy d/yr today · 6 by 30 yrs out
Nearby sold comps map
Loading sold comps map…
Walkable amenities ~0.75 mi
Loading nearby amenities…
Taxation est. · year 1
- Rental income
- $15,310
- − Mortgage interest
- −$4,201
- − Property taxes
- −$1,086
- − Insurance
- −$375
- − Repairs & maintenance
- −$1,225
- − Management
- −$1,225
- − Depreciation
- −$2,182
- Taxable income
- $5,016
- Est. tax owed @ 24.0%
- −$1,204
- After-tax cash flow
- $4,710/yr
For passive investors: Depreciation is non-cash, so a rental often shows a tax loss while cash-flowing — sheltering income. Rental losses are passive: they offset passive income freely, and up to $25,000/yr can offset ordinary (W-2) income if you actively participate and your MAGI is under $100k (phasing out to $0 by $150k); unused losses carry forward. On sale, claimed depreciation is recaptured at up to 25%, and gains may owe capital-gains tax (a 1031 exchange can defer both). Figures are a year-1 estimate at your 24.0% rate — not tax advice; consult a CPA.
Schools (NCES district)
- District
- Duval
- NCES district ID
- 1200480
- Math proficiency
- 46% ▼ -11.00%
- Reading proficiency
- 45% ▼ -4.00%
- Median HH income
- $48,987
- Composite
- 38.97/100
- National rank
- #4076
- State rank
- #48 of 73 in FL
Livability — Jacksonville
- Score
- 83/100
- State rank
- #50
- US rank
- #911
Category grades
Schools grade is shown separately in the Schools card above.
Census & demographics
- Census place
- Jacksonville, FL
- County
- Duval County · 1,015,274 people
- City population
- 979,034
- Metro
- Jacksonville, FL
- Population (ZIP)
- 32,699
- Household income
- $41,324
- Rent vs Own
- Severe rent burden
- 1765.0
Population outlook (Duval County) Hauer SSP2
- Today (2025)
- 1,013,010 people
- By 2030
- 1,059,228 · +4.6%
- By 2040
- 1,141,439 · +12.7%
- By 2050
- 1,205,258 · +19.0%
- By 2075
- 1,324,282 · +30.7%
- By 2100
- 1,319,620 · +30.3%
Race, ethnicity, and origin ACS 2023
- Neighborhood character
- Predominantly Black (77%)
- Race & ethnicity
- Black 77% White 16% Two or more races 4% Hispanic / Latino 3%
- Common ancestry
- Italian 1%
- Foreign-born
- 2% · Canada
- Languages at home
- 97% English-only · Spanish 2%
Political lean MEDSL · Duval
- 2024 margin
- Toss-up / Even · D 48.7% · R 50.1% · Other 1.2%
- 2008→2024 swing
- +0.4pp no change · 2008: -1.9pp · 2024: -1.5pp
- All cycles
- 2024: R+1.5 2020: D+3.8 2016: R+1.5 2012: R+3.6 2008: R+1.9
Not yet ingested
- Civics
- —
Market trends
- HPI YoY
- ▼ -110.56%
- Current HPI
- 217.9706
- Rent YoY
- ▼ -1.36%
- Metro
- Jacksonville, FL
- State GDP YoY
- ▲ 3.28%
- F500 in state
- 36
Industry mix (Fortune 500 HQ in FL)
| Industry | F500 HQs | Revenue |
|---|---|---|
| Industrial Technology | 2 | $29B |
|
||
| Insurance | 2 | $17B |
|
||
| Retail | 1 | $60B |
|
||
| Technology Distribution | 1 | $58B |
|
||
| Homebuilding | 1 | $35B |
|
||
| Technology Manufacturing | 1 | $35B |
|
||
Price history
-11.3% since first listed4 events — show timeline
- 2026-05-15 Price Changed $78,900 realMLS
- 2026-05-09 Relisted — realMLS
- 2026-05-01 Contingent — realMLS
- 2026-04-14 Listed $89,000 realMLS
Property tax history
+12.3%/yrLatest (2025): $1,086 · +18.5% YoY. Source: county tax records.
Cash-flow waterfall
monthlySold comps — $/sqft
last 12 mo · ≤1 miLoading sold comps…