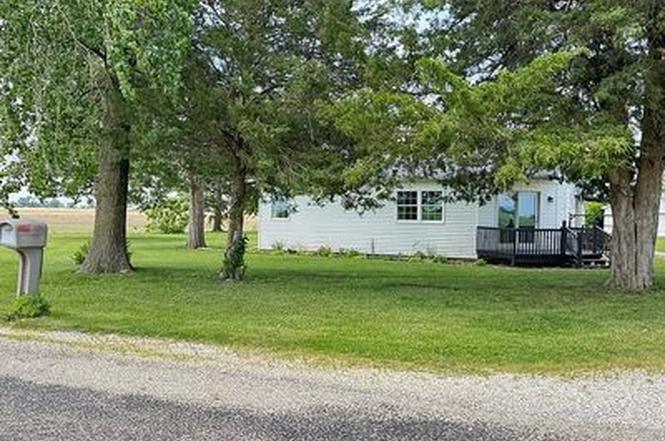
North St · Elwood, IN
Flood risk No data
- FEMA flood zone
- —
- Chance of flooding over 30 yrs
- —
- Est. flood insurance / yr
- —
Fire risk No data
- Est. fire insurance / yr
- —
Heat risk No data
- Hot days now (above threshold)
- —
- Hot days in 30 yrs
- —
Wind risk No data
- Chance of severe wind over 30 yrs
- —
Air-quality risk No data
- Unhealthy air days now
- —
- Unhealthy air days in 30 yrs
- —
Risk factors via First Street. Map © Google.
Why this score? — see what drove the D grade
The composite is a weighted blend of 9 inputs, each scored 0–100. Each bar is that input's sub-score; the figure is the points it added to the 100-point composite (weight × sub-score).
- Cash flow +16.4/30.0
- ARV discount +7.5/15.0
- DSCR +5.1/10.0
- 1% rule +4.5/10.0
- Livability +3.1/5.0
- Rent growth +2.5/5.0
- Condition / age +2.5/5.0
- Schools +1.6/10.0
- Appreciation +0.0/10.0
$136,900
🖨 Deal sheet (PDF) 📄 Offer letter ✓ Due diligence
Listing remarks
Single family house being sold & acirc; & euro; & oelig; AS IS & acirc; & euro; � on 1.5 acres in Madison County, Boone Township and in Madison-Grant United School Corporation. 3 Bedroom with closets, Master and Living room built new in 2005, 1 Full Bath with closet, Living Room, Kitchen/eating area, Utility Room with water heater and washer/dryer hookup, Pex plumbing, 200 amp electrical panel, crawl space and attic, Electric Heat pump and air, Submerged well pump, septic, Appliances included ( refrigerator, dishwasher, microwave, stove) Water Softener is rented from Kevin & acirc; & euro; & trade; s in Elwood, Internet is available from Fiberhawk. 1 car
Key facts
- Pex plumbing
- Septic
- Submerged well pump
Tags
Neighborhood map
What this means for you Summary
Snapshot
- This is a 3-bed/1.0-bath land listed at $137k.
Deal economics
- At list price, monthly cash flow is $77 ($922/yr) — positive.
- The deal already cash-flows at list — no discount required.
- To meet the 1% rule (rent ≥ 1% of price), the offer needs to be $129k (5.4% below list).
- Recommended offer: $129k (5.4% below list) — sets the bar for 1% rule.
- Cap rate 7.0% vs local median 5.3% in Elwood — top-decile yield for the area; either an underpriced asset or a hidden risk that comps aren't pricing in. Stress-test before assuming the spread holds.
Location & tenants
- Location reads 62/100 on livability (#482 in IN) — a middle-class / working-renter tenant base. Strengths: crime A+, cost of living A+, housing A+; Watch: amenities F, commute F, employment D-.
- Elwood Community School Corporation (town): math 18% / reading 19% proficiency, ranked #283 of 301 in IN (top 94%) — low school quality limits family demand, transient renter base, plan for 1-2y turnover.
- Zoned schools: Elwood Elementary School (445 students, 56% FRL); Elwood Jr-Sr High School (math 10% / reading 23%, grade F, #353 of 369 statewide, top 96%, 633 students, 58% FRL) — zoned schools at 56% FRL track the district average.
- Market conditions: 100 active listings in the ZIP; 184 units permitted in Madison County in 2024 (0 in 5+ unit buildings).
Forward outlook
- Local home prices are declining (-3.0%/yr); year-one equity from $946 of loan paydown is wiped out by about $4k of value loss. Plan a longer hold.
- Madison County population projected at -14% by 2050 — secular population decline; favor cash flow + early exit over multi-decade hold.
Negotiation context
- Only 6 days on market — expect competitive offers; lowballing is unlikely to land.
- 2 sale attempts since 25y ago with the ask held roughly flat each time — persistent listings suggest the price (not the market) is what's stuck; bring a comps-based counter.
Risks & watch-outs
- Watch-outs: built in 1950 — expect roof / HVAC / electrical / plumbing capex.
Questions for the listing agent
- Built in 1950 — when were the roof, HVAC, electrical panel, plumbing, and water heater last replaced?
- Is there a deadline driving the sale (1031 exchange, divorce, estate, relocation)? That informs how much negotiation room exists.
- Schools are F-rated, which usually means shorter tenancies and higher turnover. Who's the typical renter profile here, and what's been the actual vacancy rate?
- The area grade is low — what's the realistic commute time and amenity access for the typical tenant pool here? Any planned neighborhood developments (good or bad) we should know about?
- What's the average days-on-market for RENTAL listings here right now (not sales)? A rising rental-DOM trend means longer vacancies and softer asking-rent achievability than the comps imply.
- What's the recent tenant-quality profile in this submarket — average credit score on applications, eviction rate, late-payment / NSF rate, and stable-employment percentage? A property-management company in the area should have these aggregated.
- How much new for-sale + rental construction is in the pipeline within 1–3 miles? Heavy new supply typically softens prices + rents 12–24 months out; constrained supply supports both.
Investment metrics
- 1% rule
- 0.95% ✗
- Cap rate
- 6.97%
- Cash-on-cash
- 2.40%
- DSCR
- 1.11
- GRM
- 8.8
CMA / ARV
No comps found within radius.
Projected returns pro-forma
-3.0% appreciation · 3.0% rent growth · sell at horizon
- IRR
- -12.5%
- Equity multiple
- 0.55×
- Total profit
- $-17,272
- Equity at exit
- $20,412
- IRR
- -3.4%
- Equity multiple
- 0.77×
- Total profit
- $-8,662
- Equity at exit
- $11,837
Cash invested: $38,332 (down + closing). Projections, not guarantees.
Landlord ↔ Tenant lean methodology
- Overall (STATE)
- 90 Strongly Landlord-Friendly
- State Indiana
- 90 Strongly Landlord-Friendly · R+11
- County
- — inherits STATE
- City
- — inherits STATE
ZIP-level market 46036
- Home prices YoY
- -18.3%
- Active inventory
- 100
- Price-to-rent
- 8.8×
Monthly cashflow live
- Estimated rent
- $1,295 medium interval (Pro) →
- Mortgage (P&I)
- −$718
- Tax est. 1.5%
- −$171 /mo · $2,054/yr
- Insurance
- −$57
- HOA
- −$0
- Vacancy / Maint / Mgmt
- −$272
- Net cashflow
- $77
Break-even live
Sensitivity live
| Price | -10% $171 | -5% $124 | +0% $77 | +5% $30 | +10% $-18 |
|---|---|---|---|---|---|
| Rent | -10% $-25 | -5% $26 | +0% $77 | +5% $128 | +10% $179 |
| Rate | -1.0pp $146 | -0.5pp $112 | base $77 | +0.5pp $41 | +1.0pp $5 |
UW: 25.0% down · 7.5% · 30yr · 1.5% tax · 5.0% vac · 8.0% maint · 8.0% mgmt
Financing live
Cash to close
- Down payment
- $34,225
- Closing costs
- $4,107
- Reserves months
- —
- Total cash needed
- —
Loan-product check · same deal, 3 products live
Conventional
25% down · 7.5% · 30yr
- Down + closing
- —
- Monthly P&I
- —
- Monthly cashflow
- —
- DSCR
- —
- Eligible?
- —
Personal DTI + credit; lowest rate.
DSCR
20% down · 8.5% · 30yr
- Down + closing
- —
- Monthly P&I
- —
- Monthly cashflow
- —
- DSCR
- —
- Eligible?
- —
No personal income docs; deal must DSCR.
Hard money
10% down · 12.0% · 12mo
- Down + closing
- —
- Monthly P&I
- —
- Monthly cashflow
- —
- DSCR
- —
- Eligible?
- —
Short-term bridge; refi at stabilization.
Listing history 5 events
-
2026-06-21days on market $136,900 Active 6 DOM
-
2026-06-18days on market $136,900 Active 3 DOM
-
2026-06-17days on market $136,900 Active 2 DOM
-
2026-06-16remarks 667-char remark
-
2026-06-16$136,900 Active 1 DOM
ⓘ Source: listings_history table (triggers on properties + properties_extension) + one-shot
backfill from property_details.listing_events for pre-trigger history.
Nearby sold comps map
Loading sold comps map…
Walkable amenities ~0.75 mi
Loading nearby amenities…
Taxation est. · year 1
- Rental income
- $15,538
- − Mortgage interest
- −$7,669
- − Property taxes
- −$2,054
- − Insurance
- −$684
- − Repairs & maintenance
- −$1,243
- − Management
- −$1,243
- − Depreciation
- −$3,983
- Taxable loss
- −$1,337
- Est. tax savings @ 24.0%
- +$321
- After-tax cash flow
- $1,243/yr
For passive investors: Depreciation is non-cash, so a rental often shows a tax loss while cash-flowing — sheltering income. Rental losses are passive: they offset passive income freely, and up to $25,000/yr can offset ordinary (W-2) income if you actively participate and your MAGI is under $100k (phasing out to $0 by $150k); unused losses carry forward. On sale, claimed depreciation is recaptured at up to 25%, and gains may owe capital-gains tax (a 1031 exchange can defer both). Figures are a year-1 estimate at your 24.0% rate — not tax advice; consult a CPA.
Schools (NCES district)
- District
- Elwood Community School Corporation
- NCES district ID
- 1803300
- Math proficiency
- 18% ▼ -9.00%
- Reading proficiency
- 19% ▼ -9.00%
- Median HH income
- $38,757
- Composite
- 15.6/100
- National rank
- #9292
- State rank
- #283 of 301 in IN
Livability — Elwood
- Score
- 62/100
- State rank
- #482
- US rank
- #17050
Category grades
Schools grade is shown separately in the Schools card above.
Census & demographics
- County
- Madison County · 69,445 people
- City population
- 11,683
- Metro
- Indianapolis-Carmel-Anderson, IN
- Population (ZIP)
- 11,683
- Household income
- $62,074
- Rent vs Own
- Severe rent burden
- 225.0
Population outlook (Madison County) Hauer SSP2
- Today (2025)
- 125,800 people
- By 2030
- 122,640 · -2.5%
- By 2040
- 115,420 · -8.3%
- By 2050
- 108,148 · -14.0%
- By 2075
- 91,838 · -27.0%
- By 2100
- 75,670 · -39.8%
Race, ethnicity, and origin ACS 2023
- Neighborhood character
- Predominantly White (94%)
- Race & ethnicity
- White 94% Hispanic / Latino 3% Two or more races 3%
- Common ancestry
- Iranian 2% Italian 2% Slovak 1%
- Foreign-born
- 1% · Canada
- Languages at home
- 97% English-only · Spanish 2%
Political lean MEDSL · Madison
- 2024 margin
- Strong R (+26.9) · D 35.6% · R 62.5% · Other 1.9%
- 2008→2024 swing
- -33.5pp toward R · 2008: 6.5pp · 2024: -26.9pp
- All cycles
- 2024: R+26.9 2020: R+22.6 2016: R+25.7 2012: R+4.5 2008: D+6.5
Not yet ingested
- Civics
- —
Market trends
- HPI YoY
- ▼ -70.59%
- Current HPI
- 314.8526
- Rent YoY
- —
- Metro
- Indianapolis-Carmel-Anderson, IN
- State GDP YoY
- ▲ 2.90%
- F500 in state
- 18
Industry mix (Fortune 500 HQ in IN)
| Industry | F500 HQs | Revenue |
|---|---|---|
| Industrial Machinery | 2 | $37B |
|
||
| Healthcare | 1 | $177B |
|
||
| Pharmaceuticals | 1 | $45B |
|
||
| Metals / Steel | 1 | $18B |
|
||
| Agriculture | 1 | $17B |
|
||
| Packaging | 1 | $12B |
|
||
Price history
+447.6% since first listed3 events — show timeline
- 2026-06-16 Listed $136,900 FSBO.com
- 2003-02-02 Listing Removed — MIBOR as Distributed by MLS Grid
- 2001-02-03 Listed $25,000 MIBOR as Distributed by MLS Grid
Cash-flow waterfall
monthlySold comps — $/sqft
last 12 mo · ≤1 miLoading sold comps…